Download presentation
Presentation is loading. Please wait.

1
Logistic Regression For a binary response variable: 1=Yes, 0=No This slide show is a free open source document. See the last slide for copyright information.

2
Binary outcomes are common and important The patient survives the operation, or does not. The accused is convicted, or is not. The customer makes a purchase, or does not. The marriage lasts at least five years, or does not. The student graduates, or does not.

3
For a binary variable The population mean E[Y] is the probability that Y=1 Make the mean depend on a set of explanatory variables Consider one explanatory variable. Think of a scatterplot
![For a binary variable The population mean E[Y] is the probability that Y=1 Make the mean depend on a set of explanatory variables Consider one explanatory variable.](http://images.slideplayer.com/32/10053755/slides/slide_3.jpg "Think of a scatterplot.")
4
Least Squares vs. Logistic Regression

5
The logistic regression curve arises from an indirect representation of the probability of Y=1 for a given set of x values. Representing the probability of an event by

6
If P(Y=1)=1/2, odds =.5/(1-.5) = 1 (to 1) If P(Y=1)=2/3, odds = 2 (to 1) If P(Y=1)=3/5, odds = (3/5)/(2/5) = 1.5 (to 1) If P(Y=1)=1/5, odds =.25 (to 1)
=1/2, odds =.5/(1-.5) = 1 (to 1) If P(Y=1)=2/3, odds = 2 (to 1) If P(Y=1)=3/5, odds = (3/5)/(2/5) = 1.5 (to 1) If P(Y=1)=1/5, odds =.25 (to 1)")
7
The higher the probability, the greater the odds

8
Linear model for the log odds Natural log, not base 10 Symbolized ln

9
Some facts about ln The higher the probability, the higher the log odds. ln(e)=1, e = 2.1728… Only defined for positive numbers. So logistic regression will not work for events of probability exactly zero or exactly one (why not one?)
=1, e = … Only defined for positive numbers. So logistic regression will not work for events of probability exactly zero or exactly one (why not one ).")
10
The log of a product is the sum of logs This means the log of an odds ratio is the difference between the two log odds quantities.

11
Linear regression model for the log odds of the event Y=1

12
Equivalent Statements

13
In terms of log odds, logistic regression is like regular regression

14
In terms of plain odds, Logistic regression coefficients represent odds ratios For example, “Among 50 year old men, the odds of being dead before age 60 are three times as great for smokers.”

15
Logistic regression X=1 means smoker, X=0 means non- smoker Y=1 means dead, Y=0 means alive Log odds of death = Odds of death =

18
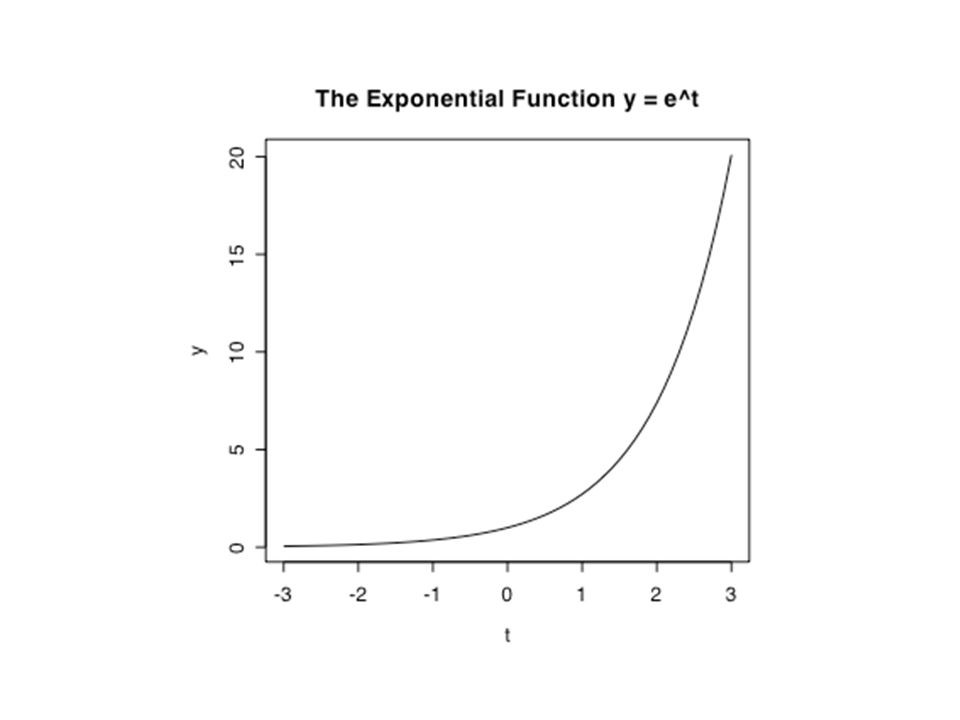
Exponential function f(t) = e t Always positive e 0 =1, so when, the odds ratio equals one (50-50). f(t) = e t is increasing
 = e t is increasing.")
19
One more example

20
For any given disease severity x,

21
In general, When x k is increased by one unit and all other explanatory variables are held constant, the odds of Y=1 are multiplied by That is, is an odds ratio --- the ratio of the odds of Y=1 when x k is increased by one unit, to the odds of Y=1 when everything is left alone. As in ordinary regression, we speak of “controlling” for the other variables.

22
The conditional probability of Y=1 This formula can be used to calculate an estimated P(Y=1) Just replace betas by their estimates (b) It can also be used to calculate the probability of getting The sample data values we actually did observe.
 Just replace betas by their estimates (b) It can also be used to calculate the probability of getting The sample data values we actually did observe.")
23
Maximum likelihood estimation Likelihood = Probability of getting the data values we did observe Viewed as a function of the parameters (betas), it’s called the “likelihood function.” Those parameter values for which the likelihood function is greatest are called the maximum likelihood estimates. Thank you again, Mr. Fisher.

24
Likelihood Function for Simple Logistic Regression

25
Maximum likelihood estimates Must be found numerically. Lead to nice large-sample chi-square tests. We will mostly use Wald tests.

26
Copyright Information This slide show was prepared by Jerry Brunner, Department of Statistical Sciences, University of Toronto. It is licensed under a Creative Commons Attribution - ShareAlike 3.0 Unported License. Use any part of it as you like and share the result freely. These Powerpoint slides are available from the course website: http://www.utstat.toronto.edu/~brunner/oldclass/441s16

Similar presentations


 Introduction to Generalized Linear Models The simplest logistic regression.>")


 Cox-Regression>")


 among 33 adult women.>")


