Download presentation
Presentation is loading. Please wait.

3
NEXT

9
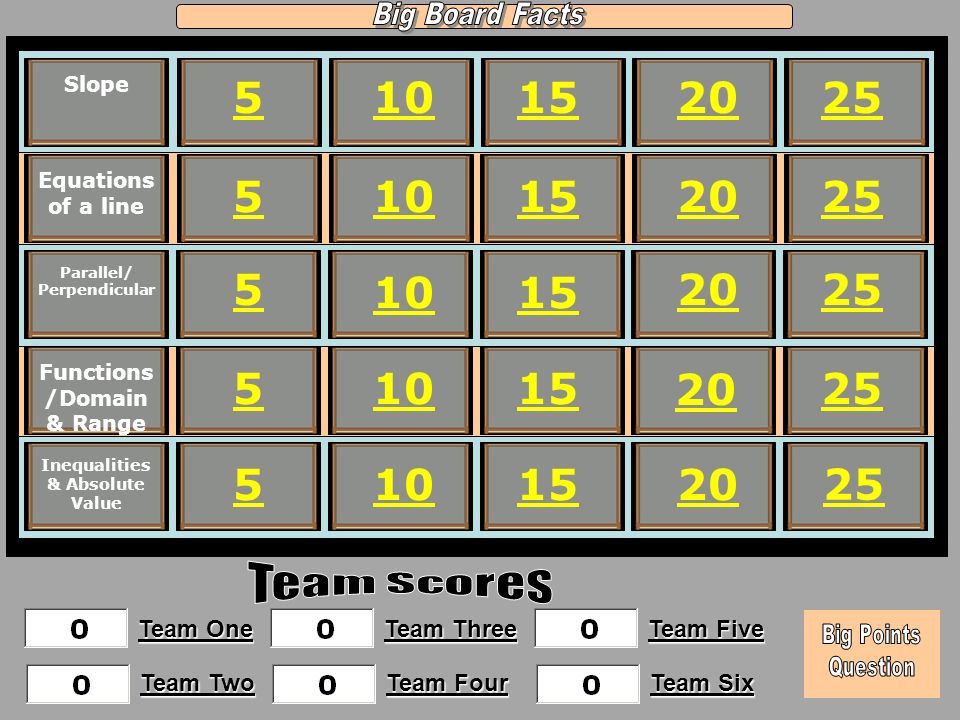
15 20 25 510 Slope Equations of a line Parallel/ Perpendicular Functions /Domain & Range Inequalities & Absolute Value 5 5 5 5 10 15 20 25 20 Team One Team Two Team Three Team Four Team Five Team Six

10
SLOPE 5 Points Calculate the slope of a line passing through the points belowthe slope F(9,11) E(12,7) Show Answer
 E(12,7) Show Answer")
11
SLOPE Back to Board

12
SLOPE 10 Points Calculate the slope from the graph belowslope from the graph below Show Answer

13
SLOPE Back to Board Run = 2 Rise =1

14
SLOPE 15 Points Raj charts the volume of water in a leaky water tank. The volume, in gallons, over time, in minutes, is shown on the graph. What is the rate, in gallons per minutes, at which the volume of water in the tank is decreasing? Show Answer

15
SLOPE -0.3 gallons per minute Back to Board

16
SLOPE 20 Points The slope of a line is -2 and the line contains the points (7,4) and (x, 12). What is the value of x? Show Answer

17
SLOPE 3 Back to Board

18
SLOPE 25 Points Show Answer The graph shows the distance between an airplane in flight and a control tower over time. Which statement best describes the aircraft’s movement? A.The airplane is moving toward the tower at a rate of 2.5 miles per minute. B.The airplane is moving toward the tower at a rate of 25 miles per minute. C.The airplane is moving away from the tower at a rate of 2.5 miles per minute. D.The airplane is moving away from the tower at a rate of 25 miles per minute.

19
SLOPE A Back to Board

20
EQUATIONS OF A LINE 5 Points Show Answer Find the equation of the line with the given slope that passes through the given point m=2 and (-1,5)slope
slope")
21
EQUATIONS OF A LINE y=2x+7 Back to Board

22
EQUATIONS OF A LINE 10 Points Show Answer Write the equation of the line graphed below. Express your answer in standard form.

23
EQUATIONS OF A LINE 3x+y=8 Back to Board Run = 1 Rise = -3

24
EQUATIONS OF A LINE 15 Points Show Answer Find the equation of the line that passes through the following two points: (1,12) and (-3,5) Express your answer in slope intercept form.
 and (-3,5) Express your answer in slope intercept form.")
25
EQUATIONS OF A LINE Back to Board

26
EQUATIONS OF A LINE 20 Points Show Answer Write the equation of the line pictured in the graph below. Express your answer in slope intercept form

27
EQUATIONS OF A LINE y=-3x+4 Back to Board Run = 1 Rise = -3

28
EQUATIONS OF A LINE 25 Points Show Answer Convert the point slope equation to slope intercept formConvert the point slope equation to slope intercept form. y-5=6(x-8)
.")
29
EQUATIONS OF A LINE y=6x-43 Back to Board

30
PARALLEL/PERPENDICULAR 5 Points Show Answer Line l is perpendicular to line m below. What is the slope of line l?

31
PARALLEL/PERPENDICULAR Back to Board

32
PARALLEL/PERPENDICULAR Show Answer Which of the following graphs shows a line parallel to ?

33
PARALLEL/PERPENDICULAR D Back to Board

34
PARALLEL/PERPENDICULAR Show Answer On the coordinate grid below, line l is parallel to What is the slope of line l?

35
PARALLEL/PERPENDICULAR Back to Board

36
PARALLEL/PERPENDICULAR Show Answer Yael graphs line on a coordinate grid through points A(-10,4) and B(5,3). If is perpendicular to, what is the slope of ?

37
PARALLEL/PERPENDICULAR 15 Back to Board

38
PARALLEL/PERPENDICULAR 25 Points Show Answer City engineers use a map of the city showing street locations on a coordinate grid. The section below shows the map coordinates of two points on Main Street and one point on Elm Street. If Main Street runs perpendicular to Elm Street, which of the following equations best describes the path of Elm Street? A. y=-3x+18B. y=3xC. D.

39
PARALLEL/PERPENDICULAR A Back to Board

40
FUNCTIONS/DOMAIN & RANGE 5 Points Show Answer Which set of ordered pairs does NOT represent a function? A.{(4,8), (1,8), (5,11), (0,0)} B.{(2,1), (1,2), (2,0), (5,5)} C.{(0,0), (1,1), (2,4), (3,9)} D. {(1,7), (4,7), (7,7), (10,7)}
, (1,8), (5,11), (0,0)} B.{(2,1), (1,2), (2,0), (5,5)} C.{(0,0), (1,1), (2,4), (3,9)} D. {(1,7), (4,7), (7,7), (10,7)}.")
41
FUNCTIONS/DOMAIN & RANGE B Back to Board

42
FUNCTIONS/DOMAIN & RANGE 10 Points Show Answer Damon recorded the daily high temperature (in degrees Celsius) in his back yard for 12 consecutive days and graphed the results. Which of the following values is NOT in the range of temperatures in the graph? A. 13B. 15C. 22D. 26

43
FUNCTIONS/DOMAIN & RANGE D Back to Board

44
FUNCTIONS/DOMAIN & RANGE 15 Points Show Answer Set A={(1,4), (4,7), (3,7), (5,9), (9,2)} Which of the following statements is NOT true? A.The domain of A is {1, 4, 3, 5, 7, 9} B. A is a function C. The range of A is {4, 7, 9, 2} D. A is a relation

45
FUNCTIONS/DOMAIN & RANGE A Back to Board

46
FUNCTIONS/DOMAIN & RANGE 20 Points Show Answer If {-3, -1, 1, 2, 3} is the domain, what is the range of A.{-3, -1, 1, 2} B.{0, 2, 6, 12} C.{1, 4, 9} D.{-3, -2, -1, 1}

47
FUNCTIONS/DOMAIN & RANGE B Back to Board

48
FUNCTIONS/DOMAIN & RANGE 25 Points Show Answer A farmer uses a large cylindrical water tank for irrigation. When the farmer waters his fields, the depth in the tank decreases at a steady rate of 0.3 inch per minute. After 20 minutes of watering, the depth of the water in the tank is 9 inches. Which graph shows the relationship between d, the depth of the water in inches, and t, the time in minutes? A. B. C.

49
FUNCTIONS/DOMAIN & RANGE BAt x=20 y value is at 9 Back to Board

50
INEQUALITIES & ABSOLUTE VALUE 5 Points Show Answer Karen graphed the inequality shown on the coordinate plane. Which of the following inequalities best represents the graph? A. B. C. D.

51
INEQUALITIES & ABSOLUTE VALUE C Back to Board

52
INEQUALITIES & ABSOLUTE VALUE 10 Points Show Answer Which of the following shows the solution to the inequality shown below? A. B. C. D.

53
INEQUALITIES & ABSOLUTE VALUE D Back to Board

54
INEQUALITIES & ABSOLUTE VALUE 15 Points Show Answer The graph shows a system of linear inequalities. Which of the following (x,y) coordinate pairs is NOT a solution to the system of inequalities? A. (0,0) B. (0,6) C. (-5,0) D. (0,-2)
 coordinate pairs is NOT a solution to the system of inequalities. A. (0,0) B. (0,6) C. (-5,0) D. (0,-2).")
55
INEQUALITIES & ABSOLUTE VALUE Solutions are in the shaded region or on a SOLID line X A in shaded region √ B on dotted line X C in shaded region X D on solid line Back to Board

56
INEQUALITIES & ABSOLUTE VALUE 20 Points Show Answer Which graph shows the solution to the inequality shown below? A. B. C. D.

57
INEQUALITIES & ABSOLUTE VALUE Answer for 20 Points B Back to Board

58
INEQUALITIES & ABSOLUTE VALUE Show Answer Solve the absolute value inequality

59
INEQUALITIES & ABSOLUTE VALUE Back to Board

60
Show Question

61
“Big Points” Question Which of the following linear systems has infinitely many solutions? A. 15x + 5y = 20B. 15x - 5y = 20 6x – 2y = 8 6x – 2y = -8 C. 15x – 5y = -20D. 15x – 5y = 20 6x – 2y = 8 6x – 2y = 8 Show Answer 302928272625242322212019181716151413121110987654321

62
Big Points Answer for Big Points D Back to Board

Similar presentations


 parallel to and b.) perpendicular to y = ¾x + 1 passing through (6,2) 2. Find the standard.>")