Download presentation
Presentation is loading. Please wait.

1
The Sample Variation Method A way to select sample size This slide show is a free open source document. See the last slide for copyright information.

2
The sample variation method is not traditional Statisticians usually recommend that sample size be based on a power analysis. Statistical power is the probability of rejecting the null hypothesis when the null hypothesis is false. Power depends on sample size and how wrong H 0 is (effect size).
..")
3
How to select sample size by power Pick an effect size you’d like to be able to detect. It should be just over the boundary of interesting and meaningful. Pick a desired power – a probability with which you’d like to be able to detect the effect by rejecting the null hypothesis. Start with a fairly small n and calculate the power. Increase the sample size until the desired power is reached.

4
Power analysis is a Greek letter story It’s a fairly long story too. Best left to STA305. The sample variation method is quick and easy.

5
F test is based upon Increase in explained variation expressed as a fraction of the variation that the reduced model does not explain.

6
For any given sample size, the bigger a is, the bigger F becomes. For any a ≠0, F increases as a function of n. So you can get a large F from strong results and a small sample, or from weak results and a large sample.

7
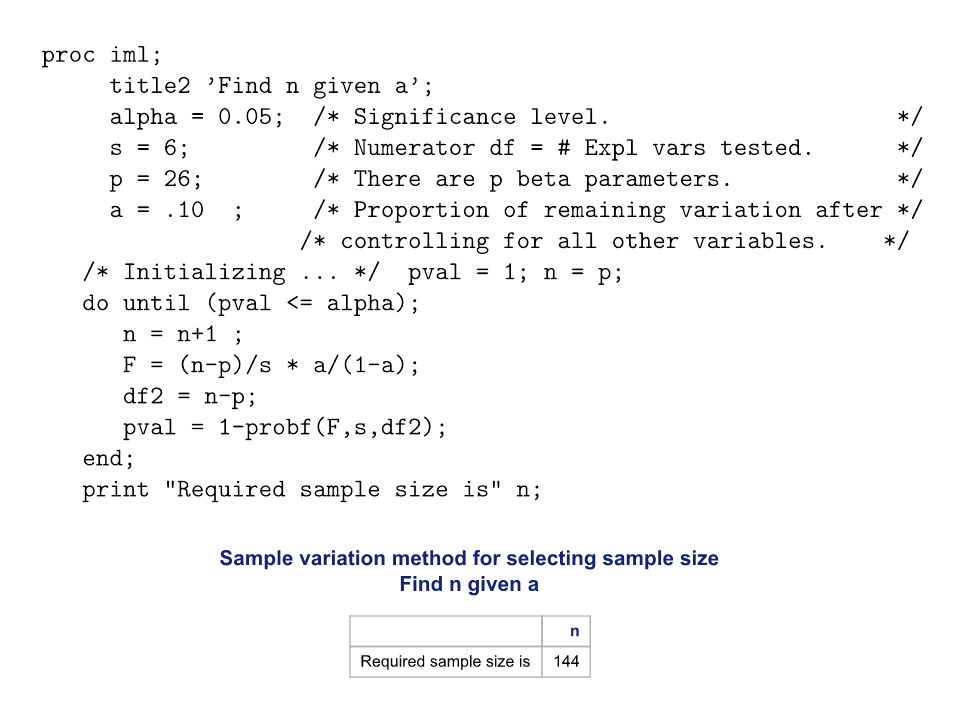
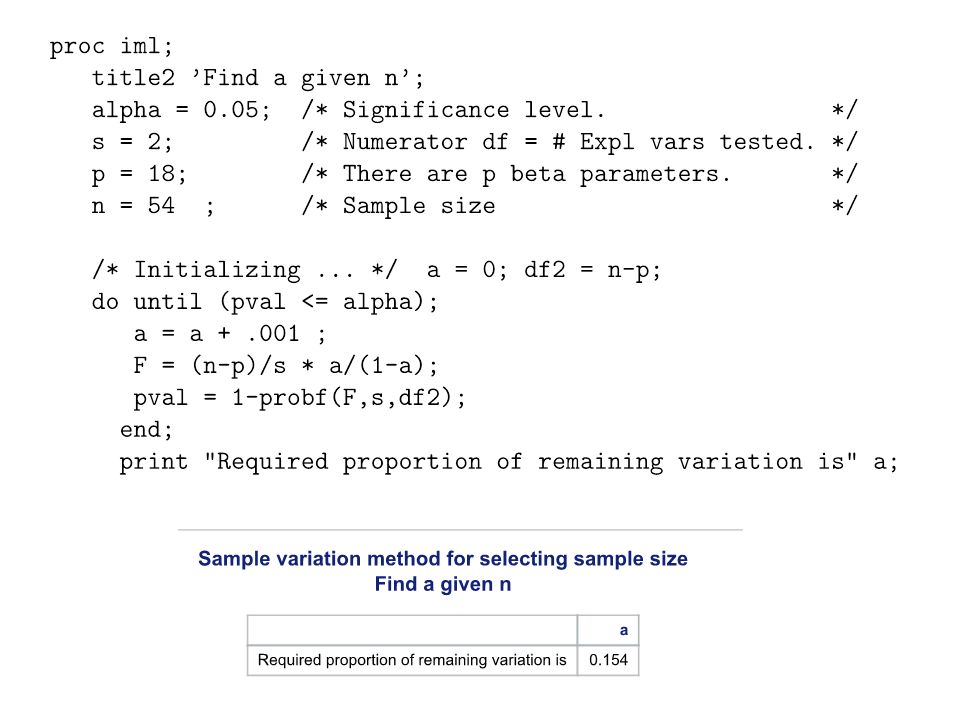
The sample variation method is to choose a value of a that is just large enough to be interesting, and increase n, calculating F and its p-value each time until p < 0.05; then stop. The final value of n is the smallest sample size for which an effect explaining that much of the remaining variation will be significant. With that sample size, the effect will be significant if and only if it explains a or more of the remaining variation. That's all there is to it. You tell me a proportion of remaining variation that you want to be statistically significant, and I'll tell you a sample size.

8
Example Suppose we are planning a 2x3x4 analysis of covariance, with two covariates, and factors named A, B and C. We are setting it up as a regression model, with one dummy variable for A, 2 dummy variables for B, and 3 for C. Interactions are represented by product terms, and there are 2 products for the AxB interaction, 3 for AxC, 6 for BxC, and 1*2*3 = 6 for AxBxC. The regression coefficients for these plus two for the covariates and one for the intercept give us p = 26. The null hypothesis is that of no BxC interaction, so r = 6. The "other effects in the model" for which we are "controlling" are represented by 2 covariates and 17 dummy variables and products of dummy variables.

10
Potato Example In the potato data, there are 3 potatoes per treatment combination in a Temperature (2 levels) by Bacteria type (3 levels) by Oxygen level (3 levels) design. What pro- portion of remaining variation is required for the main effect of bacteria type to be significant?

12
Copyright Information This slide show was prepared by Jerry Brunner, Department of Statistical Sciences, University of Toronto. It is licensed under a Creative Commons Attribution - ShareAlike 3.0 Unported License. Use any part of it as you like and share the result freely. These Powerpoint slides are available from the course website: http://www.utstat.toronto.edu/~brunner/oldclass/441s16

Similar presentations


 Chapter 14 Introduction to Multiple Regression.>")


