Download presentation
Presentation is loading. Please wait.

1
How far away is the moon? ( An adventure in signal detection theory and allusive science) Harold E. Brooks NOAA/National Severe Storms Laboratory Norman, Oklahoma, USA Harold.Brooks@noaa.gov

2
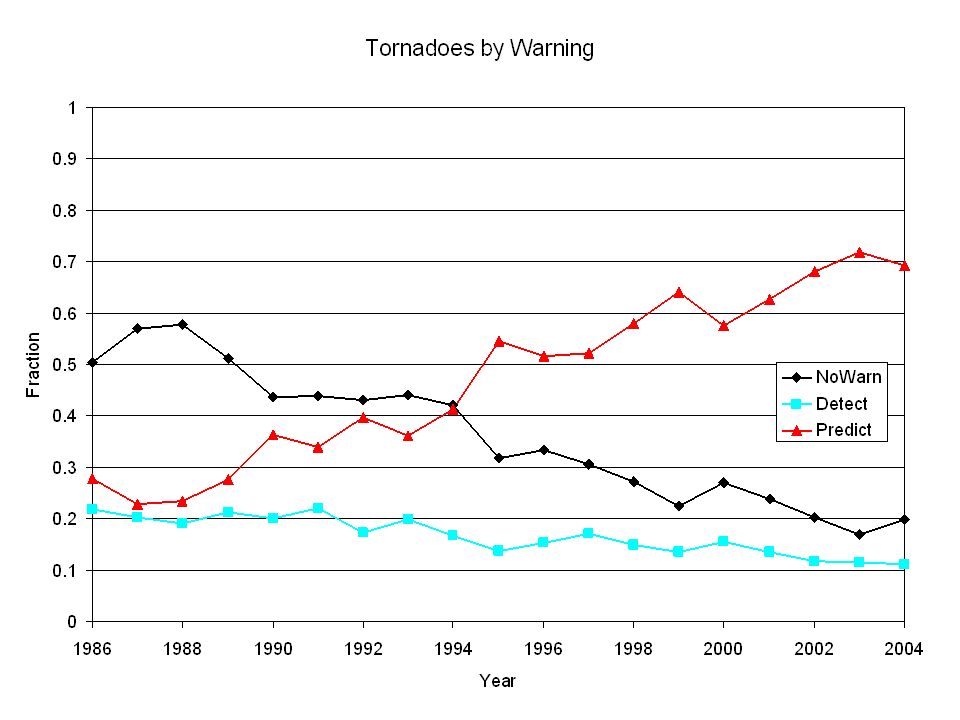
Aside on lead time Three classes of tornadoes –Warned before tornado occurs (predict) –Warned after tornado occurs (detect) –The Unwarned
 –Warned after tornado occurs (detect) –The Unwarned")
5
Signal detection theory Classify event as yes or no with uncertain evidence –Threshold for evidence John Swets 50 th anniversary of first work Mason (1982) Aust. Meteorol. Mag.

6
Weight of evidence Yes No D'

7
Weight of evidence Yes No D'

8
2x2 Table a = Correct fore. of events, d = Correct non-event b = False alarm, c = Missed event Probability of detection=a/(a+c) Probability of false detection=b/(b+d) False alarm ratio = b/(a+b) Ob. YesOb. NoSum Fore.Yesaba+b Fore. Nocdb+d Suma+cb+dN
 Probability of false detection=b/(b+d) False alarm ratio = b/(a+b) Ob. YesOb. NoSum Fore.Yesaba+b Fore. Nocdb+d Suma+cb+dN.")
9
2x2 Table (D'=1,climo = 0.1) Probability of detection=0.33 Probability of false detection=0.07 False alarm ratio = 0.67 Ob. YesOb. NoSum Fore.Yes3367100 Fore. No67833900 Sum1009001000

10
2x2 Table (D'=1,climo = 0.1) Probability of detection=0.50 Probability of false detection=0.16 False alarm ratio = 0.74 Ob. YesOb. NoSum Fore.Yes50143193 Fore. No50757807 Sum1009001000

11
2x2 Table (D'=1,climo = 0.1) Probability of detection=0.90 Probability of false detection=0.61 False alarm ratio = 0.86 Ob. YesOb. NoSum Fore.Yes90550640 Fore. No10350360 Sum1009001000

12
2x2 Table (D'=1,climo = 0.1) Probability of detection=0.006 Probability of false detection=0.0002 False alarm ratio = 0.25 Ob. YesOb. NoSum Fore.Yes0.60.20.8 Fore. No99.4899.8999.2 Sum1009001000

13
Relative Operating Characteristics

14
No skill Hypothetical Forecasts Area under curve is measure of system performance

15
On-line introduction –Claremont Graduate University –http://acad.cgu.edu/wise/sdt/intro.htmlhttp://acad.cgu.edu/wise/sdt/intro.html

16
Relative Operating Characteristics (Normal deviate space) D'
 D")
17
MDA and tornadoes

18
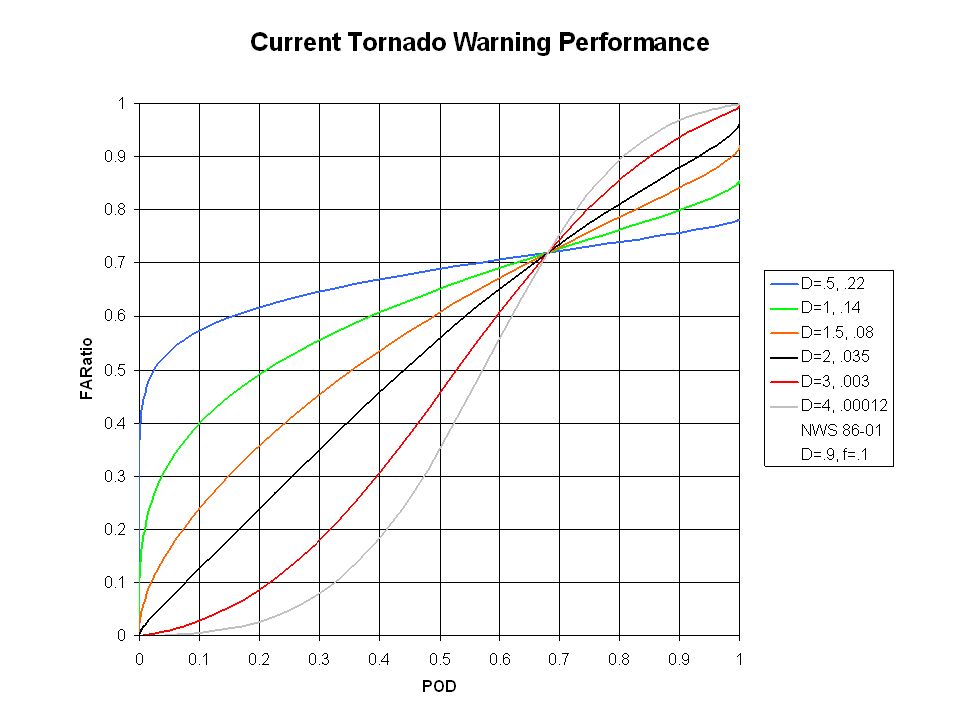
Model the warning process (statistically) Assume Gaussian model of SDT applies –True for many problems (cancer, code interception, credit card fraud, NWP) –Equal variance for simplicity Vary distance (D'), find curves in POD/FAR space that go through current performance D' ~ “science/technology”
 Assume Gaussian model of SDT applies –True for many problems (cancer, code interception, credit card fraud, NWP) –Equal variance for simplicity Vary distance (D ), find curves in POD/FAR space that go through current performance D ~ science/technology")
19
How to do it? Need all 4 elements of 2x2 table Need 3 equations (total events=1) –POD (from ROC) –POFD (from ROC) –Fraction of storms considered that are tornadic (f) Vary until POD/FAR curve goes through current performance
 –POD (from ROC) –POFD (from ROC) –Fraction of storms considered that are tornadic (f) Vary until POD/FAR curve goes through current performance.")
24
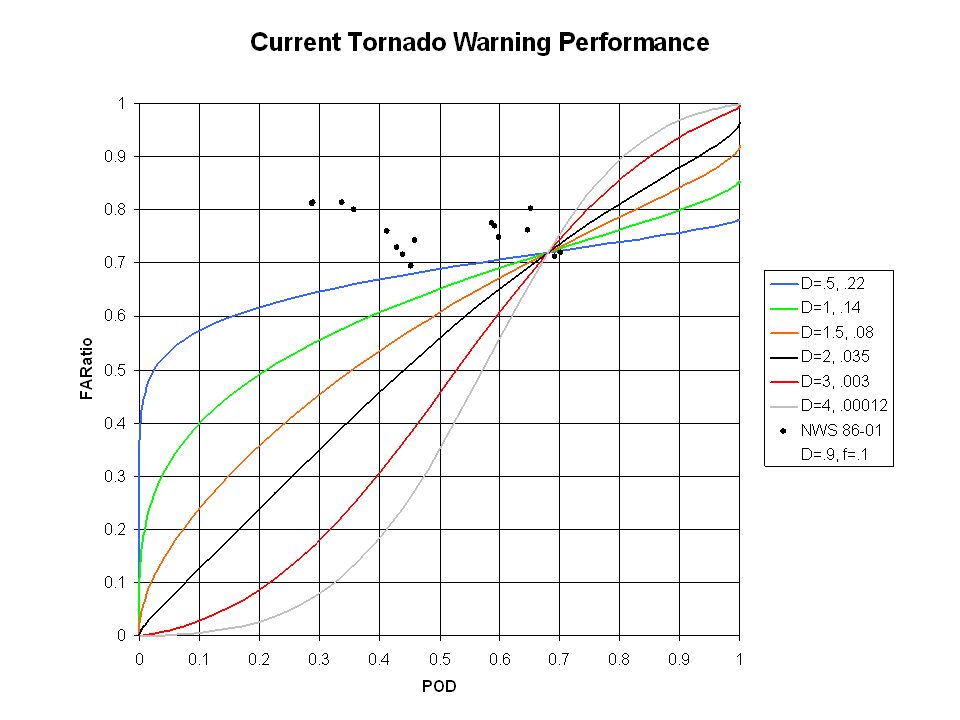
Current status Unless number of events considered possibly tornadic is large, FAR=0.25 is unrealistic Understanding/NEXRAD/training/SPC perhaps moved us from D' ~0.5 to D'>1

25
NWS Tornado Warning History

26
Comments (1) For current “science”, FARatio less sensitive than POD Era comparisons –1980s possibly pessimistic –1999, 2001 possibly optimistic
 For current science , FARatio less sensitive than POD Era comparisons –1980s possibly pessimistic –1999, 2001 possibly optimistic")
27
Comments (2) Moved D'~0.5-0.9 since late-1980s Need to move D'~1 by 2025 Same or slightly faster rate than last 15 years
 Moved D ~ since late-1980s Need to move D ~1 by 2025 Same or slightly faster rate than last 15 years")
28
Apollo Project Political, not scientific, decision Why haven’t we been to Mars?

Similar presentations


 are reasonably the same when performed and.>")


 By: Jeffrey Curtis and Jessica McLaughlin.>")


