Download presentation
Presentation is loading. Please wait.

1
Arizona LEARNS: Overview of the Achievement Profiles

2
Part 1: An Overview of the AZ LEARNS Model Basis of the model is AIMS School average is compared to state average Baseline 1999-2000 % of students meeting/exceeding Change points Credit for increasing percent of students in M/E Credit for decreasing FFB students Added Evidence Stanford 9 – One Year’s Growth (OYG) Extended Writing for Grades 3-8 Impact is relatively small Mobility and ELL’s not included
 Extended Writing for Grades 3-8 Impact is relatively small Mobility and ELL’s not included")
3
A Single Designation for Each School (Based on Multiple Subject Area Designations) School Designations E = Excelling I = Improving M = Maintaining Performance U = Underperforming School Designation = M Math 3 rd Grade = I Math 5 th Grade = M Reading 3 rd Grade = M Reading 5th Grade = U Writing 3 rd Grade = I Writing 5th Grade = I (Example Elementary School) If One possible scenario There are many possible scenarios that could lead to a designation
 School Designations E = Excelling I = Improving M = Maintaining Performance U = Underperforming School Designation = M Math 3 rd Grade = I Math 5 th Grade = M Reading 3 rd Grade = M Reading 5th Grade = U Writing 3 rd Grade = I Writing 5th Grade = I (Example Elementary School) If One possible scenario There are many possible scenarios that could lead to a designation")
4
How Designations for Each Subject and Grade are Determined Change Points % Mastery Status Groupings 1. What is your school baseline grouping?

5
What is your school baseline grouping? % Mastery Status Groupings Your school is placed into a Group (1- 5) based on the percent of students with Meeting or Exceeding scores on each AIMS content area during the school year 99-00 (Relative to the State mean) Your school is placed into Group 6 only if it has a mastery of 90% or higher over 3 years For example: If your school had a Mastery rate of 45% for 5 th grade Math it would be placed into Group 4
 based on the percent of students with Meeting or Exceeding scores on each AIMS content area during the school year (Relative to the State mean) Your school is placed into Group 6 only if it has a mastery of 90% or higher over 3 years For example: If your school had a Mastery rate of 45% for 5 th grade Math it would be placed into Group 4.")
6
How Designations for Each Subject Area are Determined % Mastery Status Groupings Percent of Students with Meeting or Exceeding Scores on the AIMS (School year 99-00) 1. What is your school grouping? 2. How much did your school change on AIMS? Change Points

7
How much did your school change? How school change points are computed for grades 3,5,8 Credit is given if the school increases the percent of its students that Meet or Exceed on AIMS Credit is given if the school decreases the percent of its students that Fall Far Below on AIMS Credit given for Added Evidence from the Stanford 9 (OYG) and Extended Writing on AIMS
 and Extended Writing on AIMS.")
8
Example: School Change Points Percent of students at the school with Falls Far Below scores Year 2000 (Baseline) 20% Average from last 3 years 18% Difference 2% Percent of students at the school with Meets or Exceeds scores Year 2000 (Baseline) 40% Average from last 3 years 50% Difference 10% Total School Change Points: 12
 20% Average from last 3 years 18% Difference 2% Percent of students at the school with Meets or Exceeds scores Year 2000 (Baseline) 40% Average from last 3 years 50% Difference 10% Total School Change Points: 12")
9
Example: Adjusting Your School Change Points Using Added Evidence School Change Points will be added if you have 60% or higher students making one year’s growth (OYG). OYG is based on the Stanford 9. To achieve OYG, students need to get at least the same or higher stanine for two consecutive years. For example; If your school had 90% of students making OYG, then you could get almost 4% added to your 3 rd grade Math change points. This is added to AIMS Growth Points for Reading and Math for Grades 3,5,8 (Elementary and Middle Schools).
..")
10
Example: Adjusting Change Points Using Added Evidence (Cont.) Extended Writing from AIMS School Change Points will be added based on the percent of students with 24 or more points from the Extended Writing subtest on the AIMS. For example, if your school had 50% of its students with Extended Writing scores of 24 or higher, then you could get 3.3% added to your 3 rd grade Writing change points This applies to Writing for Grades 3,5,8

11
How Designations for Each Subject Area are Determined Change Points % Mastery Status Groupings Percent of Students with Meeting or Exceeding Scores on the AIMS (School year 99-00) 1. Where did your school start? 2. How much did your school change on AIMS? (Last 3-year average %) – (school year 2000 %)
 – (school year 2000 %).")
12
Working Through an Example School Change Points % Mastery Status Groupings Elementary School A Math 3 rd Grade 8.3%15.81%23.32%.79%-6.72% The Math Designation for this grade is: I or (5 points) 14.0 3 Added Evidence for Math OYG = 90% Added points = 3.91 17.91 State Values
 Added Evidence for Math OYG = 90% Added points = State Values")
13
A Single Designation for Each School (Based on Multiple Subject Area Designations) School Designations E = Excelling I = Improving M = Maintaining Performance U = Underperforming School Designation = M Math 3 rd Grade = I Math 5 th Grade = M Reading 3 rd Grade = M Reading 5th Grade = U Writing 3 rd Grade = I Writing 5th Grade = I (Example Elementary School) If One possible scenario There are many possible scenarios that could lead to a designation
 School Designations E = Excelling I = Improving M = Maintaining Performance U = Underperforming School Designation = M Math 3 rd Grade = I Math 5 th Grade = M Reading 3 rd Grade = M Reading 5th Grade = U Writing 3 rd Grade = I Writing 5th Grade = I (Example Elementary School) If One possible scenario There are many possible scenarios that could lead to a designation")
14
Elementary School A Designation Values Math 3 rd I = 5 Math 5 th M = 3 Reading 3 rd M = 3 Reading 5 th U = 0 Writing 3 rd I = 5 Writing 5 th I = 5 Total value 21 Working Through an Example School (Cont.) This yields an overall school designation value of 21
 This yields an overall school designation value of 21")
15
Classification Table for Elementary Schools with 6 Subject by Grade Combinations DesignationFromTo U08 M923 I2441 E42

16
Part 2: An Overview of the Achievement Profile Data

17
School Designation Using TUSD Data School Designation Using ADE Data The online report shows both state and TUSD data for School Designation ….

18
Subject by Grade Level Designation Using TUSD Data Subject by Grade Level Designation Using ADE Data..and subject by grade level Designation.

19
Any discrepancy between ratings (Subject/Grade or Overall) indicates a rating close to change. What does a discrepancy mean?

20
The Baseline Group is determined by the percent of students with meeting or exceeding scores on AIMS in school year 99-00 (the baseline year). Cut points for Baseline Groups differ across subjects and grade levels. Baseline Group

21
The percent of students with Meeting or Exceeding scores on the AIMS in School Year 99-00 Baseline Percent Mastery

22
The percent of students with Falls Far Below scores on the AIMS in School Year 99-00 Baseline Percent Falls Far Below

23
The average percent of students with Meeting or Exceeding scores on the AIMS for School Years 99-00 00-01 01-02 Past 3-Year Percent Mastery

24
The average percent of students with Falls Far Below scores on the AIMS for School Years 99-00 00-01 01-02 Past 3-Year Percent Falls Far Below

25
Change points for Meeting and Exceed are computed as (3yr avg %) – (Baseline %) Change Points: Meeting or Exceeding
 – (Baseline %) Change Points: Meeting or Exceeding")
26
Change points for Falls Far Below are computed as (Baseline %) - (3yr avg %) Change Points: Falls Far Below
 - (3yr avg %) Change Points: Falls Far Below")
27
Added Evidence for Reading is based on the percent of students with OYG from Stan9 Reading Added Evidence Added Evidence for Math is based on the percent of students with OYG from Stan9 Math Added Evidence for Writing is based on the percent of students with scores of 24 or higher on the Extended Writing portion of the AIMS *Added Evidence for a High School is based on Dropout and Graduation Rates

28
Total Change points are the Sum of M/E Change Points, FFB Change Points, and Added Evidence Total Change Points

29
This is the number of points required for the next Highest Designation Cut Points for Lower and Higher Categories This is the number of points required for the next Lowest Designation

30
For Example: This school is very close in 3 rd grade writing to the Improving cut point (noted in green). Cut Points for Lower and Higher Categories (Example)
.")
31
They are also close in 3 rd grade math to the Maintaining cut point (noted in green). Cut Points for Lower and Higher Categories (Example)
.")
32
However, This school is also close in 5 th grade writing to the lower cut point. Cut Points for Lower and Higher Categories (Example)
.")
33
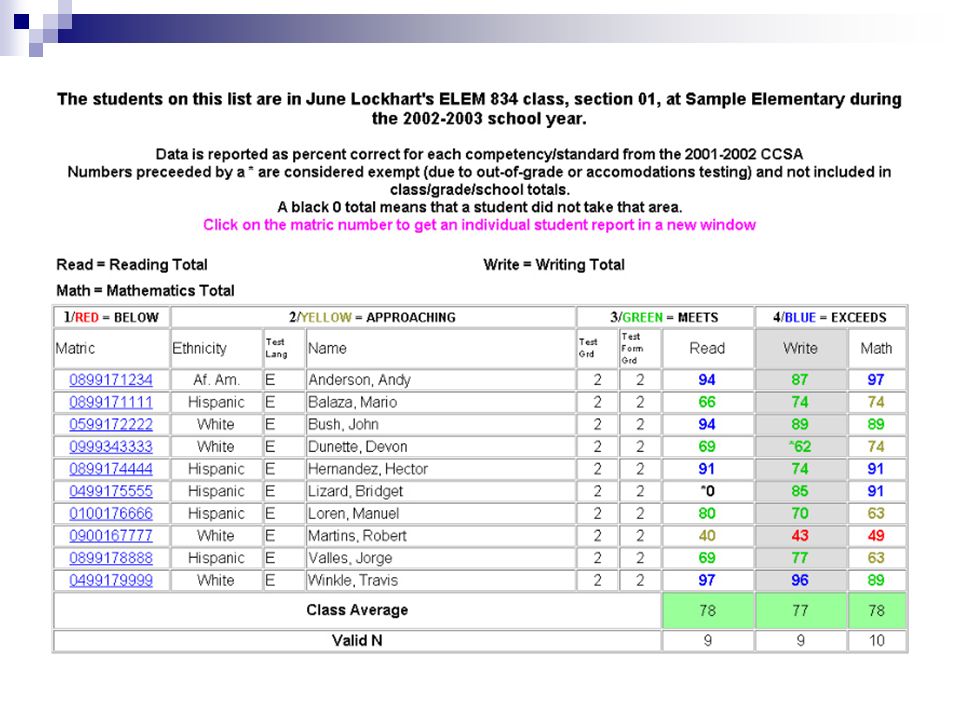
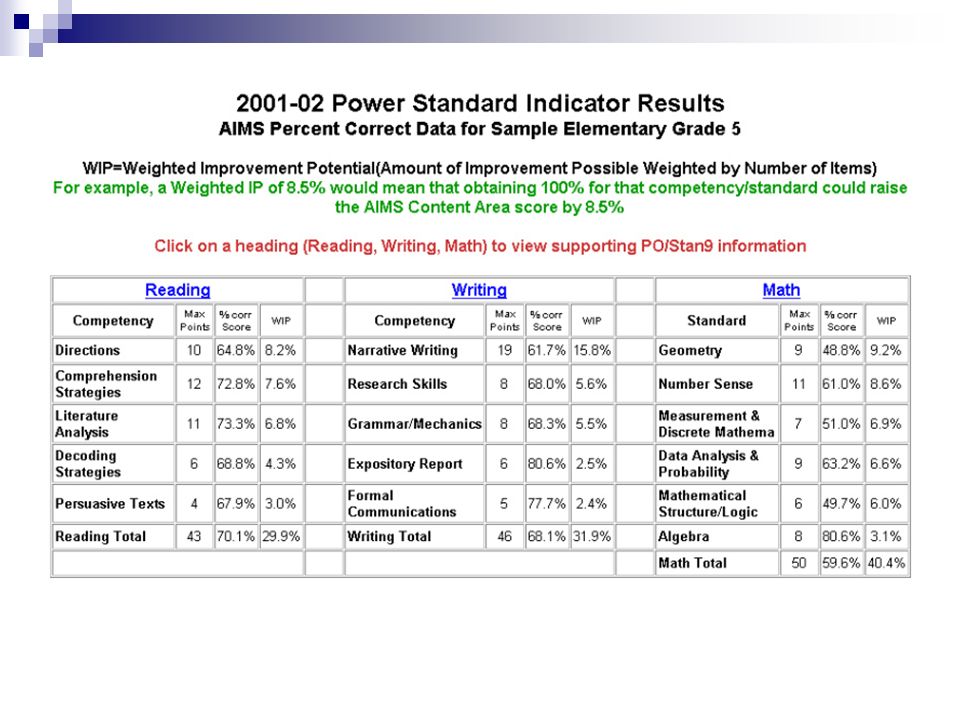
Part 3: Intranet Data Resources The Accountability and Research Department has student-level data online that can help you to plan strategies for increasing scores at your school. http://paweb.tusd.k12.az.us/ For example… Previous Year CCSA Scores by Student AIMS Power Standards

Similar presentations


 2012 Science Results Carolyn M. Wood, Ph.D. Assistant Superintendent, Accountability, Assessment, and Data Systems August.>")


![Enquiring mines wanna no.... Who is it? Coleman Report “[S]chools bring little influence to bear upon a child’s achievement that is independent of.](/15/4758624/big_thumb.jpg "Enquiring mines wanna no.... Who is it? Coleman Report “[S]chools bring little influence to bear upon a child’s achievement that is independent of.>")


