Download presentation
Presentation is loading. Please wait.

1
Taxonomy and Phylogeny The bacterial groups Pr A.Klier IMVI-Microbiologie M1 2009/2010

2
Carolus Linnaeus (1707-1778) Classifying Organisms
 Classifying Organisms")
3
Five Kingdoms Bacteria Archaea Prokaryotic Unicellular Eukaryotic Unicellular Uni or multicellular Eukaryotic

4
Classification phylogénétique Premier arbre univer- sel du vivant : –Subdivision en trois règnes : Plantes. Animaux. Protistes. –Organismes microsco- piques unicellulaires : Question qui se pose encore aujourd’hui. Haeckel (1866)
.")
5
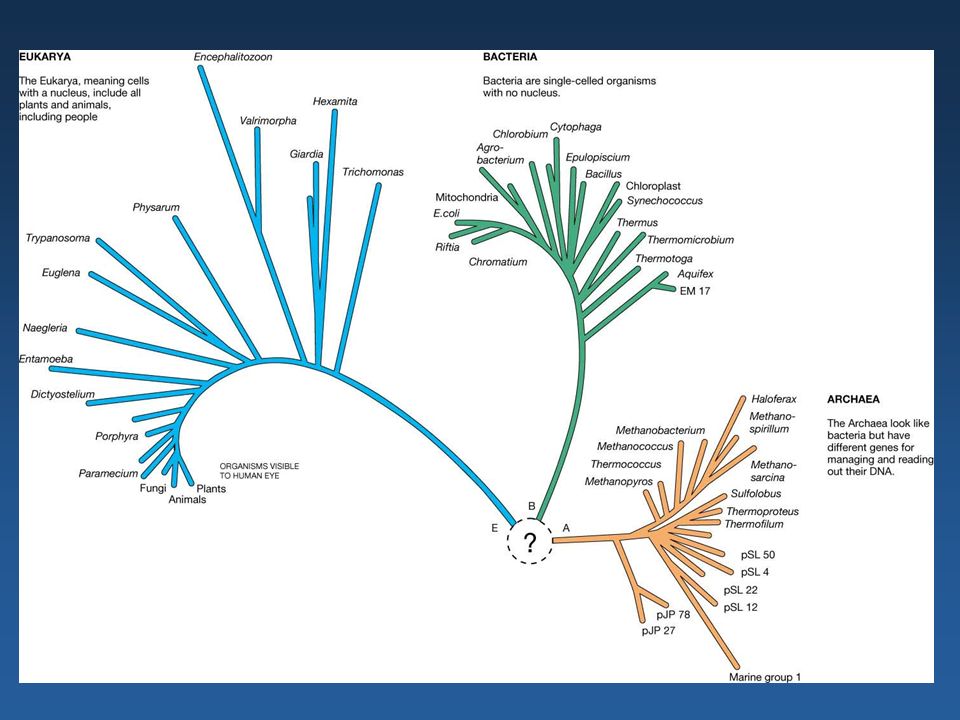
The Three-Domain System Figure 10.1

8
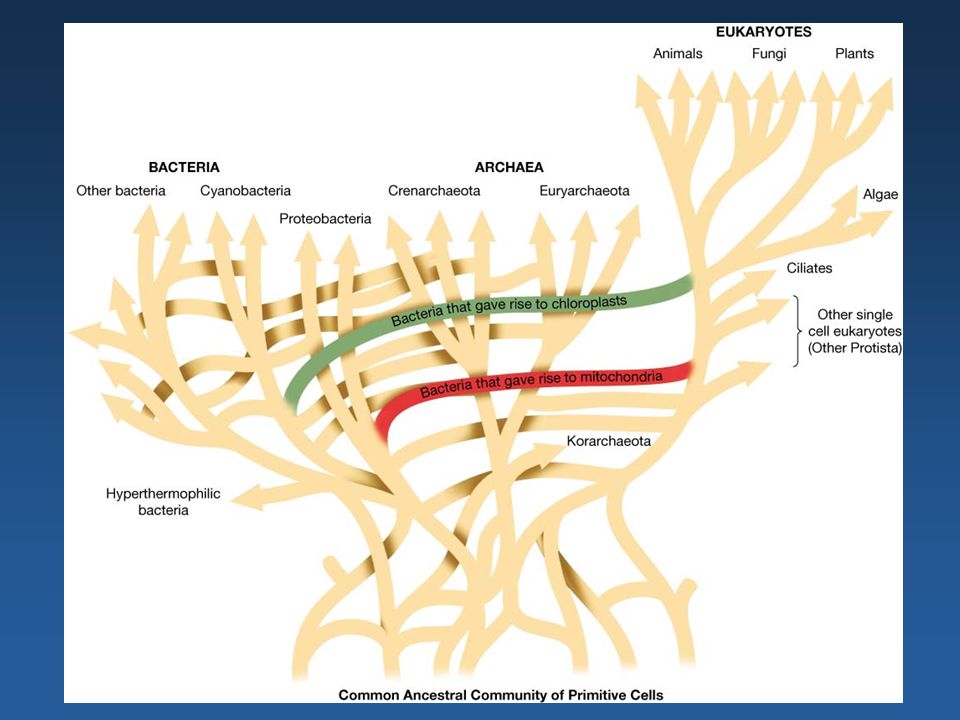
Evolution of cell types

9
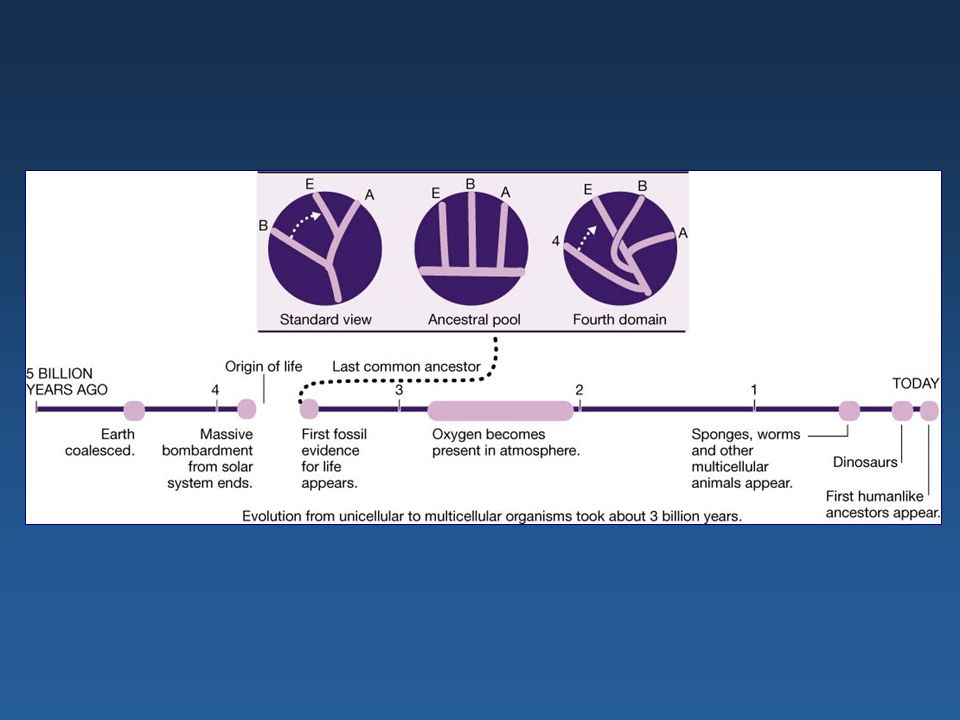
4,54,03,53,02,5 2,01,51,0 0,5 Milliards d’années Formation de la Terre 1 ers micro- organismes Dinosaures 0,0035 Humains Âge des microbes Arthropodes Histoire de la vie sur Terre Prokaryotes: 2.5 10 4 gen/an H.sapiens: 10 4 generations

11
The three-domain proposal based on the ribosomal RNA tree. Woese et al. PNAS. 87:4576-4579. (1990) The two-empire proposal, separating eukaryotes from prokaryotes and eubacteria from archaebacteria. Mayr, D. PNAS 95:9720-23. (1998). The three-domain proposal, with continuous lateral gene transfer among domains. Doolittle. Science 284:2124-8. (1999) The ring of life, incorporating lateral gene transfer but preserving the prokaryote eukaryote divide. Rivera & Lake JA. Nature 431: 152-5. (2004) Martin & Embley Nature 431:152-5.(2004)
 The two-empire proposal, separating eukaryotes from prokaryotes and eubacteria from archaebacteria. Mayr, D. PNAS 95: (1998). The three-domain proposal, with continuous lateral gene transfer among domains. Doolittle. Science 284: (1999) The ring of life, incorporating lateral gene transfer but preserving the prokaryote eukaryote divide. Rivera & Lake JA. Nature 431: (2004) Martin & Embley Nature 431:152-5.(2004).")
12
Summary First evidence for potential life 3.8 billion yrs ago other fossil evidence molecular fossils chemolithotrophy vs heterotrophs, who came first? anoxygenic photosynthesis oxygenic photosynthesis Banded iron formations (BIFs)-red beds
-red beds.")
13
Evolution of cell types

14
Endosymbiosis

15
Endosymbiotic Theory Figure 10.3 Figure 10.2

16
Prokaryotes Figure 10.6

17
Palaeomicrobiology

18
HOW DO WE CLASSIFY THE MICROBES ??? THE PRINCIPLES OF TAXONOMY

19
Importance of taxonomy allows scientists to organize huge amounts of knowledge allows scientists to make predictions and frame hypotheses about organisms places organisms into meaningful, useful groups, with precise names, thus facilitating scientific communication essential for accurate identification of organisms

20
Systematics study of organisms with the ultimate object of characterizing and arranging them in an orderly manner

21
Taxonomic Ranks microbiologists often use informal names –e.g., purple bacteria, spirochetes, methane- oxidizing bacteria

22
Taxonomic Hierarchy Figure 10.5

23
Defining a prokaryotic species- a difficult task can’t use definition based on interbreeding because procaryotes are asexual two definitions suggested: –collection of strains that share many stable properties and differ significantly from other groups of strains –= taxospecies –collection of strains with similar DNA G + C composition and 70% sequence similarity in their DNA –= genomic species

24
Type strain usually one of first strains of a species studied often most fully characterized not necessarily most representative member of species

25
Binomial system of nomenclature devised by Carl von Linné (Carolus Linnaeus) each organism has two names –genus name – italicized and capitalized (e.g., Escherichia) –species epithet – italicized but not capitalized (e.g., coli) can be abbreviated after first use (e.g., E. coli)
.")
26
Classification Natural classification –arranges organisms into groups whose members share many characteristics –most desirable system because reflects biological nature of organisms two methods for construction –phenetically grouped together based on overall similarity, and ignoring their past –phylogenetically grouped based on probable evolutionary relationships. Always thought impossible to achieve until recently

27
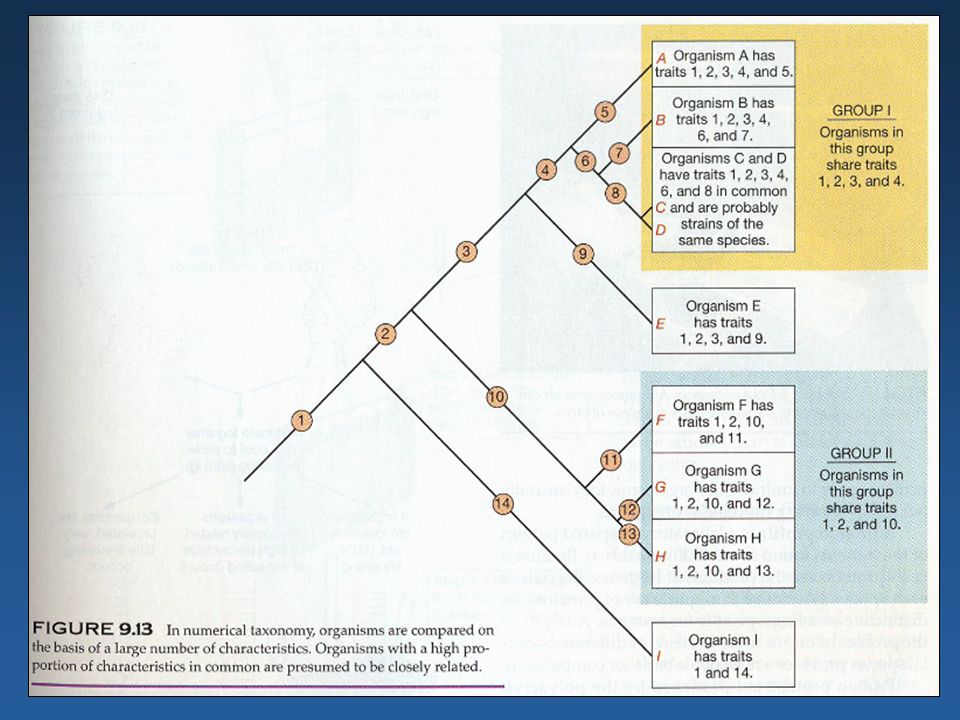
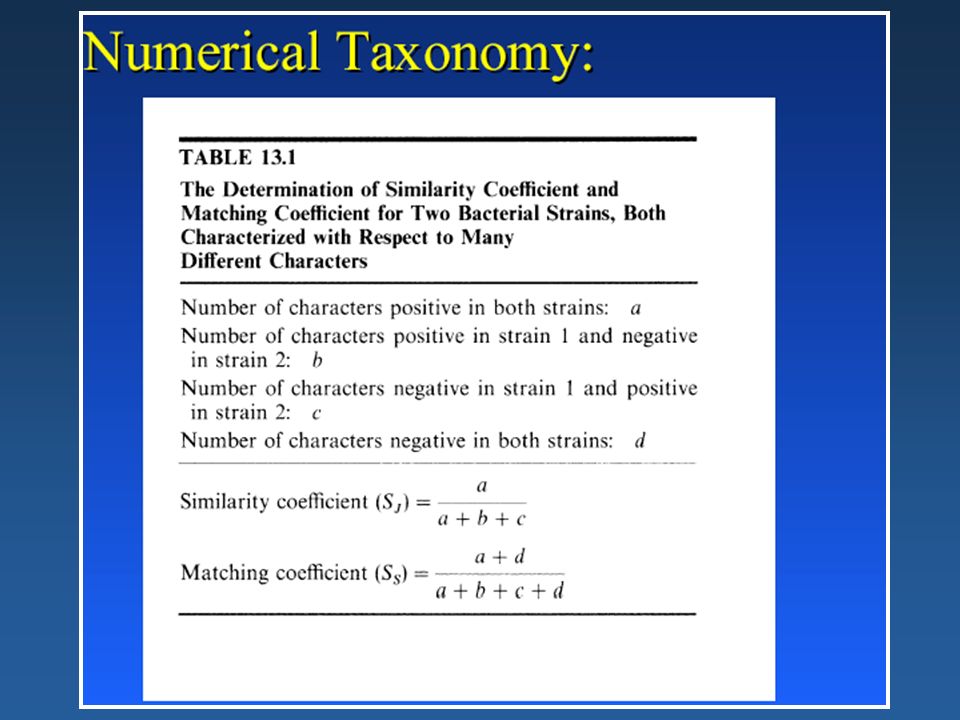
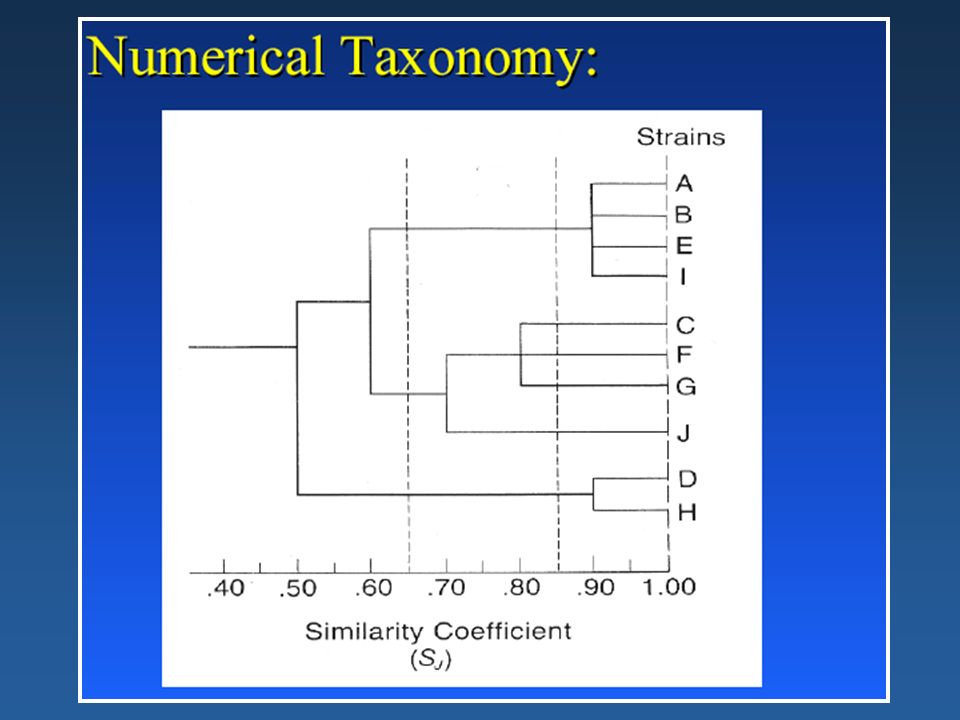
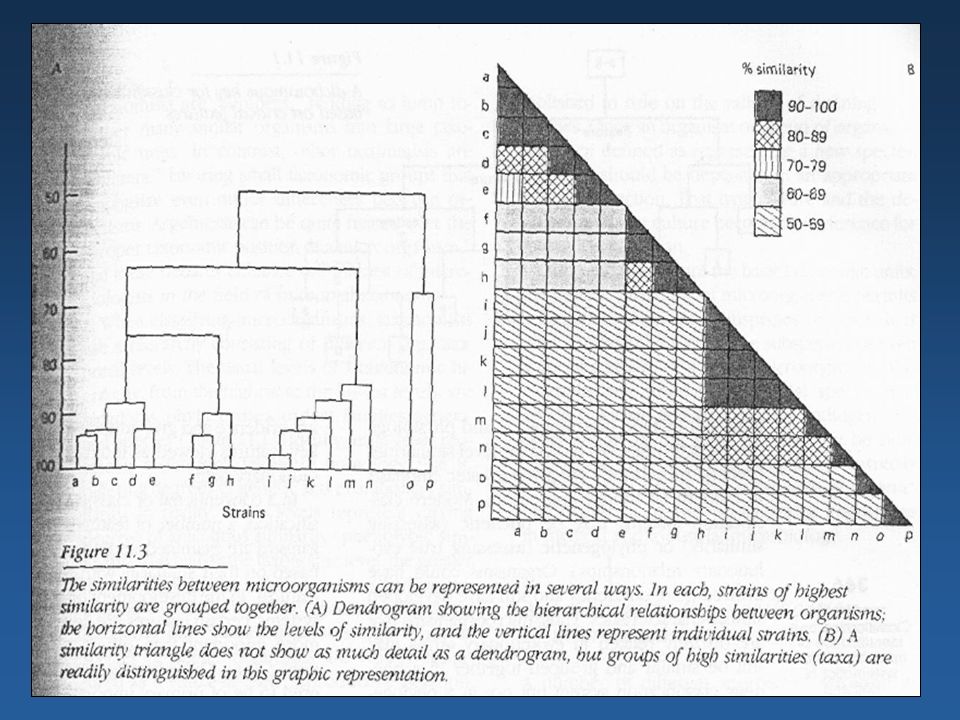
a) Phenetic Classification groups organisms together based on mutual similarity of present day phenotypes can reveal evolutionary relationships, but not dependent on phylogenetic analysis best systems compare as many attributes as possible, with no weighting general purpose classifications Known as POLYTHETIC classifications
 Phenetic Classification groups organisms together based on mutual similarity of present day phenotypes can reveal evolutionary relationships, but not dependent on phylogenetic analysis best systems compare as many attributes as possible, with no weighting general purpose classifications Known as POLYTHETIC classifications")
28
b) Phylogenetic Classification also called phyletic classification systems phylogeny –evolutionary development of a species usually based on direct comparison of genetic material and/or gene products Once thought impossible to achieve for prokaryotes – no fossils Now achieved – a revolution in microbiology
 Phylogenetic Classification also called phyletic classification systems phylogeny –evolutionary development of a species usually based on direct comparison of genetic material and/or gene products Once thought impossible to achieve for prokaryotes – no fossils Now achieved – a revolution in microbiology")
29
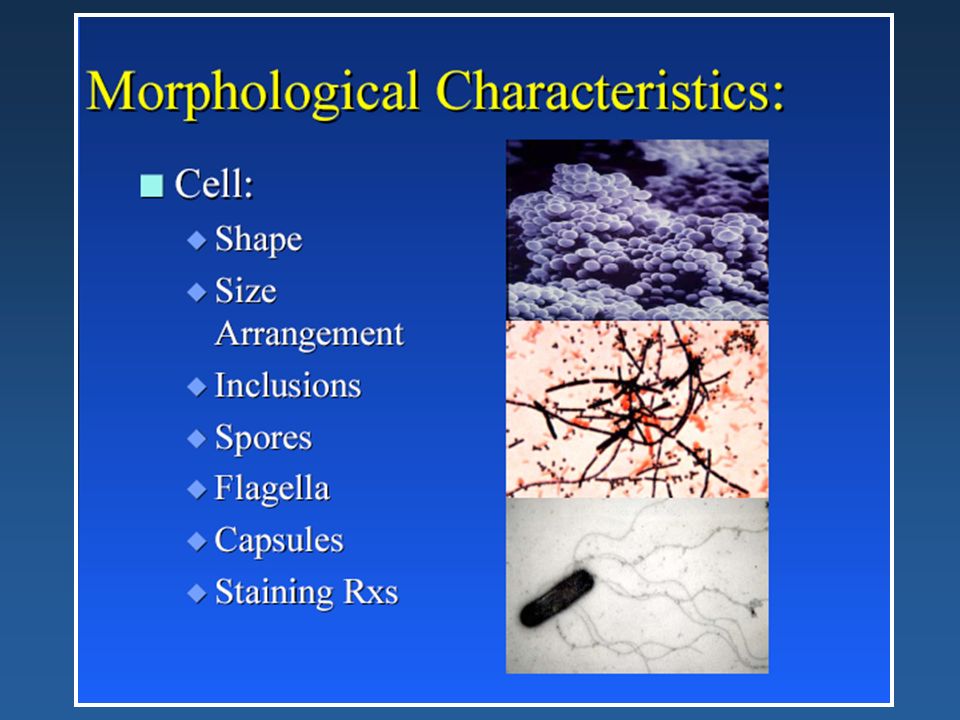
Major Characteristics Used in Taxonomy Needed for classifying and identifying microbes Morphology not as useful with bacteria as it is with higher plants and animals, since little variation Two major types: –Classical/conventional characteristics –Molecular characteristics

30
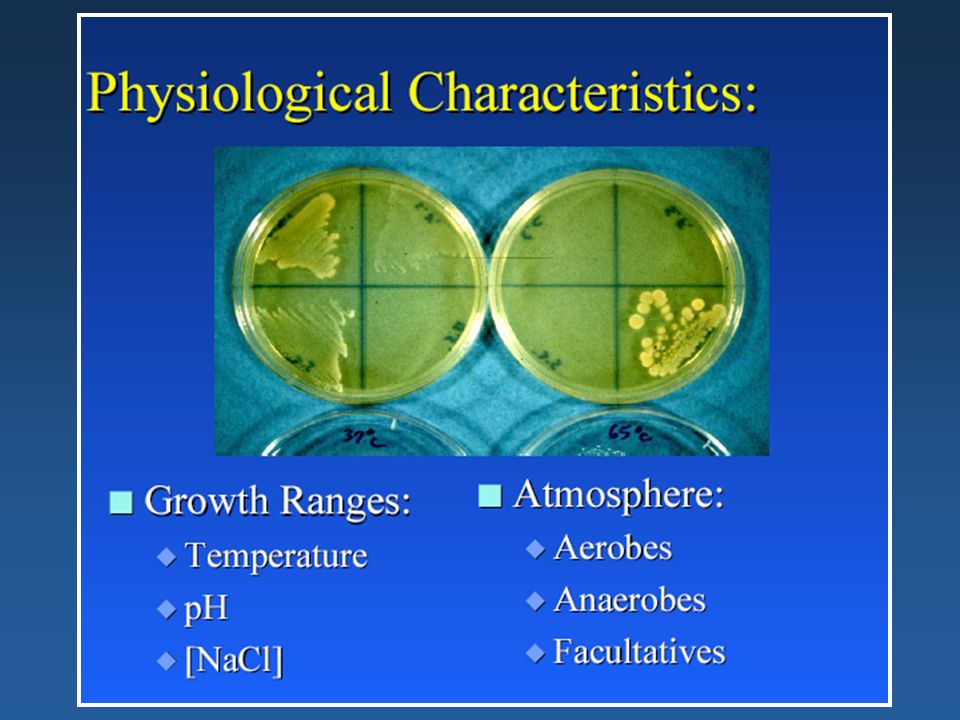
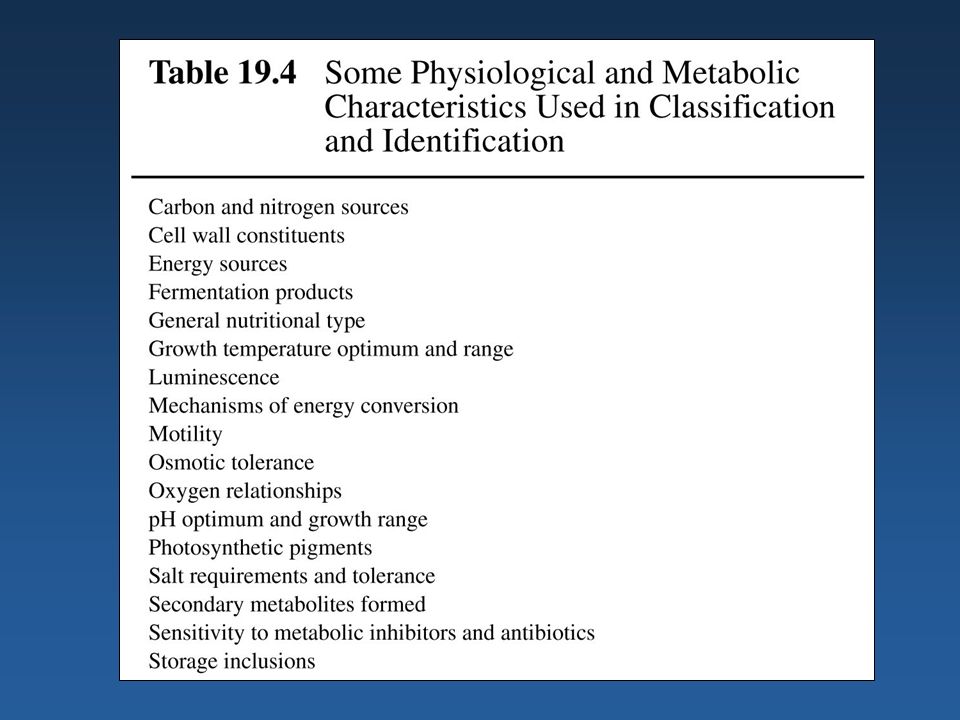
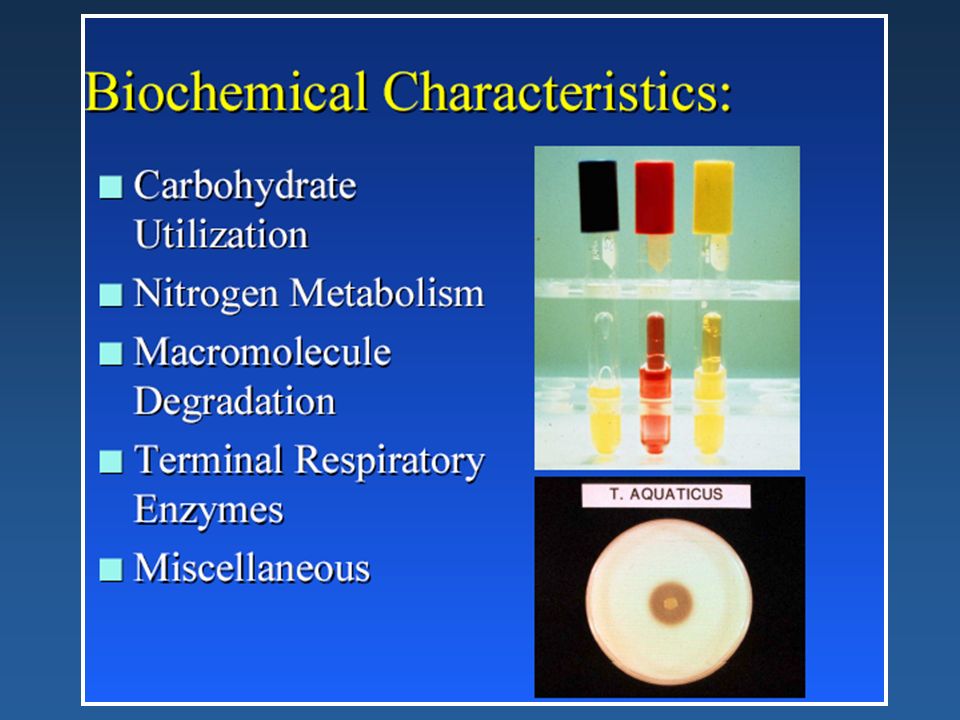
Classical Characteristics Morphological – cell shape etc =limited value physiological and metabolic = biochemical attributes ecological = genetic analysis = their ability to carry out DNA recombination with other strains

45
Ecological characteristics life-cycle patterns symbiotic relationships ability to cause disease habitat preferences growth requirements

46
Also use comparisons of selected chemical components of cells = CHEMOTAXONOMY Cell wall chemistry, including peptidoglycan chemistry and teichoic acids, and mycolic acids Lipids like ubiquinones and menaquinones Chemical fingerprinting of cells

47
Molecular Characteristics more useful and reliable comparison of proteins nucleic acid base composition nucleic acid hybridization nucleic acid sequencing

48
Nucleic acid base composition G + C content –Mol% G + C = (G + C/G + C + A + T)100 –usually determined from melting temperature (T m ) –An exclusionary character i.e. the same G+C value does not mean the two organisms are necessarily closely related, but if they differ by more than 5% then they belong to different species –An essential piece of information in any description of a new genus

49
Range of G+C contents

50
as temperature slowly increases, hydrogen bonds break, and strands begin to separate DNA is single stranded

51
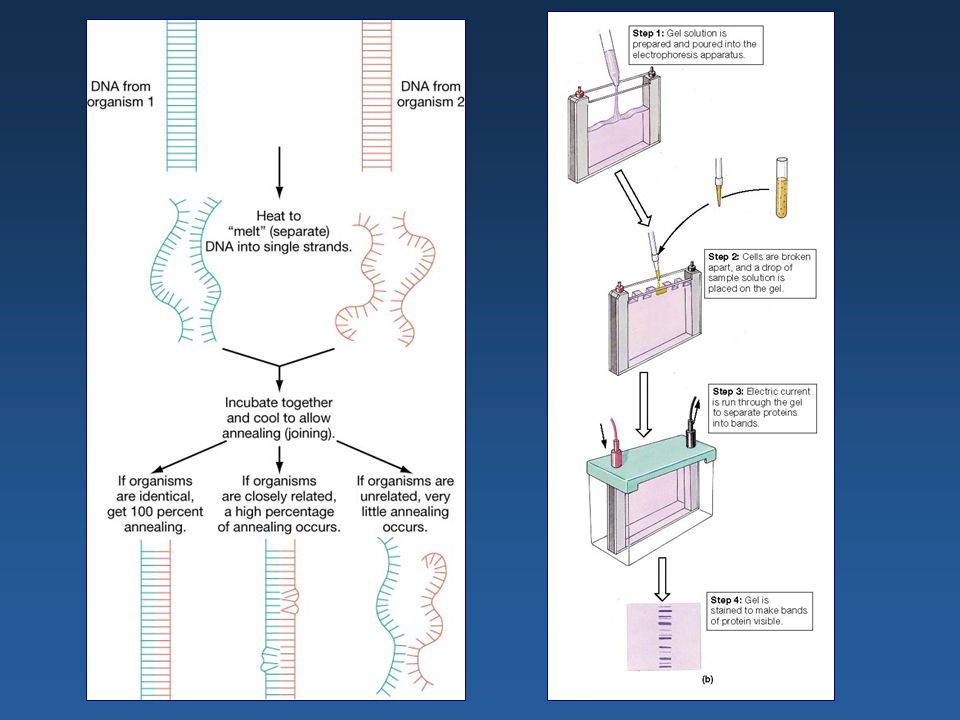
Nucleic acid hybridization measure of sequence homology common procedure- all are difficult –bind nonradioactive DNA to nitrocellulose filter –incubate filter with radioactive single-stranded DNA –measure amount of radioactive DNA attached to filter

52
Level of DNA:DNA Hybridization used as benchmark to define a genomic species of a bacterium ie strains with >70% DNA:DNA hybridization belong to same genomic species but is not used to separate genera

53
Assessing Microbial Phylogeny identify molecular chronometers or other characteristics to use in comparisons of organisms illustrate evolutionary relationships in phylogenetic tree

54
Carl Woese - a chemist working in relative isolation compares 16S rRNA sequences and discovers that: 1) “Archaebacteria” represent a new kingdom 2) A universal and quantitative phylogeny is possible -The “Woesian” Revolution -1977-
 Archaebacteria represent a new kingdom 2) A universal and quantitative phylogeny is possible -The Woesian Revolution")
55
Molecular Chronometers nucleic acids or proteins used as “clocks” to measure amount of evolutionary change over time

56
Which is the best molecule to use as a “molecular clock” for phylogenetic characterization ???? Most people think at the moment that 16S rRNA is

57
Conservation and variation in small subunit rRNA This diagram shows conserved and variable regions of the small subunit rRNA (16S in prokaryotes or 18S in eukaryotes). Each dot and triangle represents a position that holds a nucleotide in 95% of all organisms sequenced, though the actual nucleotide present (A, U, C, or G) varies among species. Figure by Jamie Cannone, courtesy of Robin Gutell; data from the Comparative RNA Web Site: www.rna.icmb.utexas.edu
 varies among species. Figure by Jamie Cannone, courtesy of Robin Gutell; data from the Comparative RNA Web Site:")
58
Conservation and variation in small subunit rRNA The starred region from part A as it appears in a bacterium (Escherichia coli), an archaean (Methanococcus vannielii), and a eukaryote (Saccharomyces cerevisiae). This region includes important signature sequences for the Bacteria and Archaea. Figure by Jamie Cannone, courtesy of Robin Gutell; data from the Comparative RNA Web Site: www.rna.icmb.utexas.edu

59
rRNA frequently used to create trees showing broad relationships

61
WHY?????????? Found in all Prokaryotes Large information content (1500bp) The genes encoding it show both conserved and highly variable regions This allows phylogenies covering a broad range of relationships from species to Domain level to be elucidated A large data base of sequences is available (>25,000) Gene (ie 16S rDNA) easily sequenced Probably not as susceptible to lateral gene transfer as some other genes
 The genes encoding it show both conserved and highly variable regions This allows phylogenies covering a broad range of relationships from species to Domain level to be elucidated A large data base of sequences is available (>25,000) Gene (ie 16S rDNA) easily sequenced Probably not as susceptible to lateral gene transfer as some other genes.")
62
But not perfect!!!!!! Direct correlation of the changes in the sequence of this molecule to a time scale is not possible A cell may contain more than one copy of the 16S rDNA gene, each with a different sequence Difficult to interpret the taxonomic significance of high similarities (>98%) of 16S rDNA sequences between two organisms in terms of whether they are the same or different species, since only a single gene and not whole genome compared
 of 16S rDNA sequences between two organisms in terms of whether they are the same or different species, since only a single gene and not whole genome compared.")
63
rRNA, DNA, and Proteins as Indicators of Phylogeny all are used do not always produce the same phylogenetic trees

64
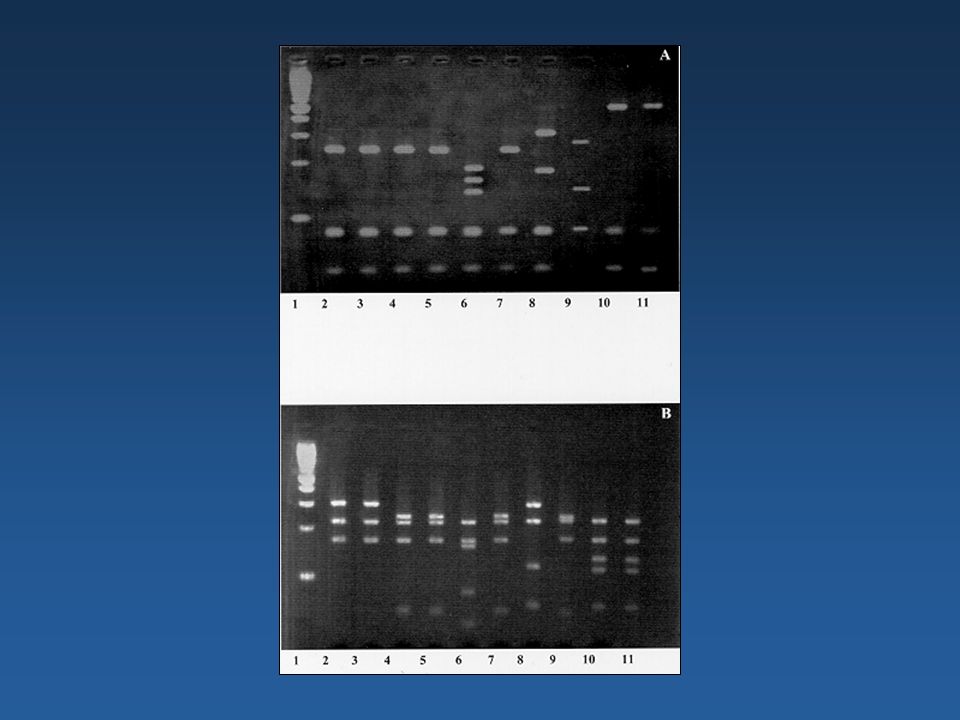
Genomic Fingerprinting An indirect way of comparing the DNA sequences of different bacteria All use PCR to copy genomic DNA which is then fingerprinted in some way Various methods Ribotyping RAPD-PCR 16S-23S spacer region fingerprinting and other amplified DNA restriction endonuclease digest analysis (ADRDA) methods MLST VNTR
 methods MLST VNTR")
66
Direct Nucleic acid sequencing usually comparison of rRNA genes ie 16S rRNA genes DNA much easier to sequence than RNA increasingly, comparison of entire bacterial genomes now being used

67
16S rRNA as evolutionary chronometer

68
Creating phylogenetic trees from molecular data align sequences (software like Clustal W) and data bases like GenBank, EMBL or RDP determine number of positions that are different express difference –e.g., evolutionary distance use measure of difference to create tree (PHYLIP) –organisms clustered based on relatedness –several methods for constructing trees, and most people use >1 –no agreement on best method for doing this –maximum liklihood is probably best but very slow
 and data bases like GenBank, EMBL or RDP determine number of positions that are different express difference –e.g., evolutionary distance use measure of difference to create tree (PHYLIP) –organisms clustered based on relatedness –several methods for constructing trees, and most people use >1 –no agreement on best method for doing this –maximum liklihood is probably best but very slow")
69
Polyphasic Taxonomy use of all possible data to determine phylogeny –i.e., genotypic and phenotypic information data used depends on desired level of resolution –e.g., serological data – resolve strains –e.g., protein electrophoretic patterns – resolve species –e.g., DNA hybridization and % G + C – resolve at genus and species level

70
The Major Divisions of Life based primarily on rRNA analysis currently held that there are three domains of life –Bacteria –Archaea –Eucarya

71
Some interesting findings minimal genome size –based on analysis of Mycoplasma genitalium genome smallest procaryotic genome sequenced ~108-121 genes not required for growth in laboratory ~265-350 genes required for growth in laboratory

72
More findings… many identified genes have unknown function –e.g., Mycoplasma genitalium 22% have unknown function –e.g., Haemophilus influenzae > 40% have unknown function –e.g., Methanococcus jannaschii a member of Archaea 66% have unknown function –e.g., E. coli ~2500 of 4288 genes have unknown function

73
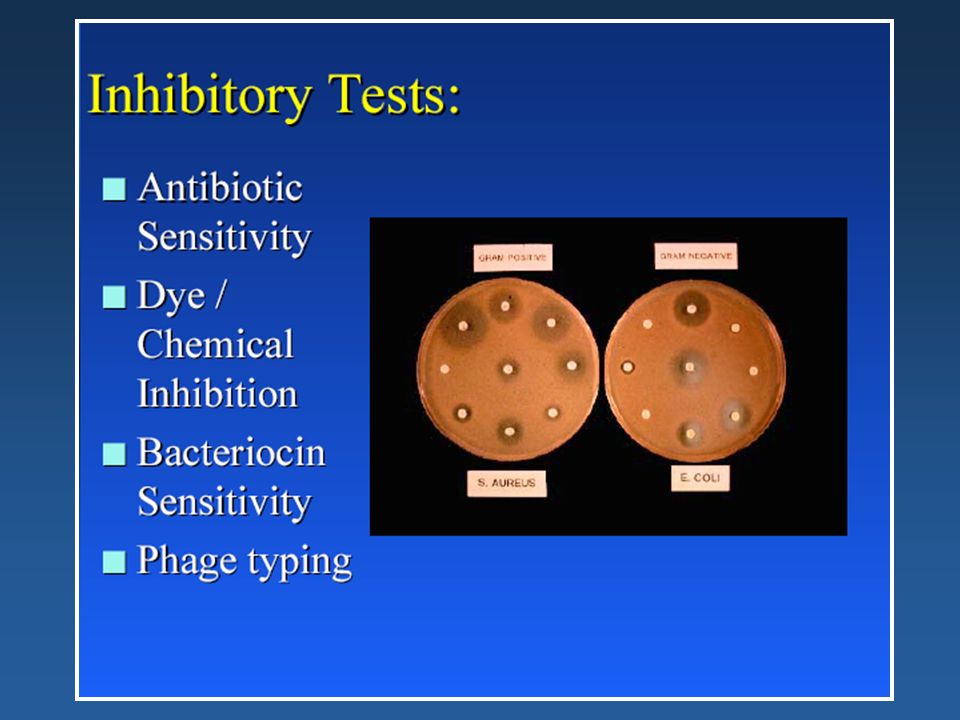
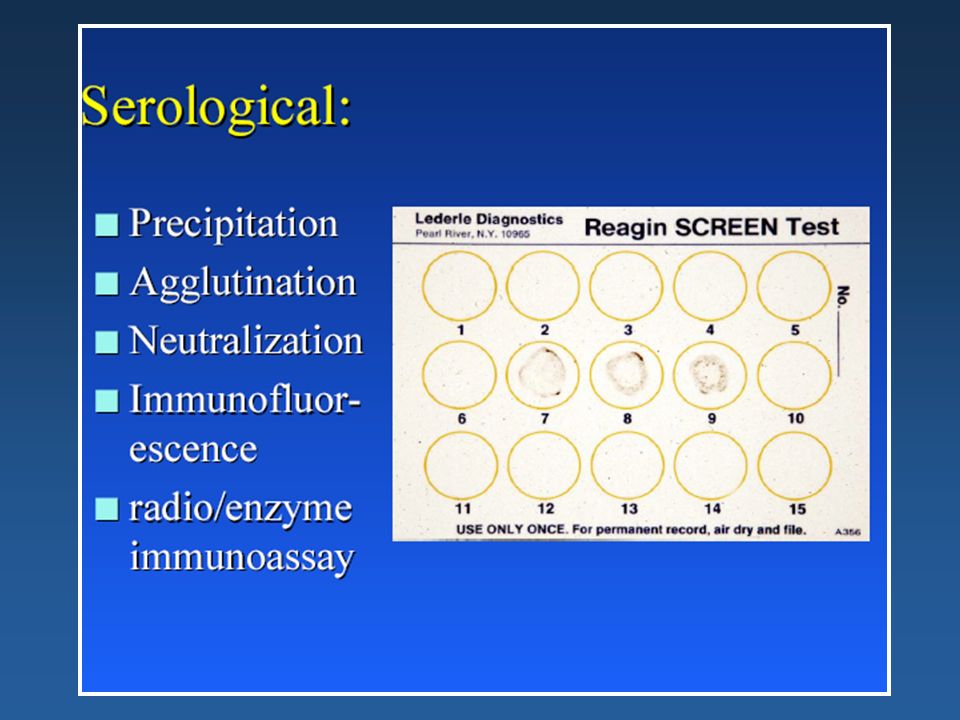
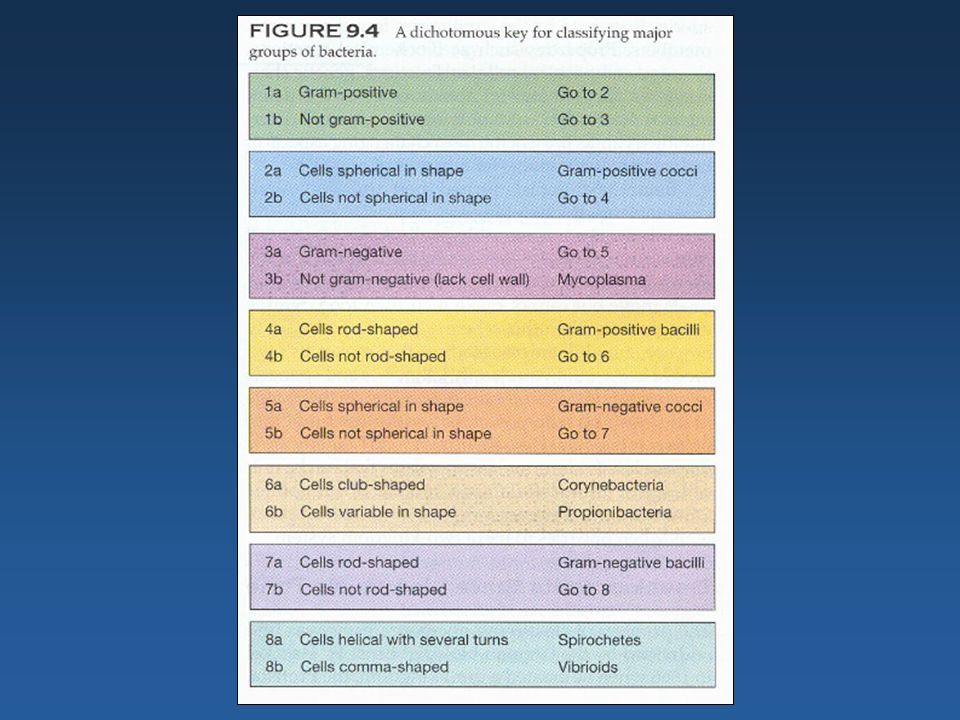
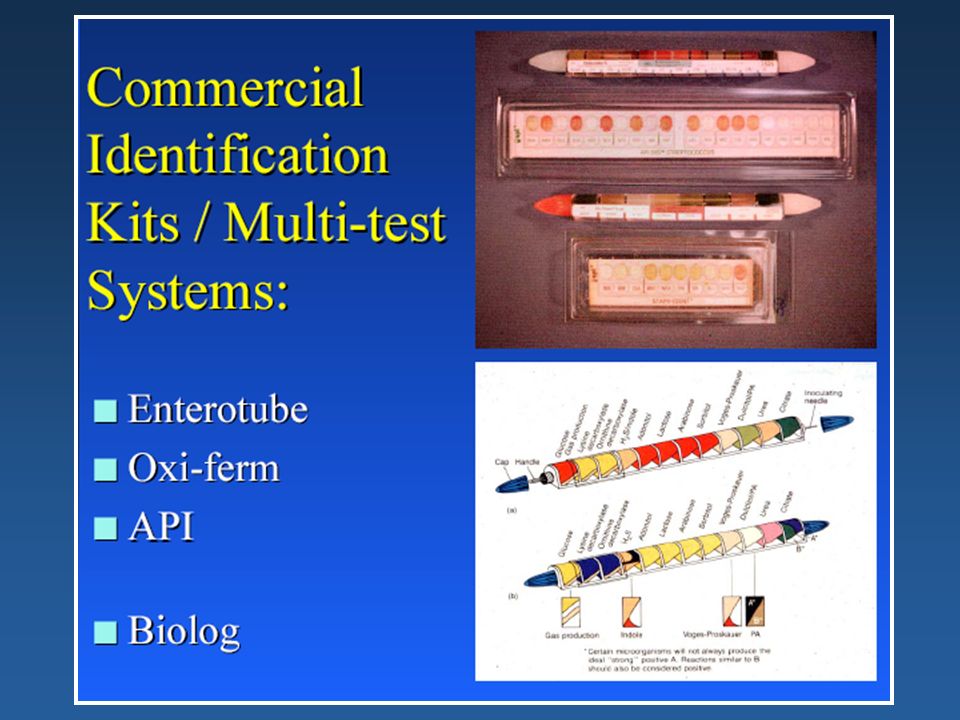
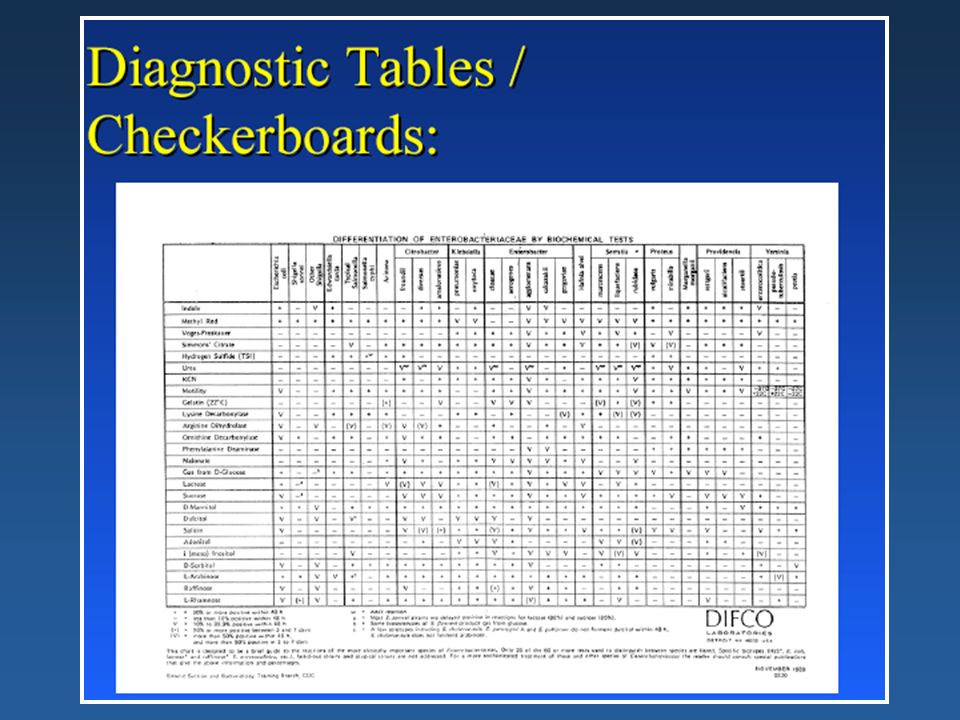
Approaches to Identification Blunderbuss approach-use as many tests as possible. Slow and expensive Dichotomous keys, but one wrong answer gives wrong identification Simultaneous approach using computer based systems eg Biolog, but only as good as the data base Serological methods using O or other antigens Molecular techniques like genomic fingerprinting and USING DNA or RNA targeted probes

74
1923 - Bacterial Taxonomy: Bergey's Manual of Determinative Bacteriology “Species” description Historical Perspective of Bacterial Phylogenetic Analyses: Pre-1977

75
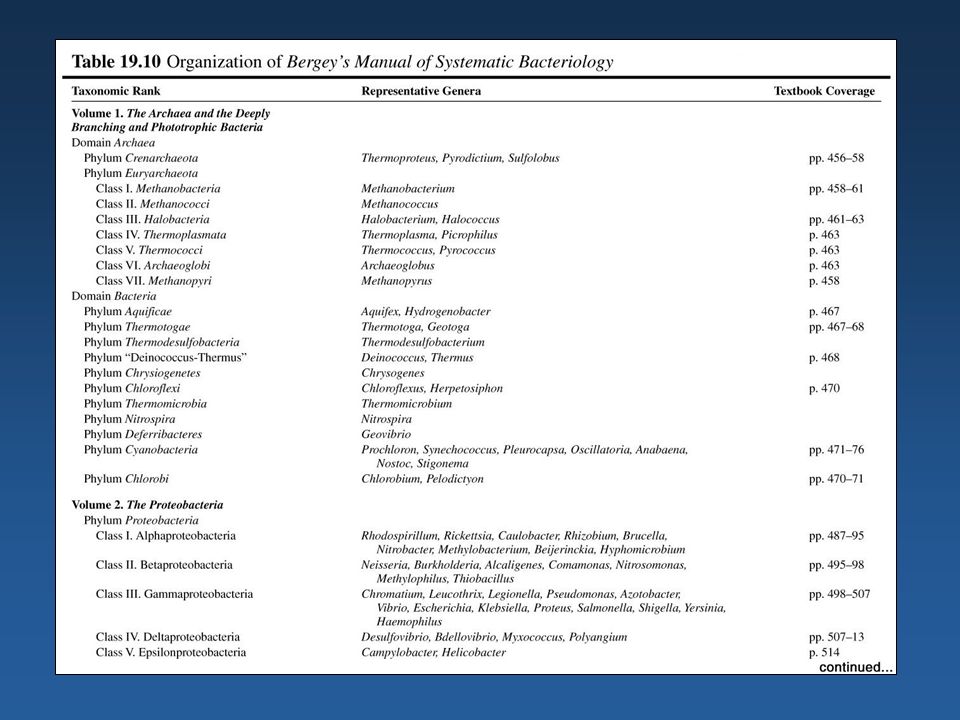
Bergey’s Manual of Systematic Bacteriology Prokaryotes into 25 phyla –Archaea 2 –Bacteria 23 Consensus of experts

76
Bergey’s Manual of Systematic Bacteriology The bible for bacterial taxonomists Edited by an international committee of bacterial taxonomists Detailed work containing descriptions of all prokaryotic species currently identified

77
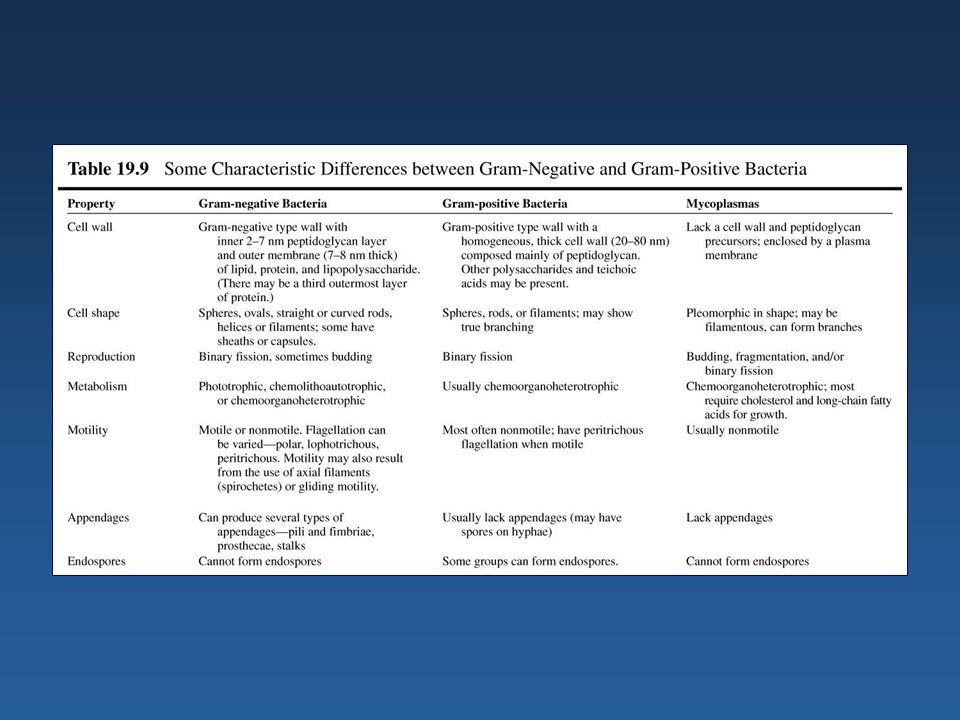
The First Edition of Bergey’s Manual of Systematic Bacteriology primarily phenetic cell wall characteristics played important role as characters to group and separate bacteria Gram-negative versus Gram-positive bacteria versus bacteria with no cell walls (Mycoplasmas)
")
Similar presentations


2605285.>")


>")