Download presentation
Presentation is loading. Please wait.

3
average mean median mode sample size

4
Read the introduction and look for key ideas

5
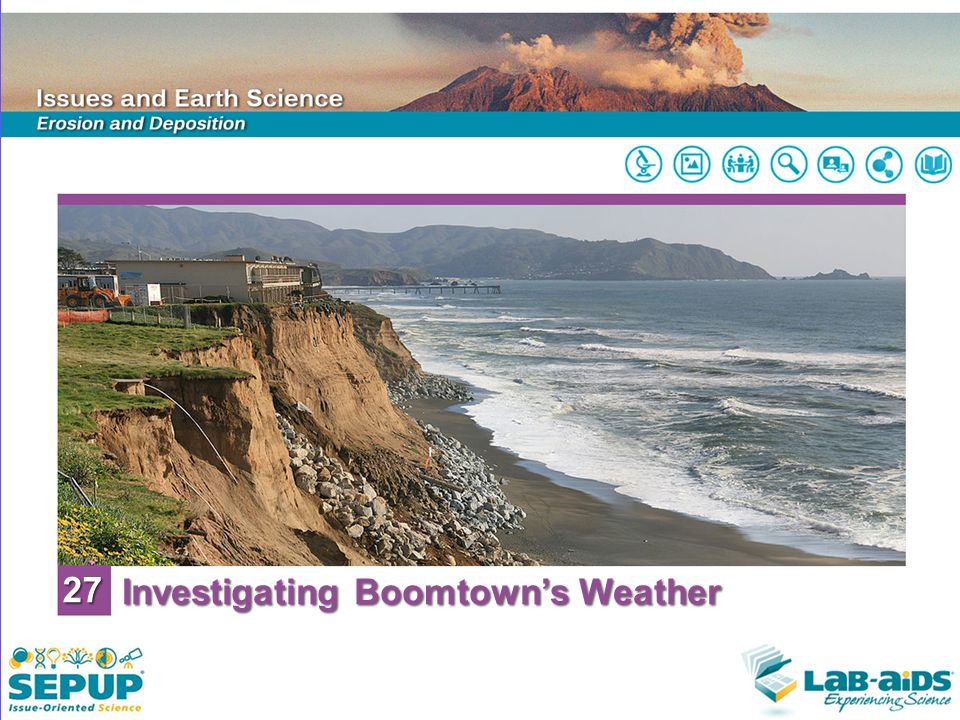
Is Boomtown’s rainfall likely to cause flooding?

6
What effects do you think of a lot of water, such as increased speed of the river, flooded streets, or saturated earth, would have on Boomtown? Record your answer in your notebook.

7
Averages Below are the results for a student who is training for the long jump. What is the average distance that Student A jumped in the five practice jumps?

8
What is the mean, median, and mode for Student B?

9
Who will win? Tomorrow Student A and Student B will compete in a track meet. They will each make three jumps. Whoever has the longest jump will win. Who do you think is most likely to win? Explain your answer. Record your answer in your notebook.

10
Additional data In the meet, Student A jumped 3.5, 3.6, and 3.9m. Student B jumped 3.8, 4.3, and 4.1m. What does this do to each student’s statistics?

11
Complete the procedure and record your data

12
SCORING GUIDE: Organizing Data

13
Class discussion of results

14
Analysis question 1 Look at the graphs of annual and monthly rainfall in Boomtown. Describe any patterns that you see in the rainfall.

15
Analysis question 2 a. Is there anything unusual about Boomtown’s annual rainfall? Explain. b. Is there anything unusual about Boomtown’s monthly rainfall? Explain.

16
Analysis question 3 During the same year, a town in California and a city in Maryland both received about 99 cm (39 inches) of rain. In August, the town in California had less than one centimeter of rain while the city in Maryland had 7 cm (3 inches). Explain how these two places could have the same annual rainfall.
 of rain. In August, the town in California had less than one centimeter of rain while the city in Maryland had 7 cm (3 inches). Explain how these two places could have the same annual rainfall.")
17
Analysis question 4 Which location—Delta Marsh, Green Hill, or Seaside Cliff—would be most affected by a. a year of typical rainfall in Boomtown? Explain. b. another flood in Boomtown? Explain.

18
Analysis question 5 Reflection: How does Boomtown’s rainfall pattern compare to that of your community?

19
Evidence Add any information about Boomtown’s rainfall that provides evidence relevant to making the decision about where to build to the “Building Site Evidence Chart.”

20
Is Boomtown’s rainfall likely to cause flooding?

21
Key vocabulary definitions
Average - The central, or typical, value of a numerical data set. See mean median, and mode. Mean - A central value of a numerical data set calculated by adding up all the data points in the data set and dividing this sum by the total number of data points in the data set.

22
Key vocabulary definitions
Median - The middle value in a data set arranged in numerical order. Mode - The most frequently occurring data point of a numerical data set. Sample size - The number of data points in a data set.

23
Graph Use the data in Table 3 to make a bar graph of Boomtown’s monthly rainfall in 2001, in centimeters. Compare it to the graphs you made in this activity.

24
Graph a. How was the annual rainfall in 2001 both similar to and different from Boomtown’s annual rainfall from 2002 through 2011?

25
Graph b. How was the monthly rainfall pattern in 2001 both similar to and different from Boomtown’s average monthly rainfall from 2002 through 2011?

Similar presentations