Download presentation
Presentation is loading. Please wait.

1
Financial Planning and Forecasting What is a forecast? – A forecast is a prediction about a situation at some future point in time. – Financing related business decisions are heavily dependent on forecasting. Why do firms forecast? – Firms spend consid. fortune plan for uncertain future

2
Financial Planning and Forecasting The need to plan – Successful business managers know the importance of planning – Efficient planning assists managers in controlling their firm Financial Forecasting – Process of projecting future financial requirement of firm – Financial forecasting – an integral part of financial manager’s job – In the process of financial forecasting Fin. Manager develops projected financial statements.

3
Steps in Financial Forecasting Sales Forecast – The key ingredient of firm’s planning process is sales forecast. Project the assets needed to support the sales – Projecting change in CA & FA along with change in level of sales Project internally generated funds Project outside funds needed Decide how to raise funds

4
Sales Forecast Sales forecasts are usually based on the analysis of historic data. An accurate sales forecast is critical to the firm’s profitability: Under-optimistic Too much inventory and/or fixed assets Low turnover ratio High cost of depreciation and storage Write-offs of obsolete inventory Low profit Low rate of return on equity Low free cash flow Depressed stock price Over-optimistic Company will fail to meet demand Market share will be lost Sales Forecast

5
Forecasting the Income Statement

6
Forecast Sales Prior yr. sales x growth rate 3000 x 1.10 3300 million COGS 2008 sales x COGS 2007 /Sales 2007 3300 x 2616/3000 2877. 6 million Depreciation Expense 2008 net P&E x Dep 2007 /Net P&E 2007 1100 x 100/1000 110 million 123 Actual 2007Forecast BasisForecast for 2008 Sales3000 2007 sales x 1.10 3300 Cost except depreciation2616.2 2008 sales x COGS/Sales 2877 Depreciation expense100 2008 Net P&E x Dep./NetP&E 110 Total operating cost$2,716.20$2,987.60 EBIT$283.80$312.40 Less interest88 See explanation 92.8 EBT$195.80$219.60 Taxes (40%)78.387.8 NI before preferred dividends$117.50$131.80 Preferred dividends 4 Pref. divd.= Pref. stock at beg. of year x divid. % 4 NI available to common$113.50$127.80 Shares of common equity50 Dividends per share$1.15$1.25 Dividends to common$57.50$62.50 Additions to retained earnings$56.00$65.30
 NI before preferred dividends$117.50$ Preferred dividends 4 Pref. divd.= Pref. stock at beg. of year x divid. % 4 NI available to common$113.50$ Shares of common equity50 Dividends per share$1.15$1.25 Dividends to common$57.50$62.50 Additions to retained earnings$56.00$")
7
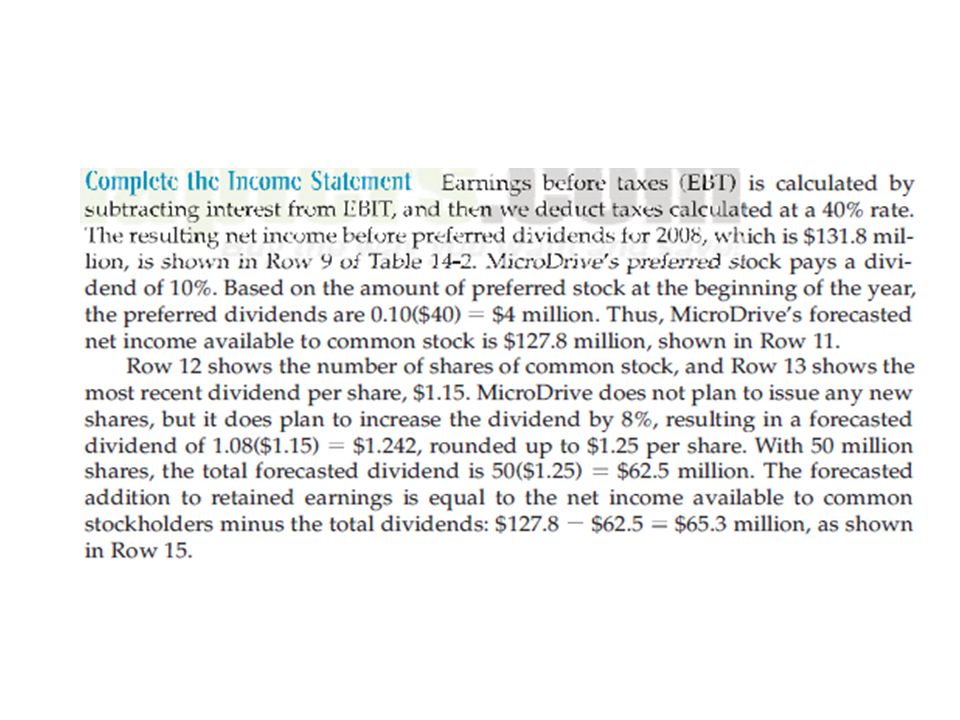
Forecasting the Income Statement Other Operating Expenses Salaries of executives, marketing cost – co’s size – tied to sales EBIT – Subtract COGS, depreciation, op. expenses from sales to give EBIT. Interest Expense The interest expense on N/P is projected as interest rate on N/P multiplied by avg. value of N/P outstanding during the year. Preferred Stock 2008 Pref. stock at beg. of yr. x dividend % $40 x 0.10 Total Preferred dividend = $4 m 123 Actual 2007Forecast BasisForecast for 2008 Sales3000 2007 sales x 1.10 3300 Cost except depreciation2616.2 2008 sales x COGS/Sales 2877 Depreciation expense100 2008 Net P&E x Dep./NetP&E 110 Total operating cost$2,716.20$2,987.60 EBIT$283.80$312.40 Less interest88 See explanation 92.8 EBT$195.80$219.60 Taxes (40%)78.387.8 NI before preferred dividends$117.50$131.80 Preferred dividends 4 Pref. divd.= Pref. stock at beg. of year x divid. % 4 NI available to common$113.50$127.80 Shares of common equity50 Dividends per share$1.15$1.25 Dividends to common$57.50$62.50 Additions to retained earnings$56.00$65.30
 NI before preferred dividends$117.50$ Preferred dividends 4 Pref. divd.= Pref. stock at beg. of year x divid. % 4 NI available to common$113.50$ Shares of common equity50 Dividends per share$1.15$1.25 Dividends to common$57.50$62.50 Additions to retained earnings$56.00$")
8
Forecasting the Income Statement Dividend Forecasted DPS: Current DPS x Increase 1.15 x 1.08 = 1.25 Forecasted Dividend = 1.25 x 50 = 62.5 m Forecasted addition to retained earnings Forecasted N.I. available to common – Forecasted total dividends = Forecasted addition to R.E. 127.8 – 62.5 = $65.3 m 123 Actual 2007Forecast BasisForecast for 2008 Sales3000 2007 sales x 1.10 3300 Cost except depreciation2616.2 2008 sales x COGS/Sales 2877 Depreciation expense100 2008 Net P&E x Dep./NetP&E 110 Total operating cost$2,716.20$2,987.60 EBIT$283.80$312.40 Less interest88 See explanation 92.8 EBT$195.80$219.60 Taxes (40%)78.387.8 NI before preferred dividends$117.50$131.80 Preferred dividends 4 Pref. divd.= Pref. stock at beg. of year x divid. % 4 NI available to common$113.50$127.80 Shares of common equity50 Dividends per share$1.15$1.25 Dividends to common$57.50$62.50 Additions to retained earnings$56.00$65.30
 NI before preferred dividends$117.50$ Preferred dividends 4 Pref. divd.= Pref. stock at beg. of year x divid. % 4 NI available to common$113.50$ Shares of common equity50 Dividends per share$1.15$1.25 Dividends to common$57.50$62.50 Additions to retained earnings$56.00$")
10
Forecasting the Balance Sheet 123 Actual 2007 Forecast Basis Forecast for 2008 Assets Cash $10 2008 sales x Cash/Sales $11 Short term investments 00 Accounts receivable 375 2008 sales x AR/Sales 412.5 Inventories 615 2008 sales x Inv./Sales 676.5 Total current assets $1,000$1,100 Net plant and equipment 1000 2008 sales x Net P&E/Sales 1100 Total assets $2,000$2,200 Liabilities and Equity Accounts payable $60 2008 sales x AP/Sales $66 Accruals 140 2008 sales x Accruals/Sales 154 Notes payable 110 110 + 114.7 224.7 Total current liabilities $310$444.7 Long term bonds 754 same: no new issue 754 Total liabilities $1,064$1,198.7 Preferred stock 40 same: no new issue 40 Common stock 130 same: no new issue 130 Retained earnings 766 2007 R.E. + 2008 Add. To R.E. 831.3 Total common equity $896$961.3 Total liabilities and equity $2,000$2,200 Required assets $2,200 Specified sources of financing 2085.3 AFN $114.70 Required add. Notes payable $114.70 Additional short-term invst. 0 Assets Cash 2008 sales x Cash 2007 /Sales 2007 3300 x 10/3000 11 million A/R 2008 sales x A/R. 2007 /Sales 2007 3300 x 375/3000 412.5 million Inventories 2008 sales x Inv. 2007 / Sales 2007 3300 x 615/3000 676.5 million

11
Forecasting the Balance Sheet 123 Actual 2007 Forecast Basis Forecast for 2008 Assets Cash $10 2008 sales x Cash/Sales $11 Short term investments 00 Accounts receivable 375 2008 sales x AR/Sales 412.5 Inventories 615 2008 sales x Inv./Sales 676.5 Total current assets $1,000$1,100 Net plant and equipment 1000 2008 sales x Net P&E/Sales 1100 Total assets $2,000$2,200 Liabilities and Equity Accounts payable $60 2008 sales x AP/Sales $66 Accruals 140 2008 sales x Accruals/Sales 154 Notes payable 110 110 + 114.7 224.7 Total current liabilities $310$444.7 Long term bonds 754 same: no new issue 754 Total liabilities $1,064$1,198.7 Preferred stock 40 same: no new issue 40 Common stock 130 same: no new issue 130 Retained earnings 766 2007 R.E. + 2008 Add. To R.E. 831.3 Total common equity $896$961.3 Total liabilities and equity $2,000$2,200 Required assets $2,200 Specified sources of financing 2085.3 AFN $114.70 Required add. Notes payable $114.70 Additional short-term invst. 0 Assets Fixed Assets 2008 sales x Net P&E 2007 /Sales 2007 3300 x 1000/3000 1,100 million

12
Forecasting the Balance Sheet 123 Actual 2007 Forecast Basis Forecast for 2008 Assets Cash $10 2008 sales x Cash/Sales $11 Short term investments 00 Accounts receivable 375 2008 sales x AR/Sales 412.5 Inventories 615 2008 sales x Inv./Sales 676.5 Total current assets $1,000$1,100 Net plant and equipment 1000 2008 sales x Net P&E/Sales 1100 Total assets $2,000$2,200 Liabilities and Equity Accounts payable $60 2008 sales x AP/Sales $66 Accruals 140 2008 sales x Accruals/Sales 154 Notes payable 110 110 + 114.7 224.7 Total current liabilities $310$444.7 Long term bonds 754 same: no new issue 754 Total liabilities $1,064$1,198.7 Preferred stock 40 same: no new issue 40 Common stock 130 same: no new issue 130 Retained earnings 766 2007 R.E. + 2008 Add. To R.E. 831.3 Total common equity $896$961.3 Total liabilities and equity $2,000$2,200 Required assets $2,200 Specified sources of financing 2085.3 AFN $114.70 Required add. Notes payable $114.70 Additional short-term invst. 0 Liabilities Current Liabilities Accounts Payable * 2008 sales x AP 2007 /Sales 2007 3300 x 60/3000 66 million Accrued wages * 2008 sales x Accruals. 2007 /Sales 2007 3300 x 140/3000 154 million Notes payable Current level of NP are maintained Company’s policy is to obtain any additional funds as notes payable * Spontaneously generated funds: With increase in Sales these increase simultaneously,

13
Spontaneously generated funds

14
Forecasting the Balance Sheet Equity Common stock – Most companies rarely issue new common stock so the forecast for CS is usually prev. year’s CS. Preferred stock – Most companies rarely issue PS and those that do further infrequently issue new stock. Retained Earnings 2008: Forecasted addition to R.E. = Forecasted N.I. – Forecasted Dividends = 127.8 – 62.5 = 65.3 million 2008: Forecasted level of R.E. = 2007 R.E. + Forecasted Add. to R.E. = 766 – 65.3 = 831.3 million 1234 Actual 2007 Forecast Basis Forecast for 2008 Assets Cash $10 2008 sales x Cash/Sales $11 Short term investments 000 Accounts receivable 375 2008 sales x AR/Sales 412.5 Inventories 615 2008 sales x Inv./Sales 676.5 Total current assets $1,000$1,100 Net plant and equipment 1000 2008 sales x Net P&E/Sales 1100 Total assets $2,000$2,200 Liabilities and Equity Accounts payable $60 2008 sales x AP/Sales $66 Accruals 140 2008 sales x Accruals/Sales 154 Notes payable 110 224.7 Total current liabilities $310$330.0$444.7 Long term bonds 754 same: no new issue 754 Total liabilities $1,064$1,084.0$1,198.7 Preferred stock 40 same: no new issue 40 Common stock 130 same: no new issue 130 Retained earnings 766 2007 R.E. + 2008 Add. To R.E. 831.3 Total common equity $896$961.3 Total liabilities and equity $2,000$2,085$2,200 Required assets $2,200 Specified sources of financing 2085.3 AFN $114.70 Required add. Notes payable $114.70 Additional short-term invst. 00

15
Forecasting the Balance Sheet 1234 Actual 2007 Forecast Basis Forecast for 2008 Assets Cash $10 2008 sales x Cash/Sales $11 Short term investments 000 Accounts receivable 375 2008 sales x AR/Sales 412.5 Inventories 615 2008 sales x Inv./Sales 676.5 Total current assets $1,000$1,100 Net plant and equipment 1000 2008 sales x Net P&E/Sales 1100 Total assets $2,000$2,200 Liabilities and Equity Accounts payable $60 2008 sales x AP/Sales $66 Accruals 140 2008 sales x Accruals/Sales 154 Notes payable 110 224.7 Total current liabilities $310$330.0$444.7 Long term bonds 754 same: no new issue 754 Total liabilities $1,064$1,084.0$1,198.7 Preferred stock 40 same: no new issue 40 Common stock 130 same: no new issue 130 Retained earnings 766 2007 R.E. + 2008 Add. To R.E. 831.3 Total common equity $896$961.3 Total liabilities and equity $2,000$2,085$2,200 Required assets $2,200 Specified sources of financing 2085.3 AFN $114.70 Required add. Notes payable $114.70 Additional short-term invst. 00 Additional Funds Needed (AFN) MD needs $2200 m of operating assets to support forecasted $3300 m of sales. Specified Sources of Financing (2008) A/P66 Accruals154 N/P (carryover)110 LTB (same, no new issue)754 PS (same, no new issue)40 CS (same, no new issue)130 RE (same, no new issue)831.3 Total$2,085.30 Required assets =Specified sources of financing $2,200.00 =$2,085.30 AFN = Required assets - SSOFAFN = 2200 - 2085.3 = $114.7 million MicroDrive needs 114.7 m of add. financing. Its intitial financing policy is to obtain these add. funds as notes payable bringing forecasted total to 110 + 114.7 = $224.7 million
 MD needs $2200 m of operating assets to support forecasted $3300 m of sales. Specified Sources of Financing (2008) A/P66 Accruals154 N/P (carryover)110 LTB (same, no new issue)754 PS (same, no new issue)40 CS (same, no new issue)130 RE (same, no new issue)831.3 Total$2, Required assets =Specified sources of financing $2, =$2, AFN = Required assets - SSOFAFN = = $114.7 million MicroDrive needs m of add. financing. Its intitial financing policy is to obtain these add. funds as notes payable bringing forecasted total to = $224.7 million.")
16
Problem 14-5

17
H.W. Problem 14-8

18
Problem 14-9

19
H.W. Problem 14-7 You can check the notes below for help.

Similar presentations


 OPERATING INCOME (EBIT) - Interest.>")

 Actual Forecast 2006 Forecast 2005 Basis 1st Pass Feedback 4th Pass.>")


