Download presentation
Presentation is loading. Please wait.

1
6.2 Large Sample Significance Tests for a Mean “The reason students have trouble understanding hypothesis testing may be that they are trying to think.” Deming

2
In a law case, there are 2 possibilities for the truth—innocent or guilty Evidence is gathered to decide whether to convict the defendant. The defendant is considered innocent unless “proven” to be guilty “beyond a reasonable doubt.” Just because a defendant is not found to be guilty doesn’t prove the defendant is innocent. If there is not much evidence one way or the other the defendant is not found to be guilty.

3
For Statistical Hypothesis Testing, We have 2 possibilities to choose from, H 0 =Null hypothesis (innocent) Held on to unless there is sufficient evidence to the contrary H a =Alternative hypothesis (guilty) We reject H 0 in favor of H a if there is enough evidence favoring H a
 Held on to unless there is sufficient evidence to the contrary H a =Alternative hypothesis (guilty) We reject H 0 in favor of H a if there is enough evidence favoring H a")
5
Tests of Hypotheses Distribution(s) or population(s): Parameter(s) such as mean and variance Assertion or conjecture about the population(s) – statistical hypotheses 1. About parameter(s): means or variances 2. About the type of populations: normal, binomial, or …
: means or variances 2. About the type of populations: normal, binomial, or ….")
6
Example Is a coin balanced? This is the same as to ask if p=0.5 Is the average lifetime of a light bulb equal to 1000 hours? The assertion is μ=1000

7
Null Hypotheses and Alternatives We call the above two assertions Null Hypotheses Notation: H 0 : p=0.5 and H 0 : μ=1000 If we reject the above null hypotheses, the appropriate conclusions we arrive are called alternative hypotheses H a : p 0.5 H a : μ 1000

8
Null Hypothesis vs Alternative H 0 : p=0.5 vs H a : p 0.5 H 0 :μ=1000 vs H a : μ 1000 It is possible for you to specify other alternatives H a : p>0.5 or H a : p<0.5 H a : μ>1000 or H a : μ<1000

10
Significance Testing /Hypothesis Testing A company claims its light bulbs last on average 1000 hours. We are going to test that claim. We might take the null and alternative hypotheses to be H 0 :μ=1000 vs H a : μ 1000 or may be H 0 :μ=1000 vs H a : μ<1000

11
Mistakes or errors: Law case—convict an innocent defendant; or fail to convict a guilty defendant. The law system is set up so that the chance of convicting an innocent person is small. Innocent until “proven guilty” beyond a reasonable doubt.

12
Two Types of Errors in statistical testing Type I error -- reject H 0 when it is true (convict innocent person) Type II error -- accept H 0 when it is not true (find guilty person innocent)
 Type II error -- accept H 0 when it is not true (find guilty person innocent)")
13
Statistical hypotheses are set up to Control type I error =P(type I error) =P(reject H 0 when H 0 true) (a small number) Minimize type II error =P(type II error) =P(accept H 0 when H 0 false)
 =P(reject H 0 when H 0 true) (a small number) Minimize type II error =P(type II error) =P(accept H 0 when H 0 false)")
14
Control Types of Errors In practice, is set at some small values, usually 0.05 If you want to control at some small values, you need to figure out how large a sample size (n) is required to have a small also. 1- is called the power of the test 1- =Power=P(reject H 0 when H 0 false)
.")
15
Example X=breaking strength of a fish line, normal distributed with σ=0.10. Claim: mean is =10 H 0 : =10 vs H A : 10 A random sample of size n=10 is taken, and sample mean is calculated Accept H 0 if Type I error? Type II error when =10.10?

16
Solution Type I error=P(reject H 0 when =10)
")
17
Solution Type II error=P(accept H 0 when H 0 false) Power=1-0.0571=0.9429
 Power= =0.9429")
18
Tests concerning Means 5 steps to set up a statistical hypothesis test

19
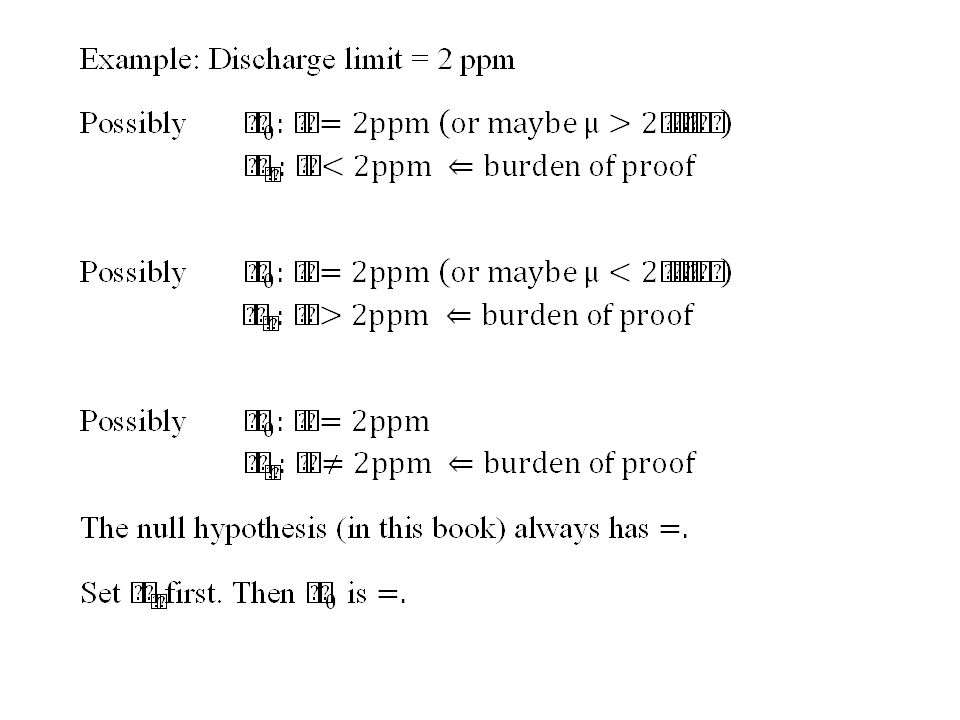
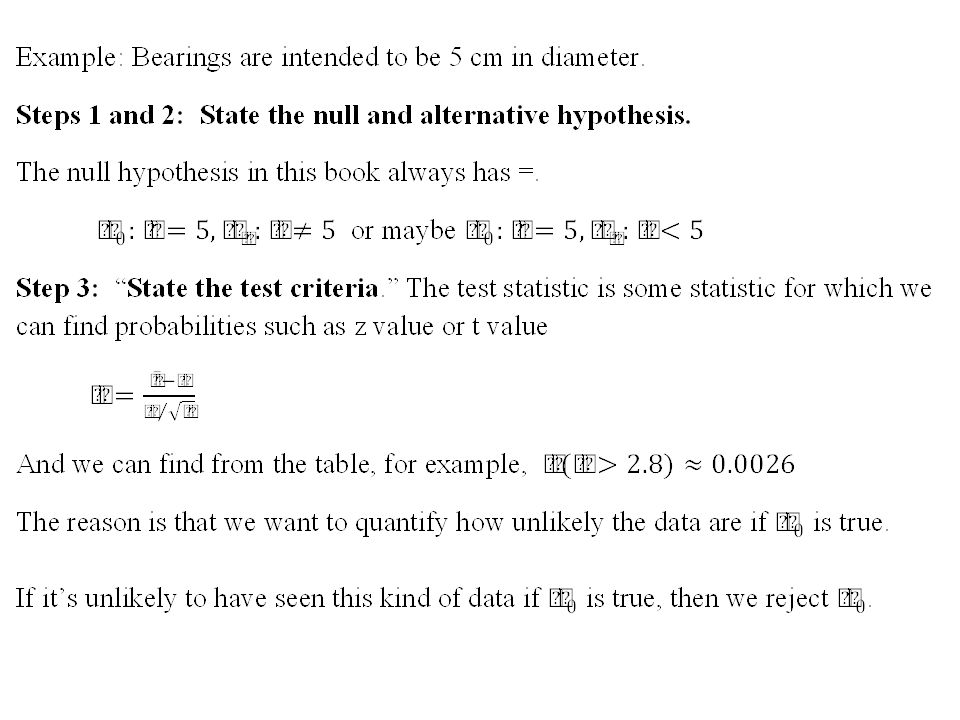
Steps (p. 350) Steps 1 and 2: State the null and alternative hypothesis. Step 3: State the test criteria. That is, give the formula for the test statistic (plugging in only the hypothesized value from the null hypothesis but not any sample information) and the reference distribution. Then state in general terms what observed values of the test statistic constitute evidence against the null hypothesis.
 and the reference distribution. Then state in general terms what observed values of the test statistic constitute evidence against the null hypothesis..")
20
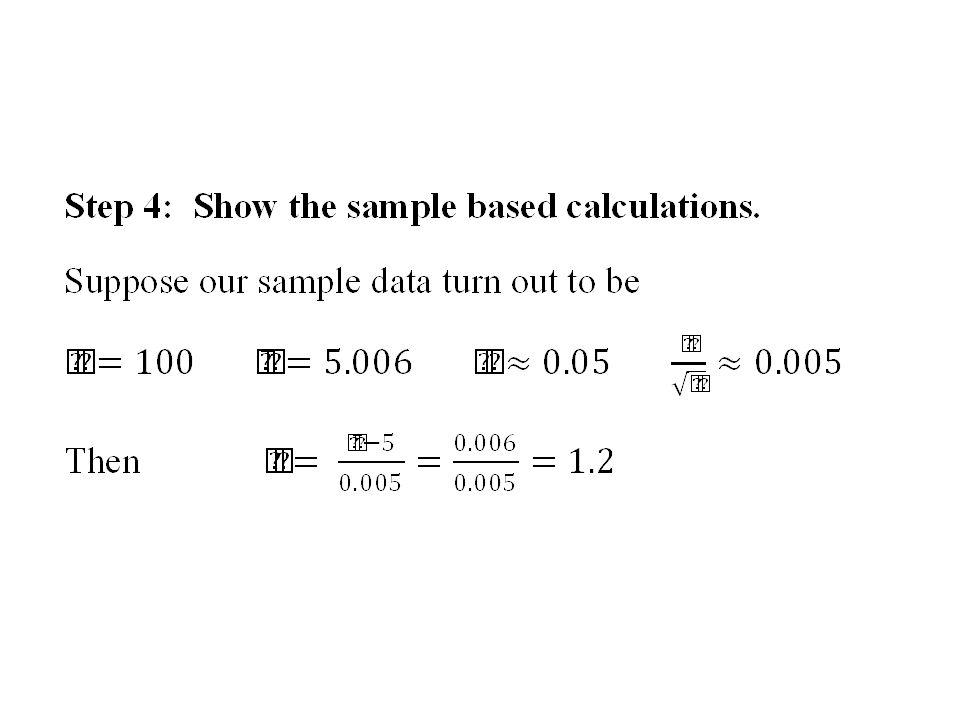
Step 4: Show the sample based calculations. Step 5: Report an observed level of significance, p-value, and (to the extent possible) state its implications in the context of the real engineering problem.
 state its implications in the context of the real engineering problem..")
25
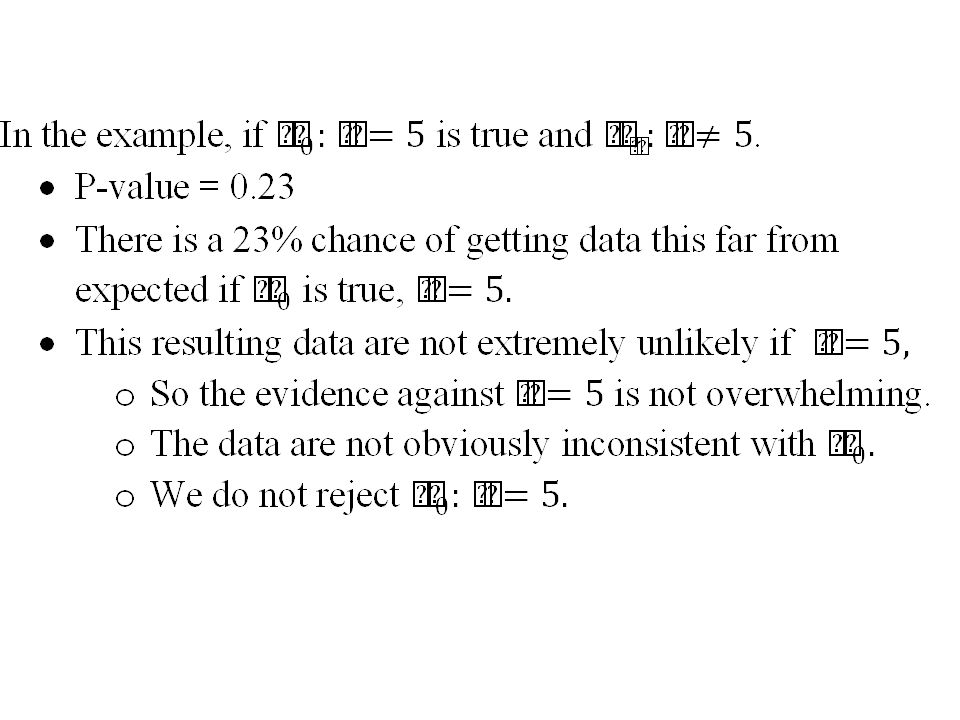
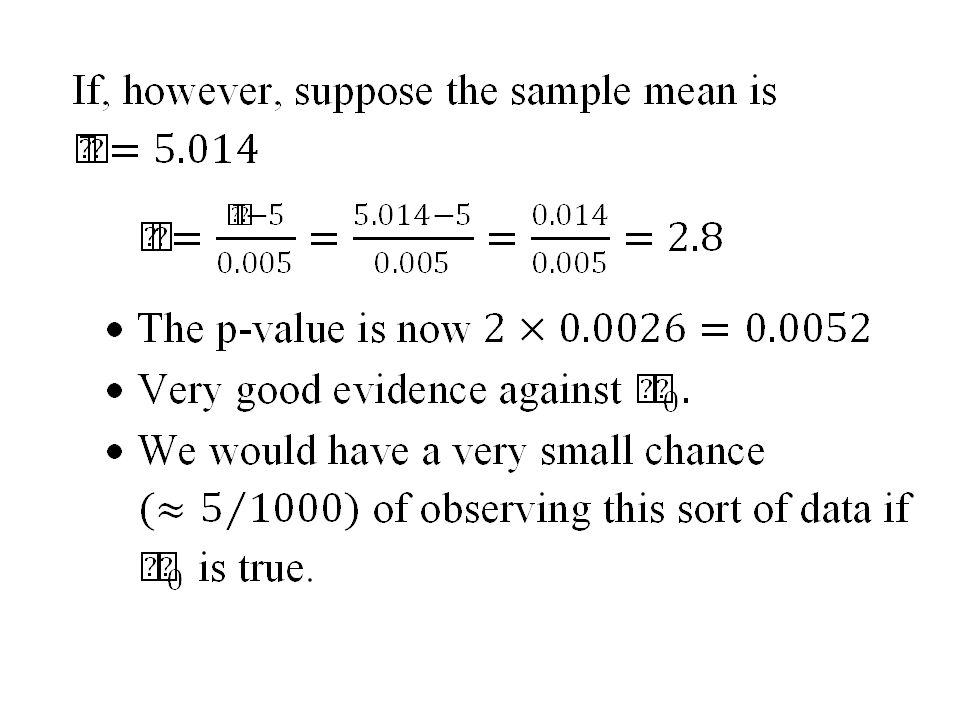
Interpret the Results If the p-value is small, This type of data are unlikely if H 0 is true. The fact that we are looking at this data set right now indicates that H 0 is likely not true. The null hypothesis looks bad reject H 0.

26
The p-value is the probability of a result at least as extreme (away from what the null hypothesis would have predicted) if in fact the null hypothesis is true. So if the data are extremely unlikely when the null hypothesis is true, – The p-value is small and – The null hypothesis looks bad.

32
P-values and hypothesis testing are widely used. However, in my opinion and some others’ opinions (see author’s comments later in the chapter), more often than not, such significance tests are not useful summaries. See Deming quote earlier. Generally, confidence intervals are more useful summaries.
, more often than not, such significance tests are not useful summaries. See Deming quote earlier. Generally, confidence intervals are more useful summaries..")
38
Exercise Given that n=25, =100, and sample mean is 1050, 1. Test the hypotheses H 0 : =1000 vs H A : <1000 at level =0.05. 2. Test the hypotheses H 0 : =1000 vs H A : ≠1000 at level =0.05.

40
Solution 1. 2. More evidence against H 0 is smaller values of z Evidence against H 0 is z values away from 0 in either direction

Similar presentations


 REJECT Compute the Sample Mean.>")


2000 South-Western College.>")


 Decision Making (Hypothesis Testing) A formal method for decision making in the presence of.>")