Download presentation
Presentation is loading. Please wait.

1
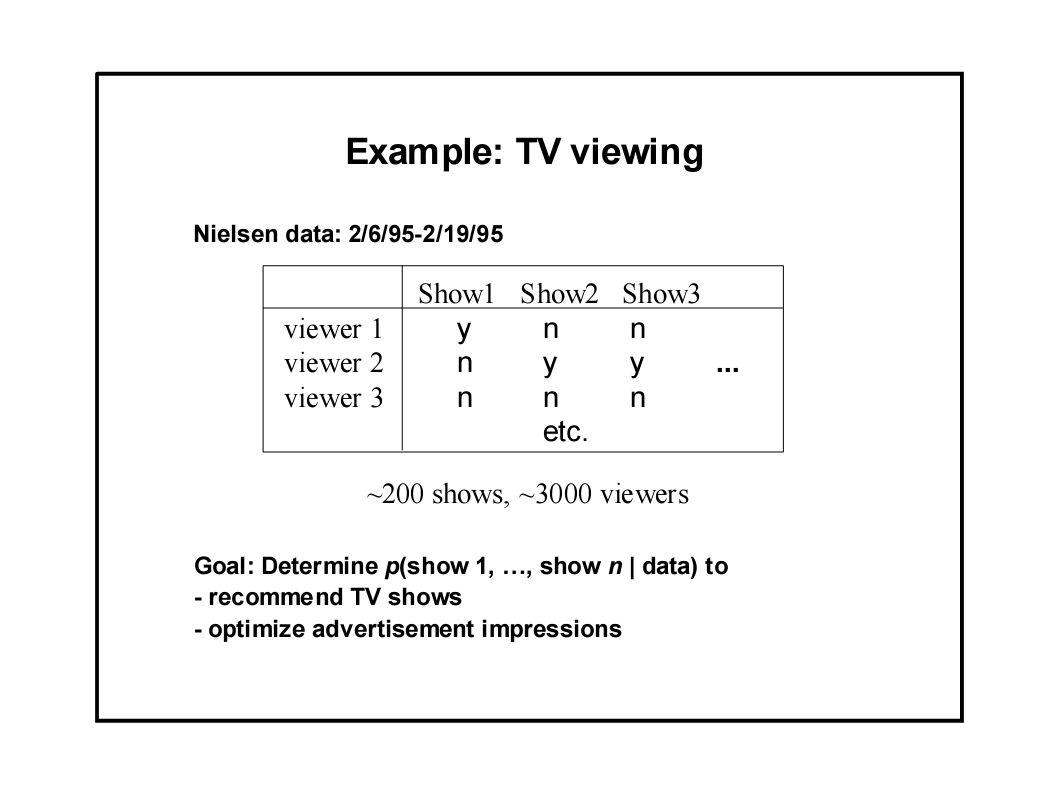
Spring 2014 Course PSYC 5835 - Thinking Proseminar – Matt Jones Provides beginning Ph.D. students with a basic introduction to research on complex human cognition, including reasoning, problem solving, decision making, analogy, concept learning, and knowledge representation. Will include consideration of theoretical, behavioral, and cognitive neuroscience perspectives. Graduate students in all programs and advanced undergraduates welcome with instructor consent. Wednesdays 1100AM-1240PM mcj@colorado.edu

2
Learning In Bayesian Networks: Missing Data And Hidden Variables

3
Missing Vs. Hidden Variables Missing often known but absent for certain data points missing at random or missing based on value e.g., netflix ratings Hidden never observed but essential for predicting visible variables e.g., human memory state a.k.a. latent variables

4
Quiz “Semisupervised learning” concerns learning where additional input examples are available, but labels are not. According to the model below, will partial data (either X or Y) inform the model parameters? X known? Y known? X Y θ y|x θxθx θ y|~x XX Y
 inform the model parameters. X known. Y known. X Y θ y|x θxθx θ y|~x XX Y.")
6
Missing Data: Exact Inference In Bayes Net Y: observed variables Z: unobserved variables How do we do parameter updates for θ i in this case? If X i and Pa i are observed, then situation is straightforward (e.g., like coin toss case). If X i or any Pa i are missing, need to marginalize over Z E.g., X i ~ Multinomial(θ ij ) Note: posterior is a Dirichlet mixture Dirichlet # values of X i Specific value of X i Dirichlet X = {Y,Z}
. If X i or any Pa i are missing, need to marginalize over Z E.g., X i ~ Multinomial(θ ij ) Note: posterior is a Dirichlet mixture Dirichlet # values of X i Specific value of X i Dirichlet X = {Y,Z}.")
7
Missing Data: Gibbs Sampling Given a set of observed incomplete data, D = {y 1,..., y N } 1. Fill in arbitrary values for unobserved variables for each case 2. For each unobserved variable x i in case l, sample: 3. evaluate posterior density on complete data D c ' 4. repeat steps 2 and 3, and compute mean of posterior density

8
Missing Data: Gaussian Approximation Approximate as a multivariate Gaussian. Appropriate if sample size |D| is large, which is also the case when Monte Carlo is inefficient 1. find the MAP configuration by maximizing g(.) 2. approximate using 2 nd degree Taylor polynomial 3. leads to approximate result that is Gaussian ~ negative Hessian of g(.) eval at ~
 2. approximate using 2 nd degree Taylor polynomial 3. leads to approximate result that is Gaussian ~ negative Hessian of g(.) eval at ~.")
9
Missing Data: Further Approximations As the data sample size increases, Gaussian peak becomes sharper, so can make predictions based on the MAP configuration can ignore priors (diminishing importance) -> max likelihood How to do ML estimation Expectation Maximization Gradient methods
 -> max likelihood How to do ML estimation Expectation Maximization Gradient methods")
10
Expectation Maximization Scheme for picking values of missing data and hidden variables that maximizes data likelihood E.g., population of Laughing Goat baby stroller, diapers, lycra pants backpack, saggy pants baby stroller, diapers backpack, computer, saggy pants diapers, lycra computer, saggy pants backpack, saggy pants

11
Expectation Maximization Formally V: visible variables H: hidden variables θ: model parameters Model P(V,H|θ) Goal Learn model parameters θ in the absence of H Approach Find θ that maximizes P(V|θ)
 Goal Learn model parameters θ in the absence of H Approach Find θ that maximizes P(V|θ)")
12
EM Algorithm (Barber, Chapter 11) Bound on marginal likelihood equality only when q(h|v)=p(h|v,θ) E-step: for fixed θ, find q(h|v) that maximizes RHS M-step: for fixed q, find θ that maximizes RHS if each step maximizes RHS, it’s also improving LHS
 Bound on marginal likelihood equality only when q(h|v)=p(h|v,θ) E-step: for fixed θ, find q(h|v) that maximizes RHS M-step: for fixed q, find θ that maximizes RHS if each step maximizes RHS, it’s also improving LHS")
13
EM Algorithm Guaranteed to find local optimum of θ Sketch of proof Bound on marginal likelihood equality only when q(h|v)=p(h|v,θ) E-step: for fixed θ, find q(h|v) that maximizes RHS M-step: for fixed q, find θ that maximizes RHS if each step maximizes RHS, it’s also improving LHS technically, it’s not lowering LHS
=p(h|v,θ) E-step: for fixed θ, find q(h|v) that maximizes RHS M-step: for fixed q, find θ that maximizes RHS if each step maximizes RHS, it’s also improving LHS technically, it’s not lowering LHS")
14
Barber Example Contours are of the lower bound Note alternating steps along θ and q axes note that steps are not gradient steps and can be large Choice of initial θ determines local likelihood optimum

15
Clustering: K-Means Vs. EM K means 1.choose some initial values of μ k 2.assign each data point to the closest cluster 3.recalculate the μ k to be the means of the set of points assigned to cluster k 4.iterate to step 2

16
K-means Clustering From C. Bishop, Pattern Recognition and Machine Learning

17
K-means Clustering

20
Clustering: K-Means Vs. EM K means 1.choose some initial values of μ k 2.assign each data point to the closest cluster 3.recalculate the μ k to be the means of the set of points assigned to cluster k 4.iterate to step 2

21
Clustering: K-Means Vs. EM EM 1.choose some initial values of μ k 2.probabilistically assign each data point to clusters 1. P(Z=k|μ) 3.recalculate the μ k to be the weighted mean of the set of points 1. weight by P(Z=k|μ) 4.iterate to step 2
 3.recalculate the μ k to be the weighted mean of the set of points 1. weight by P(Z=k|μ) 4.iterate to step 2.")
22
EM for Gaussian Mixtures

25
Variational Bayes Generalization of EM also deals with missing data and hidden variables Produces posterior on parameters not just ML solution Basic (0 th order) idea do EM to obtain estimates of p(θ) rather than θ directly
 idea do EM to obtain estimates of p(θ) rather than θ directly")
26
Variational Bayes Assume factorized approximation of joint hidden and parameter posterior: Find marginals that make this approximation as close as possible. Advantage? Bayesian Occam’s razor: vaguely specified parameter is a simpler model -> reduces overfitting

27
Gradient Methods Useful for continuous parameters θ Make small incremental steps to maximize the likelihood Gradient update: swap

28
All Learning Methods Apply To Arbitrary Local Distribution Functions Local distribution function performs either Probabilistic classification (discrete RVs) Probabilistic regression (continuous RVs) Complete flexibility in specifying local distribution fn Analytical function (e.g., homework 5) Look up table Logistic regression Neural net Etc. LOCAL DISTRIBUTION FUNCTION

29
Summary Of Learning Section Given model structure and probabilities, inferring latent variables Given model structure, learning model probabilities Complete data Missing data Learning model structure

30
Learning Model Structure

31
Learning Structure and Parameters The principle Treat network structure, S h, as a discrete RV Calculate structure posterior Integrate over uncertainty in structure to predict The practice Computing marginal likelihood, p(D|S h ), can be difficult. Learning structure can be impractical due to the large number of hypotheses (more than exponential in # of nodes)
.")
32
source: www.bayesnets.com

33
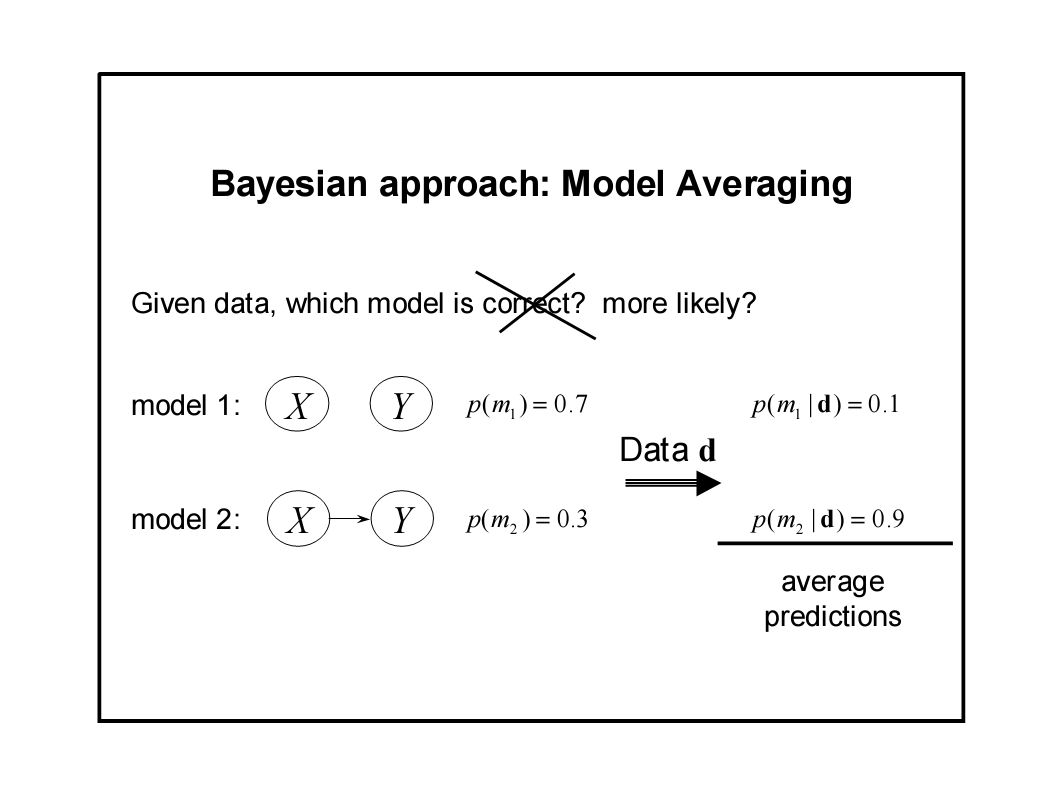
Approach to Structure Learning model selection find a good model, and treat it as the correct model selective model averaging select a manageable number of candidate models and pretend that these models are exhaustive Experimentally, both of these approaches produce good results. i.e., good generalization

35
SLIDES STOLEN FROM DAVID HECKERMAN

37
Interpretation of Marginal Likelihood Using chain rule for probabilities Maximizing marginal likelihood also maximizes sequential prediction ability! Relation to leave-one-out cross validation Problems with cross validation can overfit the data, possibly because of interchanges (each item is used for training and for testing each other item) has a hard time dealing with temporal sequence data
 has a hard time dealing with temporal sequence data.")
38
Coin Example

39
α h, α t, #h, and #t all indexed by these conditions

40
# parent config # nodes # node states

41
Computation of Marginal Likelihood Efficient closed form solution if no missing data (including no hidden variables) mutual independence of parameters θ local distribution functions from the exponential family (binomial, Poisson, gamma, Gaussian, etc.) conjugate priors
 mutual independence of parameters θ local distribution functions from the exponential family (binomial, Poisson, gamma, Gaussian, etc.) conjugate priors")
42
Computation of Marginal Likelihood Approximation techniques must be used otherwise. E.g., for missing data can use Gibbs sampling or Gaussian approximation described earlier. Bayes theorem 1. Evaluate numerator directly, estimate denominator using Gibbs sampling 2. For large amounts of data, numerator can be approximated by a multivariate Gaussian

43
Structure Priors Hypothesis equivalence identify equivalence class of a given network structure All possible structures equally likely Partial specification: required and prohibited arcs (based on causal knowledge) Ordering of variables + independence assumptions ordering based on e.g., temporal precedence presence or absence of arcs are mutually independent -> n(n-1)/2 priors p(m) ~ similarity(m, prior Belief Net)
 Ordering of variables + independence assumptions ordering based on e.g., temporal precedence presence or absence of arcs are mutually independent -> n(n-1)/2 priors p(m) ~ similarity(m, prior Belief Net)")
44
Parameter Priors all uniform: Beta(1,1) use a prior Belief Net parameters depend only on local structure
 use a prior Belief Net parameters depend only on local structure")
45
Model Search Finding the belief net structure with highest score among those structures with at most k parents is NP-hard for k > 1 (Chickering, 1995) Sequential search add, remove, reverse arcs ensure no directed cycles efficient in that changes to arcs affect only some components of p(D|M) Heuristic methods greedy greedy with restarts MCMC / simulated annealing
 Sequential search add, remove, reverse arcs ensure no directed cycles efficient in that changes to arcs affect only some components of p(D|M) Heuristic methods greedy greedy with restarts MCMC / simulated annealing")
48
two most likely structures

50
2x10 10

Similar presentations


 great text by Hastie, Tibshirani, & Friedman great text ECEN 5018 – Game Theory ECEN 5322 –>")


