Download presentation
Presentation is loading. Please wait.

1
Air Pollution in Hamilton – Health Effects and Sources, Some Surprises EP 2SO3 October 30, 2006

2
Performed by Rotek Environmental And D. Corr, Ph.D. Dept of Engineering Physics McMaster University For Clean Air Hamilton /City of Hamilton/ /MOE/EC

3
Good Intentions + Good Science + Good Process = Real Progress

4
GROUP PROCESS 50% PROCESS + 50% CONTENT = ACHIEVEMENT Forming Storming Norming Performing (Reforming)
")
5
Clean Air Hamilton Strategy Risk Management Approach Applied to Community Wide Actions Identify Problem Measure/Evaluate Prioritize Risks Inform Community Cooperative Actions www.cleanair.hamilton.ca

6
The Problem Sahsuvaroglu & Jerrett 2003 Health Impacts of Air Pollutants in Hamilton

7
Health Impacts in Hamilton – by Air Pollutant Sahsuvaroglu & Jerrett 2003

8
Study Objectives “Where is it coming from?” Identify and rank sources, including transportation sources, of NOx, SO 2, Airborne Particles and CO, using mobile monitoring techniques (no direct local sources of Ozone). Investigate the effect of idling vehicles at a designated school during student drop off and pickup times. Investigate trackout/road dust issues

9
Table 1 - PM 10 Point Sources 56 Sources Total IDDescription LocationPM10 Tonnes ASteel Hamilton Industrial 964 BSteel Hamilton Industrial 688 DLime West Mountain 87 CCarbon Black Hamilton Industrial 73 EAggregatesEast Mountain57 FEdible OilHamilton Industrial32 GSteelHamilton Industrial23 HSteel ByproductHamilton Industrial15 ICarbonStoney Creek9 JAggregates West Mountain 7.6 KSteel Byproduct Hamilton Industrial 6.7 LManufacturingHamilton Industrial6.3 MFoundry Hamilton Industrial 5.6 NLandfill East Mountain 4 OSlag Byproduct Hamilton Industrial 4

10
PFoundryStoney Creek3 QBrick Stoney Creek 2.6 RLiquids Processors Hamilton Industrial 2.5 SAggregates West Mountain 2.4 TManufacturing West Hamilton 2.3 UUniversity West Hamilton 2.2 VNatural Gas West Mountain 1.6 WManufacturing Hamilton Industrial 1.4 XConcrete Stoney Creek 1.3 YFoundry Hamilton Industrial 1.1 ZManufacturing Hamilton Industrial 1 AAAggregates East Mountain 1 ABConcrete East Mountain 1 ACAggregates Hamilton Industrial 0.8 ADAggregates Stoney Creek 0.8 AEBrick Central Hamilton 0.6 AFFoundry Stoney Creek 0.6 AGAggregatesStoney Creek0.4 AHAggregates Hamilton West 0.4 AIManufacturing Stoney Creek 0.4 AJManufacturing Stoney Creek 0.3 AKManufacturing Stoney Creek 0.1 ALManufacturing Stoney Creek 0.04 Total 2148 Table 1 - PM 10 Point Sources (contd)
")
11
IDDescriptionLocationTonnes CO ASteelHamilton Industrial23016 BSteelHamilton Industrial6360 GSteelHamilton Industrial451 DLimeWest Mountain382 CCarbon BlackHamilton Industrial236 MFoundryHamilton Industrial58 VNatural GasWest Mountain49 FEdible OilHamilton Industrial34 UUniversityWest Hamilton25 ANSteel ByproductsHamilton Industria17 AGAggregatesStoney Creek2.2 QBrickStoney Creek1.1 ALManufacturingStoney Creek0.44 AIManufacturingStoney Creek0.2 Total30632 Table 2 - CO Point Sources 14 Sources Total

12
IDDescriptionLocationTonnes NOx BSteelHamilton Industrial3114 ASteelHamilton Industrial2703 CCarbon BlackHamilton Industrial1070 DLimeWest Mountain649 AMCogeneration, Natural GasCentral Hamilton260 VNatural GasWest Mountain198 GSteelHamilton Industrial76 UUniversityWest Hamilton53 FEdible OilHamilton Industrial40 ANSteel ByproductsHamilton Industrial20 AGAggregatesStoney Creek2.6 AIManufacturingStoney Creek1.7 QBrickStoney Creek0.98 Total8188 Table 3 - NO x Point Sources 13 Sources Total

13
Table 4 - SO 2 Point Sources 9 Sources Total IDDescriptionLocationSO x Tonnes BSteel Hamilton Industrial 5035 ASteel Hamilton Industrial 3399 CCarbon Black Hamilton Industrial 3130 DLime West Mountain 281 AGAggregates Stoney Creek 16 GSteel Hamilton Industrial 14 ANSteel Byproducts Hamilton Industrial 0.12 AIManufacturing Stoney Creek 0.005 ALManufacturing Stoney Creek 0.003 Total11875

14
National Pollutant Release Inventory – Hamilton Point Sources PM 10 56 Sources CO14 Sources NO x 13 Sources SO 2 9 Sources

15
Total Point Source Emissions by Contaminant COSO x NO x PM 10 30,63211,8758,1882,010 Tonnes

16
Modifiers Emission -Dispersion - Accumulation - Removal

17
What We’d Expect to See Carbon Monoxide – 66% Transportation, 23% Industry Sulphur Dioxide – 92% Industry, 5% Transportation Nitrogen Oxides – 57% Transportation, 37% Industry PM 10 – 73% Open Sources/Road Dust, 18% Industry Note: MOE identified trackout/road dust resuspension as a major problem

18
Emission Sources by Regions in Hamilton Flamborough/ Waterdown East Mtn NE Ind Stny Crk

19
Mobile Command Centre

20
Instrument Rack Mounts

21
A/D Converter, Data Logger, GIS Software

22
Roof Mounting Sampling Intakes Gaseous/Particulate

23
GPS Head, Garmin 18, GIS Display

24
City/Traffic Monitoring 1.City Wide Sampling 2.Road Dust/Road Impacts 3.Intersection Impacts 4.Arterial Road Impact/ Burlington St. 5.Cycle Routes/ Anti Idling

25
Sampling Track, City Wide Scan

26
City Wide Sampling

27
Wind NO ppb

28
Wind

29
City Wide Sampling, Residential Locations

30
Roads vs Residential Areas

31
Stoplight Idling – Concentrations Downwind

32
Burlington St. Upwind Downwind

33
Burlington St Contribution (Approx. 600 Trucks/Hr)
")
34
CARS

35
Vehicle Idling outside Schools “Natural Experiment”

36
Natural Experiment ppb

37
Morning – Idling Vehicles

38
Monitoring Vehicle at School

39
Afternoon – Vehicle Engines Off

40
Natural Experiment ppb

41
Trackout/Diesel Trucks 1.PM 2.5, PM 1 Components 2.Photos 3.Sample Trace 4.Consolidated PM 10 Data 5.Comparison Previous Data

42
Road Dust, Covariance 20xPM 1, 10xPM 2.5, PM 10

47
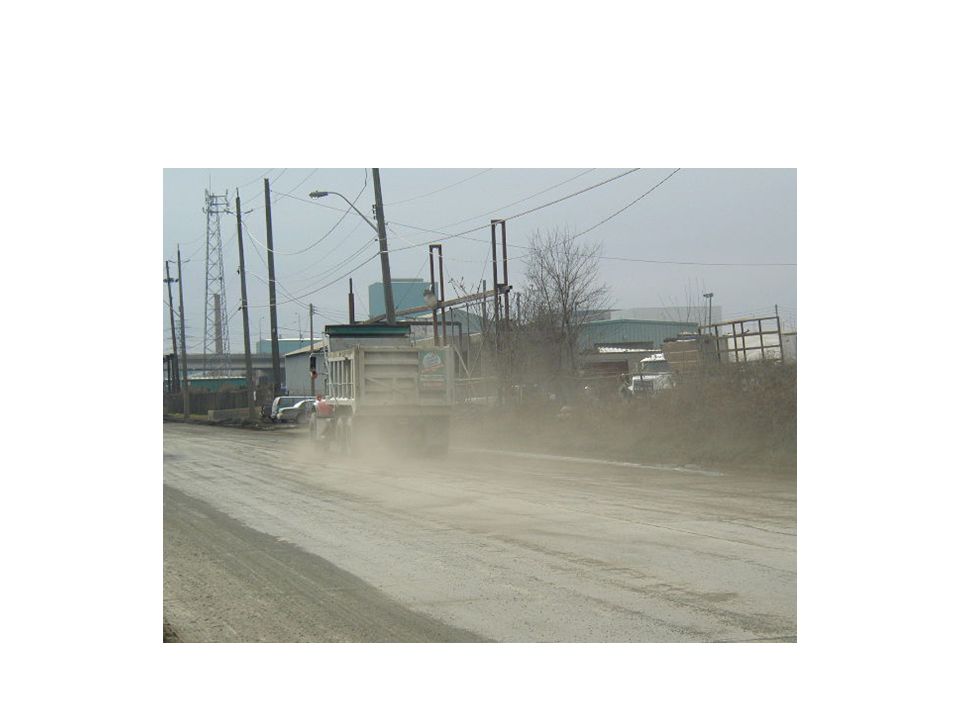
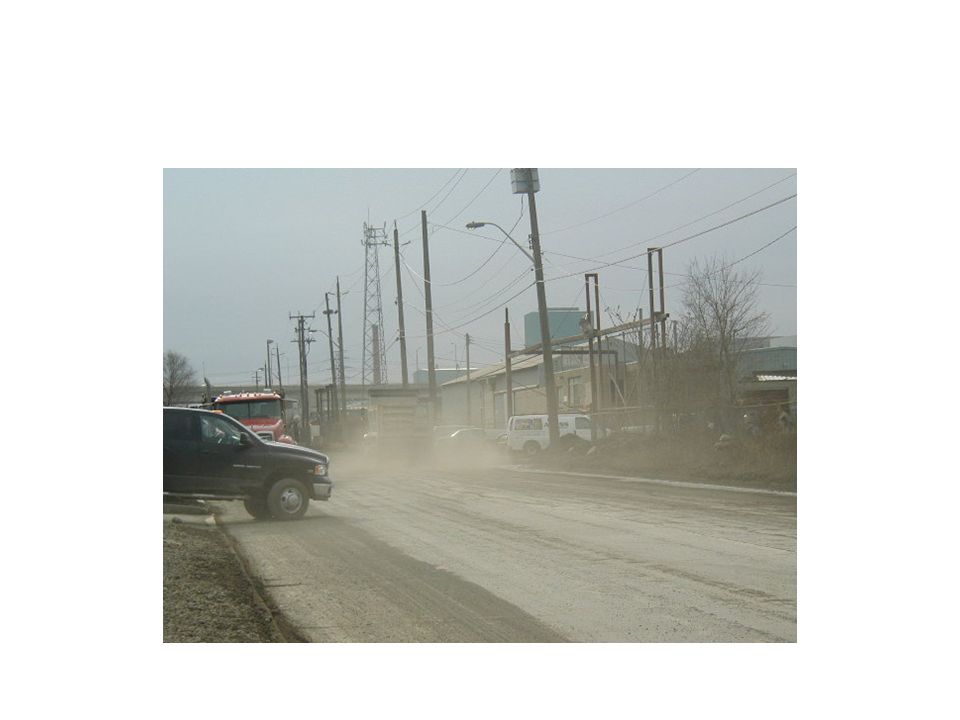
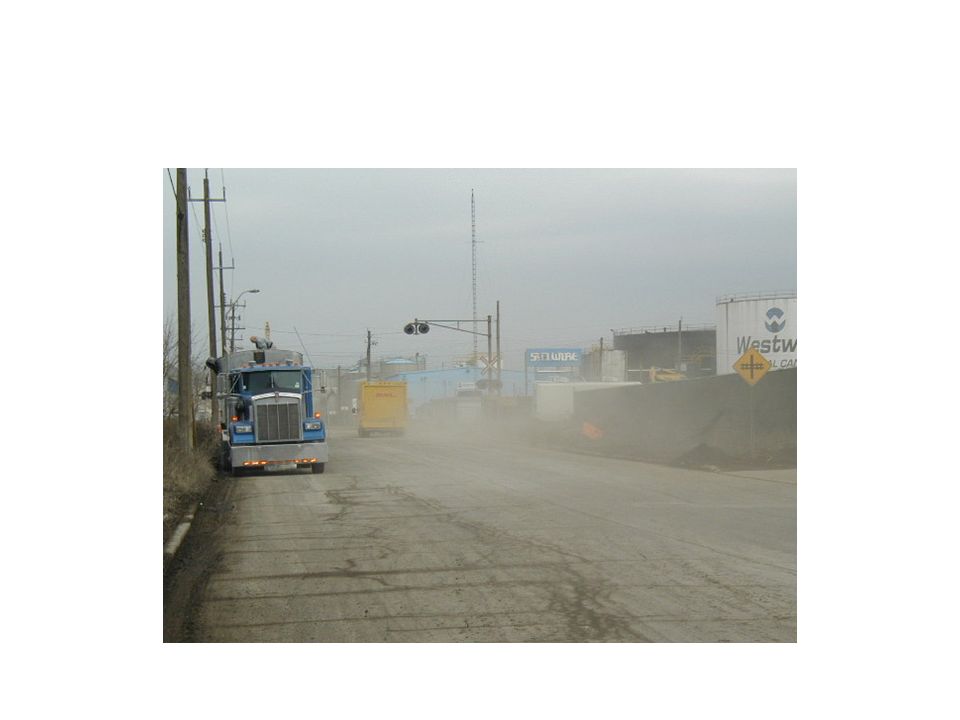
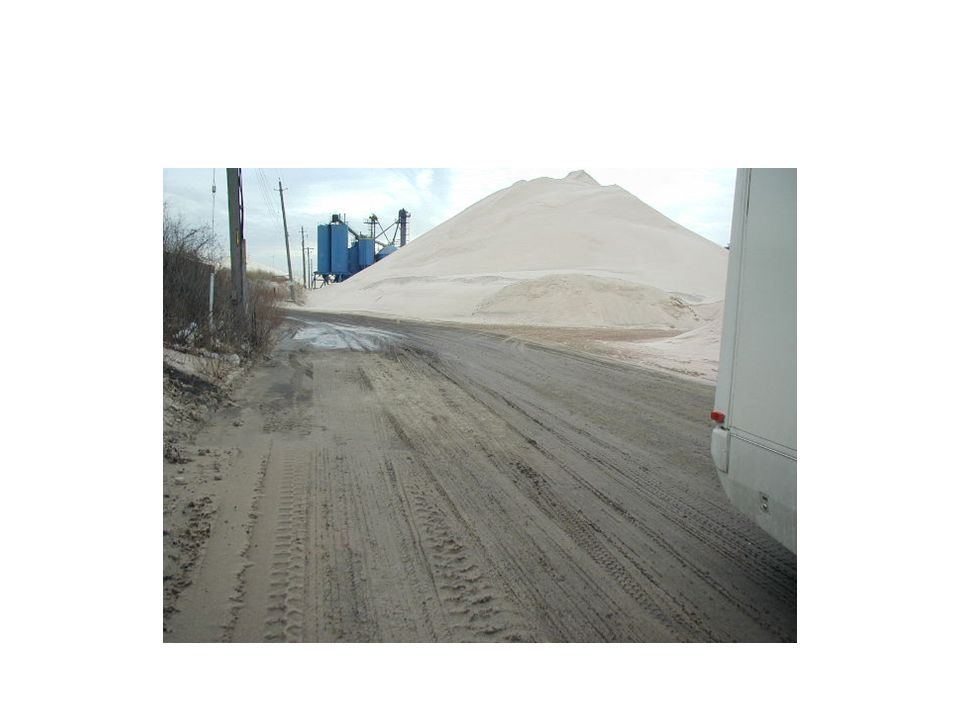
Trackout 13 Jan

48
Road Dust/Trackout 18 Locations Monitored, 14 Sources Identified

49
PM10 ROAD DUST Ben Garden, Savas Kanaroglou, Pat DeLuca, Spatial analysis Unit, McMaster University

50
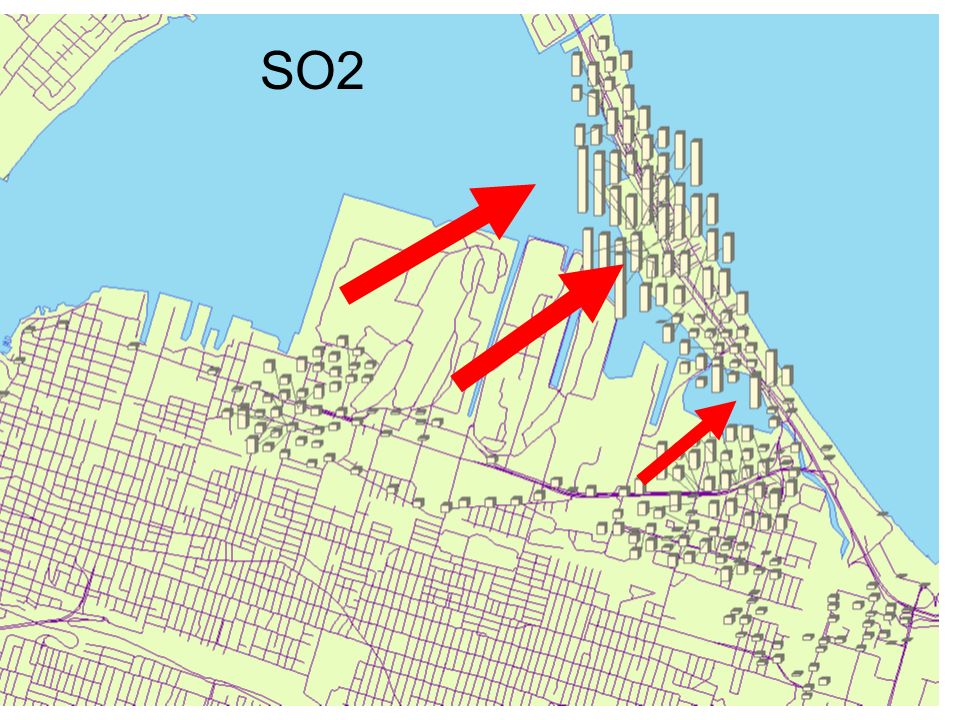
Source Tracking 1.Photos 2.SO 2 Tracing 3.Other Contaminants 4.SO 2 Data Consolidation 5.Source Ranking/NPRI Comparison, SO 2, NO, PM 10

51
Source C

52
Sources B

53
B

54
Particulate B

55
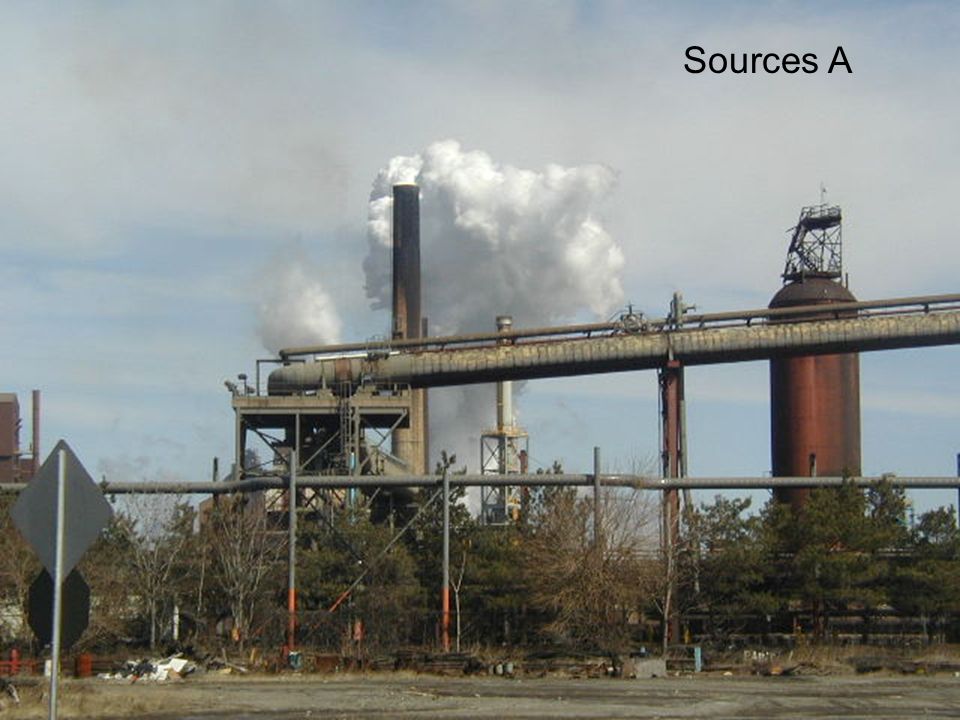
Sources A

57
Source V

58
Source AY

59
All Scans 21 March

60
SO 2 Company A

61
Source Plume Back Tracking Impact Source

62
SO 2 Company A

63
NO Company A

64
19 Jan SO 2

65
Ambient SO 2 vs NPRI SO 2 Point Sources: A-Integrated Steel, B-Integrated Steel, AN- Steel Byproducts, C- Carbon Black, G-Steel, B-Integrated Steel, A-Integrated Steel, D-Lime, CP-Rail Yard.

66
Ambient NO vs NPRI NO Point Sources: B-Integrated Steel, CP-Rail Yard, G-Steel, A-Integrated Steel, AN- Steel Byproducts, D-Lime, C-Carbon Black, AM-Cogeneration, AT-Chemical.

67
Ambient PM 10 vs NPRI PM 10 Point Sources: B-Integrated Steel, ABP-Recycling, AY-Agricultural Product Handling, AG- Aggregate or AZ-Steel Handling, AU-Recycling, AT-Chemical, M-Foundry, G-Steel, CP-Rail Yard, A- Integrated Steel, AM-Natural Gas Cogeneration Facility, C-Carbon Black.

68
Ambient CO vs NPRI CO Point Sources: AM-Cogeneration, AT-Chemical; AN- Steel Byproducts; B- Integrated Steel; A-Integrated Steel; G-Steel; C-Carbon Black; CP-Rail Yard.

69
Continuous Monitoring Locations Centre Industrial

70
NO – GIS Plot NO ppb

71
PM 10 ug/m3

72
CO ppm

73
SO2

75
NE

76
Conclusions These data are limited to Winter season and for relatively short periods of time. Point sources in the industrial area are sufficiently close together that specific compounds needed to be used as tracers to separate impacts. Residential areas have relatively low levels of pollutants, however city impacts increase as distance downwind from the city edge increases. Concentrations increase sharply from residential areas to main roads, increasing again at intersections. Peak concentrations may increase by factors of 20-50. Time pattern of concentrations near intersections shows that idling vehicles at stop lights are a very significant source of pollutant exposure. Short survey near a school pickup and drop-off point showed that air pollution concentrations experienced by students can be significantly reduced by turning off engines in waiting cars.

77
Conclusions (contd) Road dust includes elevated PM 10, PM 2.5 and PM 1. Trackout resuspension by large diesel trucks is a major problem. Some levels doubled from same period in previous year. 14 severe Trackout locations identified and monitored. Peak ambient values of NO, SO 2, PM 10 and CO from 15 point sources were quantified and ranked. NPRI data rank industrial emissions in Hamilton in the order CO, SO 2, NO and PM 10, and total emissions in the order CO, PM 10, NO, SO 2. Mobile monitoring to date is showing an order of CO, PM 10, NO, SO 2, even in the industrial area. Large differences in distance from point source to fencelines heavily modify direct impacts compared to NPRI emissions data. Even allowing for distance variations there are significant differences between ambient and NPRI data for some sources. Other sources show good agreement. Mobile monitoring has different strengths than fixed network monitoring and both are necessary. Combination of simple GIS analysis and air pollutant monitoring proved very useful. A more sophisticated GIS analysis would be worthwhile. Data can be used to refine Regulation 419 models

78
Recommendations Move cycle lanes off main roads, innovative signage. Reduce idling emissions, including at school dropoff locations (enlist parent teacher groups). Monitor school bus idling. Prioritize trackout reduction - paving, wheel washing, front gate dust monitoring. Reinstate/enhance targeted road cleaning in industrial areas. Reduce large diesel truck trips, it’s the combination of heavy trucks and dirty roads that is a problem. Gateway monitoring of diesel exhaust at city entry/exit points, industrial arterials. Continue reducing point source remissions of SOx, NOx and PM 10 (both ambient and NPRI data) in order to improve/reduce health impacts. Review existing fixed network stations and locations to refocus on adverse health causing pollutants, e.g. NOx, monitoring gaps. Compare mobile data to MOE STAC data, more detailed GIS analysis. Review NPRI data variances with ambient. Extend mobile monitoring to other seasons for more definitive source separation in complex areas and documenting different met regime impacts, particularly inversions. Extend mobile monitoring to other communities. Use mobile data to refine local source inputs to Regulation 419 models. Disclaimer:- All recommendations and opinions are the sole responsibility of D. Corr and do not necessarily represent the policy or position of funding agencies or others.
. Monitor school bus idling. Prioritize trackout reduction - paving, wheel washing, front gate dust monitoring. Reinstate/enhance targeted road cleaning in industrial areas. Reduce large diesel truck trips, it’s the combination of heavy trucks and dirty roads that is a problem. Gateway monitoring of diesel exhaust at city entry/exit points, industrial arterials. Continue reducing point source remissions of SOx, NOx and PM 10 (both ambient and NPRI data) in order to improve/reduce health impacts. Review existing fixed network stations and locations to refocus on adverse health causing pollutants, e.g. NOx, monitoring gaps. Compare mobile data to MOE STAC data, more detailed GIS analysis. Review NPRI data variances with ambient. Extend mobile monitoring to other seasons for more definitive source separation in complex areas and documenting different met regime impacts, particularly inversions. Extend mobile monitoring to other communities. Use mobile data to refine local source inputs to Regulation 419 models. Disclaimer:- All recommendations and opinions are the sole responsibility of D. Corr and do not necessarily represent the policy or position of funding agencies or others..")
79
Good Intentions + Good Science + Good Process = Real Progress

80
GROUP PROCESS 50% PROCESS + 50% CONTENT = ACHIEVEMENT Forming Storming Norming Performing (Reforming)
")
81
www.cleanair.hamilton.ca http://www.cleanair.hamilton.ca/reports/repo rts-news-presentations-fact-sheets.asp www.rotekinc.com

Similar presentations


 9 th Semi-Annual.>")


