Download presentation
Presentation is loading. Please wait.

1
Random Network IST402 – Network Science Acknowledgement: Laszlo Barabasi

3
A. Degree distribution: p k B. Path length: C. Clustering coefficient: Network Science: Graph Theory THREE CENTRAL QUANTITIES IN NETWORK SCIENCE

4
protein-gene interactions protein-protein interactions PROTEOME GENOME Citrate Cycle METABOLISM Bio-chemical reactions Bio-Map

5
Metabolic Network Metab-movie Protein Interactions

6
A CASE STUDY: PROTEIN-PROTEIN INTERACTION NETWORK Network Science: Graph Theory Undirected network N=2,018 proteins as nodes L=2,930 binding interactions as links. Average degree =2.90. Not connected: 185 components the largest (giant component) 1,647 nodes
 1,647 nodes.")
7
A CASE STUDY: PROTEIN-PROTEIN INTERACTION NETWORK Network Science: Graph Theory Undirected network N=2,018 proteins as nodes L=2,930 binding interactions as links. Average degree =2.90. Not connected: 185 components the largest (giant component) 1,647 nodes
 1,647 nodes.")
8
A CASE STUDY: PROTEIN-PROTEIN INTERACTION NETWORK Network Science: Graph Theory p k is the probability that a node has degree k. N k = # nodes with degree k p k = N k / N

9
A CASE STUDY: PROTEIN-PROTEIN INTERACTION NETWORK Network Science: Graph Theory d max =14 =5.61

10
A CASE STUDY: PROTEIN-PROTEIN INTERACTION NETWORK Network Science: Graph Theory =0.12

11
Random Network Introduction Section 1

13
RANDOM NETWORK MODEL

14
The random network model Section 3.2

15
Erdös-Rényi model (1960) Connect with probability p p=1/6 N=10 ~ 1.5 Pál Erdös (1913-1996) Alfréd Rényi (1921-1970) RANDOM NETWORK MODEL
 Connect with probability p p=1/6 N=10 ~ 1.5 Pál Erdös ( ) Alfréd Rényi ( ) RANDOM NETWORK MODEL")
16
Network Science: Random Definition: A random graph is a graph of N nodes where each pair of nodes is connected by probability p.

17
RANDOM NETWORK MODEL p=1/6 N=12 L=8 L=10 L=7

18
RANDOM NETWORK MODEL p=0.03 N=100

19
The number of links is variable Section 3.3

20
RANDOM NETWORK MODEL p=1/6 N=12 L=8 L=10 L=7

21
Number of links in a random network P(L): the probability to have exactly L links in a network of N nodes and probability p: Network Science: Random Graphs The maximum number of links in a network of N nodes. Number of different ways we can choose L links among all potential links. Binomial distribution...

22
MATH TUTORIAL Binomial Distribution: The bottom line Network Science: Random Graphs http://keral2008.blogspot.com/2008/10/derivation-of-mean-and-variance-of.html

23
RANDOM NETWORK MODEL P(L): the probability to have a network of exactly L links Network Science: Random Graphs The average number of links in a random graph The standard deviation
: the probability to have a network of exactly L links Network Science: Random Graphs The average number of links in a random graph The standard deviation")
24
Degree distribution Section 3.4

25
DEGREE DISTRIBUTION OF A RANDOM GRAPH Network Science: Random Graphs As the network size increases, the distribution becomes increasingly narrow—we are increasingly confident that the degree of a node is in the vicinity of. Select k nodes from N-1 probability of having k edges probability of missing N-1-k edges

26
DEGREE DISTRIBUTION OF A RANDOM GRAPH (don’t faint!) Network Science: Random Graphs For large N and small k, we can use the following approximations: for
 Network Science: Random Graphs For large N and small k, we can use the following approximations: for")
27
POISSON DEGREE DISTRIBUTION Network Science: Random Graphs For large N and small k, we arrive to the Poisson distribution:

29
DEGREE DISTRIBUTION OF A RANDOM GRAPH Network Science: Random Graphs P(k) k =50
 k =50")
30
DEGREE DISTRIBUTION OF A RANDOM NETWORK Exact Result -binomial distribution- Large N limit -Poisson distribution- Probability Distribution Function (PDF)
")
31
Real Networks are not Poisson Section 3.4

32
Section 3.5Maximum and minimum degree k max =1,185 =1,000, N=10 9 k min =816

33
NO OUTLIERS IN A RANDOM SOCIETY Network Science: Random Graphs The most connected individual has degree k max ~1,185 The least connected individual has degree k min ~ 816 The probability to find an individual with degree k>2,000 is 10 -27. Hence the chance of finding an individual with 2,000 acquaintances is so tiny that such nodes are virtually inexistent in a random society. a random society would consist of mainly average individuals, with everyone with roughly the same number of friends. It would lack outliers, individuals that are either highly popular or recluse.

34
FACING REALITY: Degree distribution of real networks

35
The evolution of a random network Section 6

37
EVOLUTION OF A RANDOM NETWORK disconnected nodes NETWORK. How does this transition happen?

38
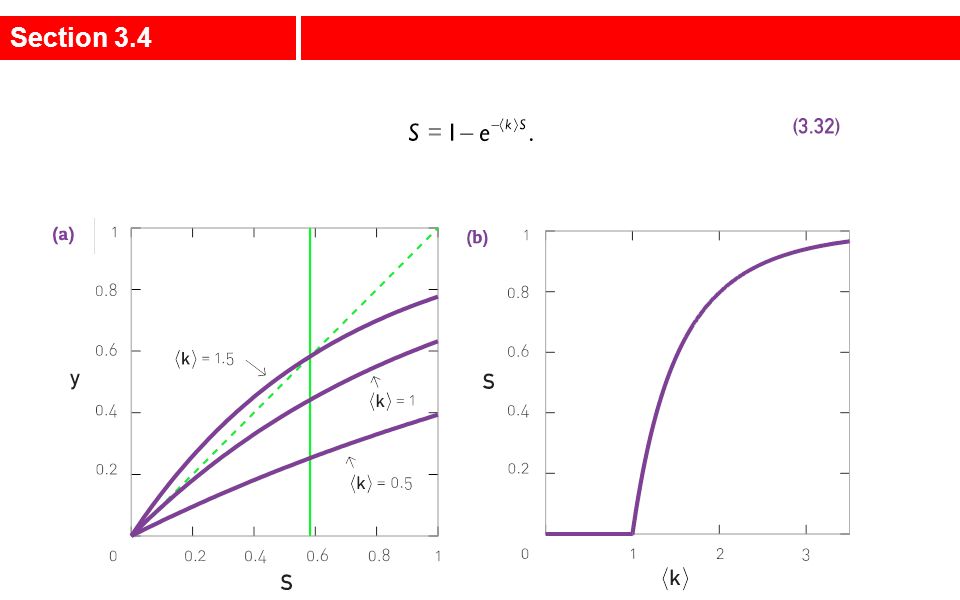
=1 (Erdos and Renyi, 1959) EVOLUTION OF A RANDOM NETWORK disconnected nodes NETWORK. The fact that at least one link per node is necessary to have a giant component is not unexpected. Indeed, for a giant component to exist, each of its nodes must be linked to at least one other node. It is somewhat unexpected, however that one link is sufficient for the emergence of a giant component. It is equally interesting that the emergence of the giant cluster is not gradual, but follows what physicists call a second order phase transition at =1.

39
Section 3.4

41
EVOLUTION OF A RANDOM NETWORK disconnected nodes NETWORK. How does this transition happen?

42
Complexity academy

43
Phase transitions in complex systems I: liquids WaterIce

44
Phase transitions in complex systems I: Magnetism

45
CLUSTER SIZE DISTRIBUTION Probability that a randomly selected node belongs to a cluster of size s: Network Science: Random Graphs At the critical point =1 The distribution of cluster sizes at the critical point, displayed in a log-log plot. The data represent an average over 1000 systems of sizes The dashed line has a slope of Derivation in Newman, 2010

46
I: Subcritical < 1 III: Supercritical > 1 IV: Connected > ln N II: Critical = 1 =0.5 =1 =3 =5 N=100

47
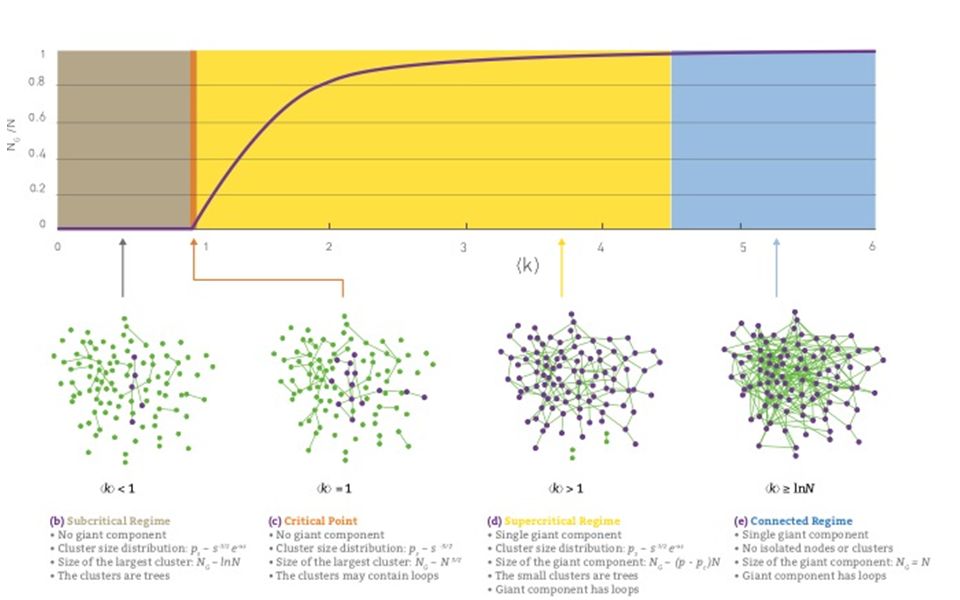
I: Subcritical < 1 p < p c =1/N No giant component. N-L isolated clusters, cluster size distribution is exponential The largest cluster is a tree, its size ~ ln N

48
II: Critical = 1 p=p c =1/N Unique giant component: N G ~ N 2/3 contains a vanishing fraction of all nodes, N G /N~N -1/3 Small components are trees, GC has loops. Cluster size distribution: p(s)~s -3/2 A jump in the cluster size: N=1,000 ln N~ 6.9; N 2/3 ~95 N=7 10 9 ln N~ 22; N 2/3 ~3,659,250
~s -3/2 A jump in the cluster size: N=1,000 ln N~ 6.9; N 2/3 ~95 N= ln N~ 22; N 2/3 ~3,659,250.")
49
=3 Unique giant component: N G ~ (p-p c )N GC has loops. Cluster size distribution: exponential III: Supercritical > 1 p > p c =1/N

50
IV: Connected > ln N p > (ln N)/N =5 Only one cluster: N G =N GC is dense. Cluster size distribution: None

52
Network evolution in graph theory

54
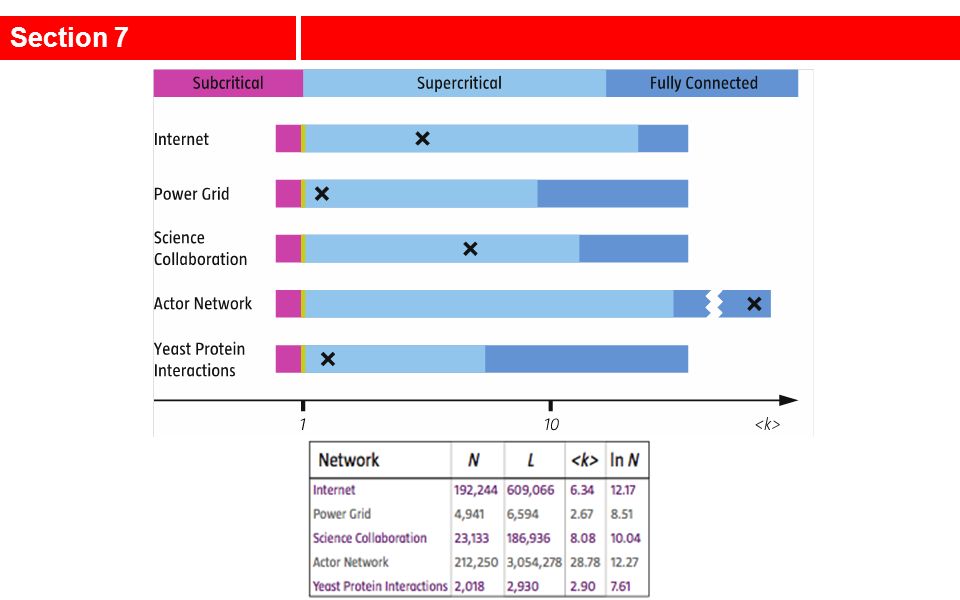
Real networks are supercritical Section 7

56
Take Home Message 1 Definition of the Random graph model (or Erdos- Renyi Model): A random graph is a graph of N nodes where each pair of nodes is connected by probability p.
: A random graph is a graph of N nodes where each pair of nodes is connected by probability p.")
57
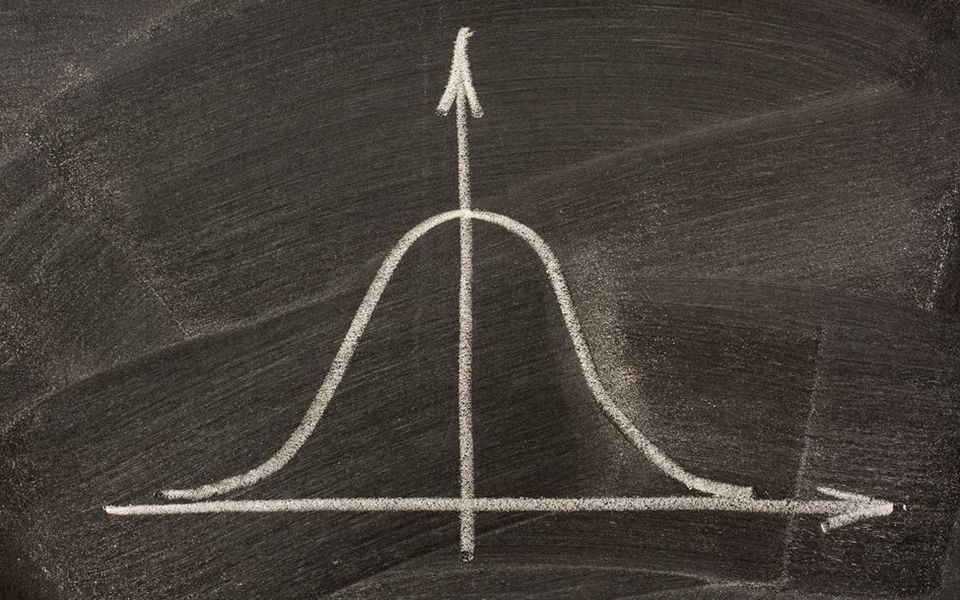
Take Home Message 2 The Random Graph Model Predicts an “average” society Degree distribution follows a bell shaped curve This prediction, however, could not be further from the truth Real networks follow a “fat-tailed” degree distribution

58
Take Home Message 3 – Do not gossip! disconnected nodes NETWORK. A phase transition occurs when =1

59
Required reading http://www.cs.cornell.edu/home/kleinber/net works-book/networks-book-ch02.pdf By Thursday 01/28 Chapter 2 of Easley and Kleinberg. (Networks, Crowds, and Markets: Reasoning About a Highly Connected World) By Next Thursday 02/04 Complete python course on codeacademy https://www.codecademy.com/learn/python
 By Next Thursday 02/04 Complete python course on codeacademy")
60
Course Components What we will do in this class 5% - Attendance 40% - Homework Assignments Class project 10% Midterm milestone report 30% Final presentation 15% Final report

61
FINAL PROJECTS

62
COMPONENTS OF THE PROJECT 1.DATA ACQUISITION Downloading the data and putting it in a usable format 2.NETWORK RESPRESENTATION What are the nodes and links 3.NETWORK ANALYSIS What questions do you want to answer with this network, and which tools/measurements will you use?

63
DATA ACQUISITION Many online data sources will have an API (application programming interface) that allows querying and downloading the data in a targeted way Example: What are all movies from 1984-1995 starring Kevin Bacon and distributed by Paramount Pictures? This is done either through a web interface or through a library within a programming language Other sources will provide raw bulk data (e.g., Excel spreadsheets) that require processing, either manually or through a program you will write
 that require processing, either manually or through a program you will write.")
64
NETWORK RECONSTRUCTION Most datasets will admit more than one representation as a network Some representations will be more or less informative than others Figuring out the “network” that’s buried in your data is part of your project!

65
NETWORK RECONSTRUCTION Suppose you have a list of students and the courses they are registered for One possible network Another possibility Joe IST 210 IST 210 IST 402 IST 402 Jane Sam Joe Jane Sam

66
Measure: N(t), L(t) [t- time if you have a time dependent system); P(k) (degree distribution); average path length; C (clustering coefficient), C rand, C(k); Visualization/communities; P(w) if you have a weighted network; network robustness (if appropriate); spreading (if appropriate). It is not sufficient to measure things– you need to discuss the insights they offer: What did you learn from each quantity you measured? What was your expectation? How do the results compare to your expectations? Time frame will be strictly enforced. Approx 10min; You will also need to write a formal report summarizing your project. Send us an email with names/titles/program. Come earlier and try out your slides with the projector. Show an entry of the data source—just to have a sense of how the source looks like. On the slide, give your program/name. Grading criteria: Use of network tools (completeness/correctness); Ability to extract information/insights from your data using the network tools; Overall quality of the project/presentation. Final project guidelines
; Ability to extract information/insights from your data using the network tools; Overall quality of the project/presentation. Final project guidelines.")
Similar presentations


 Mugizi Rwebangira.>")

>")
. Réka Albert and AL Barabási,Statistical Mechanics.>")


 Networks and Measurements.>")


 Networks Analysis III Prof. Dr. Daning Hu Department of Informatics University of Zurich Oct 16th, 2012.>")
