Download presentation
Presentation is loading. Please wait.

1
Farm Level Impacts of Farm Bill Proposal – HR 2646 James W. Richardson Professor and TAES Faculty Fellow jwrichardson@tamu.edu Joe Outlaw Associate Professor and Extension Economist joutlaw@tamu.edu Ph 979-845-5913 Fx 979-845-3140 AFPC www.afpc.tamu.edu FAPRI www.fapri.missouri.edu FAPRI www.fapri.iastate.edu 2001 Southern Regional Agricultural Outlook Conference Atlanta, Georgia September 24-26, 2001

2
Outline January 2001 Baseline Prices January 2001 Baseline for Representative Farms H.R. 2646 Overview Comparison of Baseline to H.R. 2646 for Representative Farms

3
With the exception of beef and dairy, 1999 commodity prices came in substantially lower than historical averages. Prices of the 5 major crops are all expected to average below the loan rate for the 2000 marketing year. Assuming normal yields, only a modest recovery is anticipated for the 2000-02 period. Soybean prices are expected to average below the 1999 level in the 2000-02 period. Loan rates will continue to play a significant role in a producer's income. Strengthening is expected in beef and pork prices as beef production falls and pork levels off. 1981-851986-901991-951996-98 19992000-02 Wheat, per Bu$3.42$3.01$3.50$3.44 $2.48$2.82 Corn, per Bu$2.62$2.12$2.49$2.36 $1.82$2.00 Soybeans, per Bu$6.10$5.90$5.95$6.28 $4.63$4.61 Cotton, per Lb$0.59$0.60$0.64$0.65 $0.45 Rice, per Cwt$8.02$6.39$7.48$9.50 $6.11$6.21 Sorghum, per Bu.$2.34$1.91$2.35$1.91 $1.57$1.83 NE Steers, per Cwt$63.99$69.83$72.20$64.28 $65.56 $73.38 B&G, per Cwt$51.21$51.97$46.29$48.52 $34.00 $39.95 All Milk, per Cwt$13.44$12.91$12.80$14.51 $14.38 $12.22 U.S. Commodity Prices – January 2001 FAPRI Baseline

4
January Baseline 2001 Summary of Overall Economic Viability for Representative Crop, Dairy, and Livestock Farms 2001-2005

5
H.R. 2646 Provisions Continue marketing loan program and extend to peanuts Continue AMTA program and extend to soybeans and peanuts Create Counter Cyclical Payment (CCP) for all “program” crops
 for all program crops.")
6
H.R. 2646 Permits Base Re-Alignment Base acres for fixed payments and CCPs –Current base or –Average planted acres 1998-2001 Farm Program Yields remain frozen at 1985 levels Soybeans and Peanuts receive FPY based on comparable AMTA yields in area – historical yields 1976-1984

7
Loan Rates, Fixed Payment Rates and Target Prices Under H.R. 2646 Loan RateFixed Rate AMTA Target Prices Cotton ($/lb.)0.59120.06670.736 Rice ($/cwt.)6.502.3510.82 Peanuts ($/ton)35036480 Corn ($/bu.)1.890.302.78 Wheat ($/bu.)2.580.534.04 Sorghum ($/bu.)1.890.362.64 Soybeans ($/bu.)4.920.425.86
 Rice ($/cwt.) Peanuts ($/ton) Corn ($/bu.) Wheat ($/bu.) Sorghum ($/bu.) Soybeans ($/bu.)")
8
General Assumptions for Analysis Analysis incorporates the provisions that address loan rates and direct payments for grains, cotton and oilseeds (excluding peanuts) as well as an increase in the CRP enrollment cap. The analysis does not include any proposed changes to other conservation programs, other crops, dairy, trade programs, research, nutrition, and rural development.

9
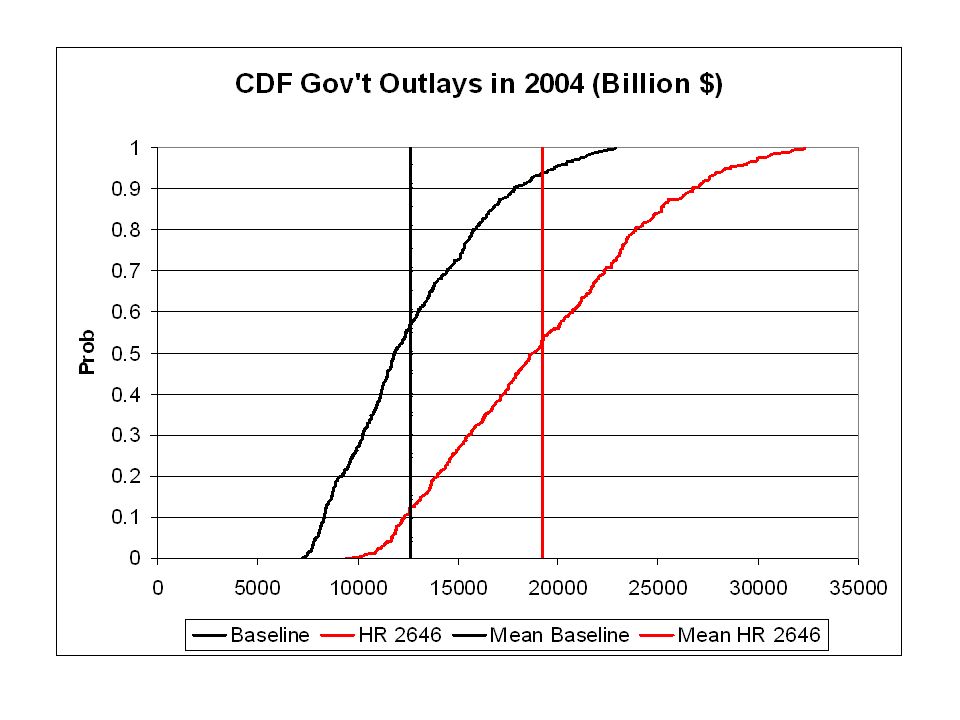
FAPRI’s Analysis Impacts on Net Farm Income H.R. 2646 increases farm income by an average of $4.5 billion above baseline levels. For 2003-10, farm income under H.R. 2646 averages $47.9 billion. By comparison, farm income over the 1996- 00 period average $47.4 billion.

10
FAPRI’s Analysis Impacts on Production & Price Marginal increases in grain and cotton area with oilseed area declining from baseline levels. Total planted area increases by less than 1%. Changes in crop prices reflect shifts in acreage –Grain prices fall by 2-4 cents/bu –Soybean prices rise by 4 cents/bu –Cotton prices fall by less than 1 cent/lb

12
Farm Level

13
Representative Farm Assumptions 44 Farms Analyzed under risk 2000-2006 –13 Feed grains/oilseeds –10 Wheat –11 Cotton –10 Rice 20% term and 100% operating debt 2000 Base acreage chosen to maximize benefit MPCI 50/100 Baseline – 1996 FAIR ACT continued through 2006 –Does not include MLA for 2001 Provisions of H.R.2646 plus the 2001 MLA Payment Limits assumed nonrestrictive

14
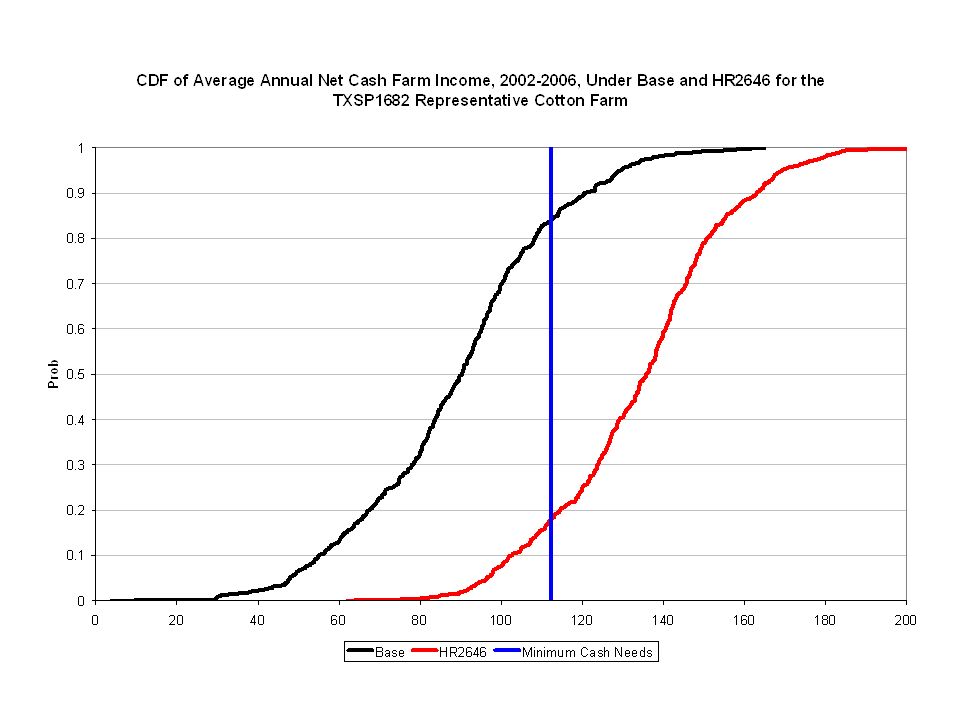
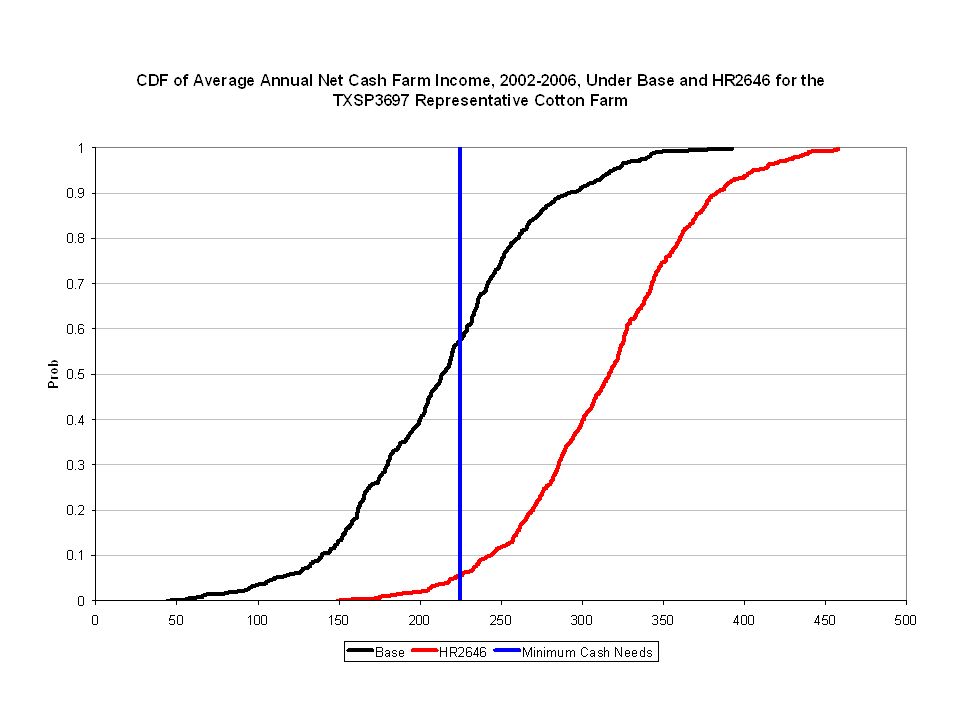
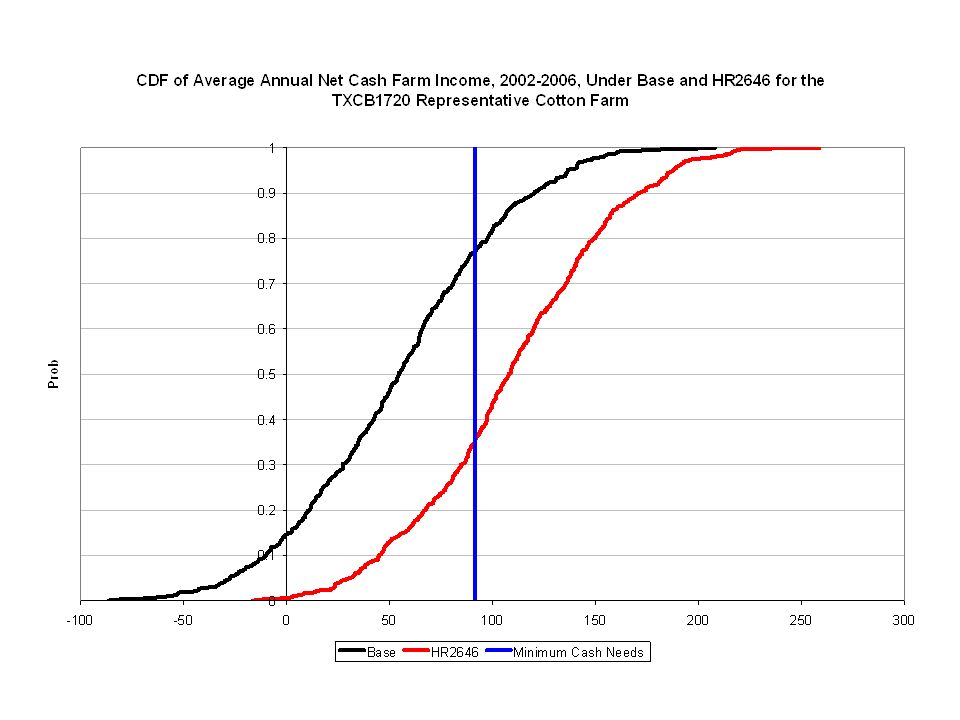
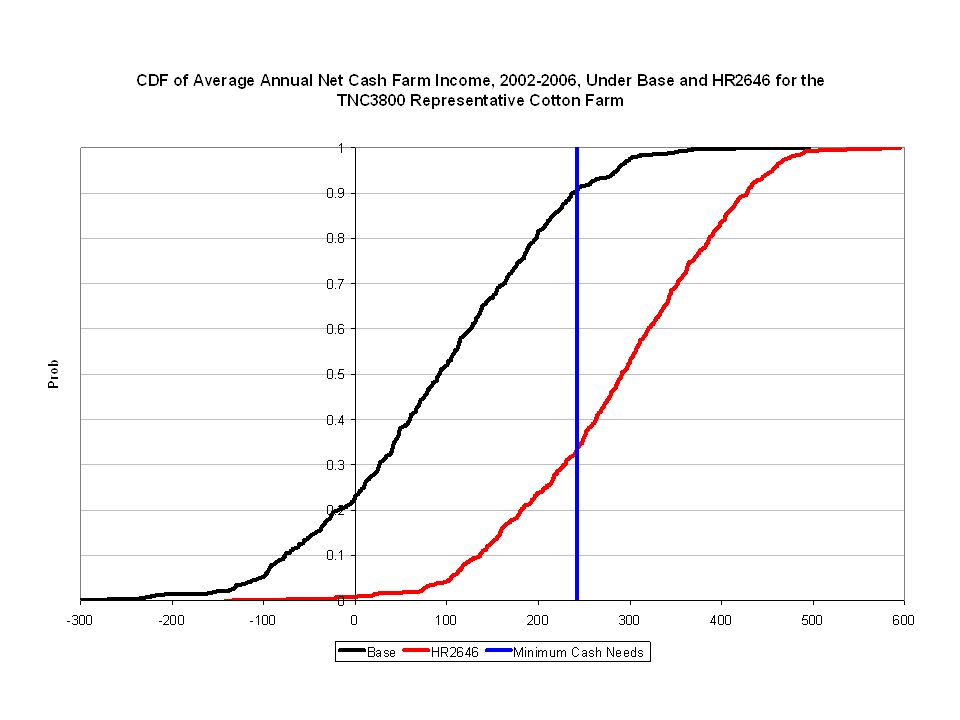
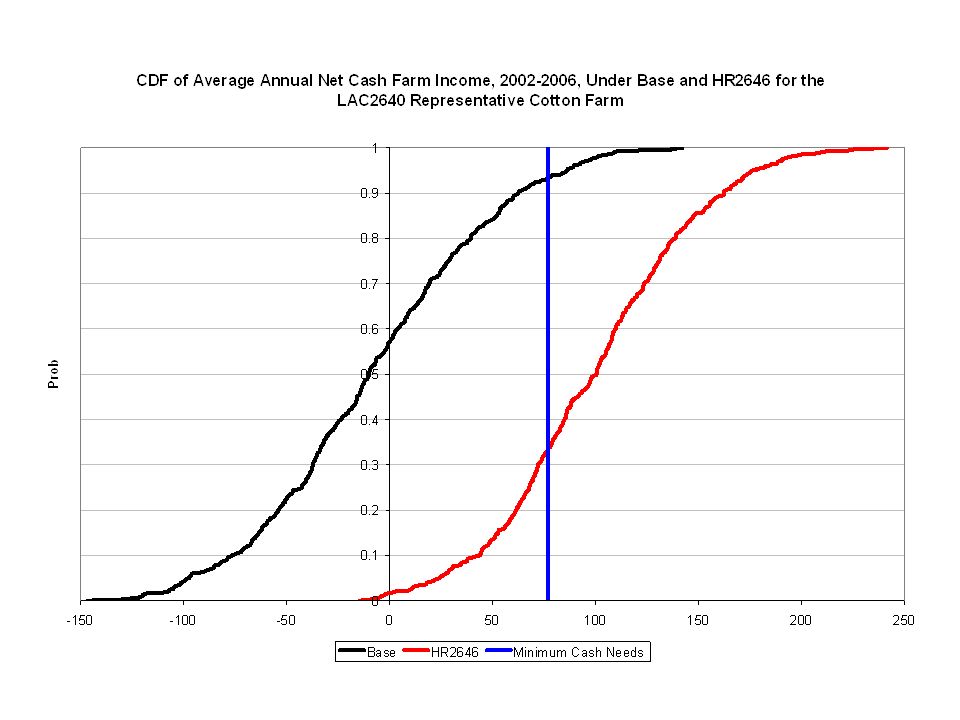
Comparison of the H.R. 2646 Farm Bill to a Continuation of the 1996 Farm Bill for Representative Cotton Farms, 2002 - 2006 Change in Net Cash Farm Income % Change in Net Cash Farm Income Change in Probability of a Deficit Change in Probability of Decreasing Net Worth ($1,000)(% Points) Cotton TXSP3697 9344.7%-19-5 TXSP1682 4046.0%-30-26 TXRP2500 48434.2%-8-32 TXBC1400 3079.8%-44-90 TXCB1720 5094.8%-22-46 CAC2000 160226.5%-6-72 CAC6000 29429.5%-2-14 TNC1675 521185.5%-29 TNC3800 173242.8%-39-79 ALC3000 14381.5%-19-47 LAC2640 96940.5%-42-53
(% Points) Cotton TXSP %-19-5 TXSP % TXRP %-8-32 TXBC % TXCB % CAC %-6-72 CAC %-2-14 TNC %-29 TNC % ALC % LAC %")
25
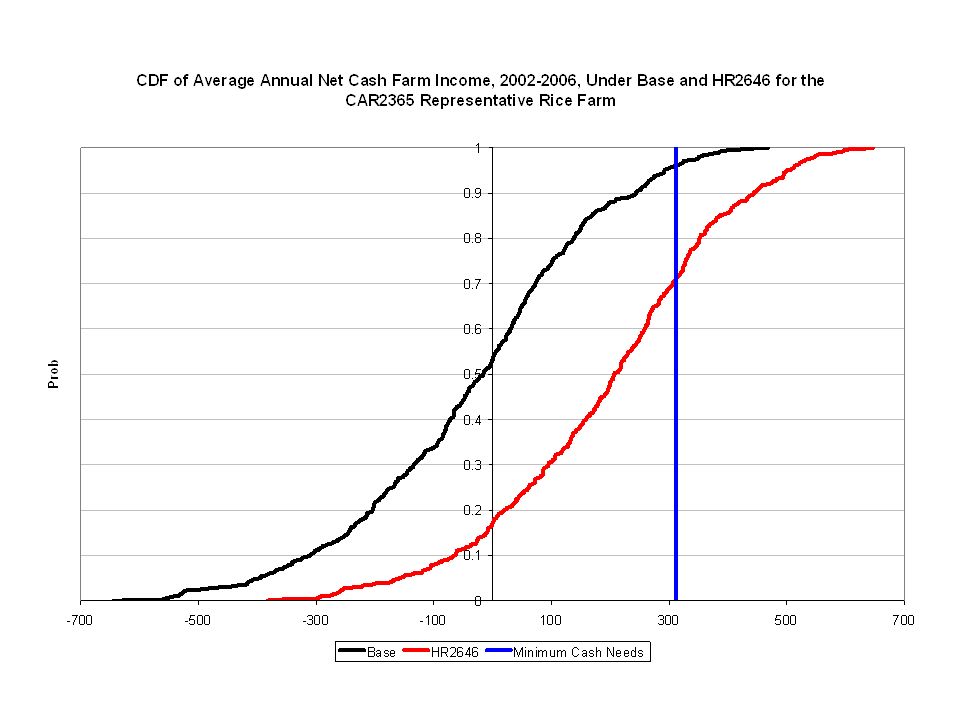
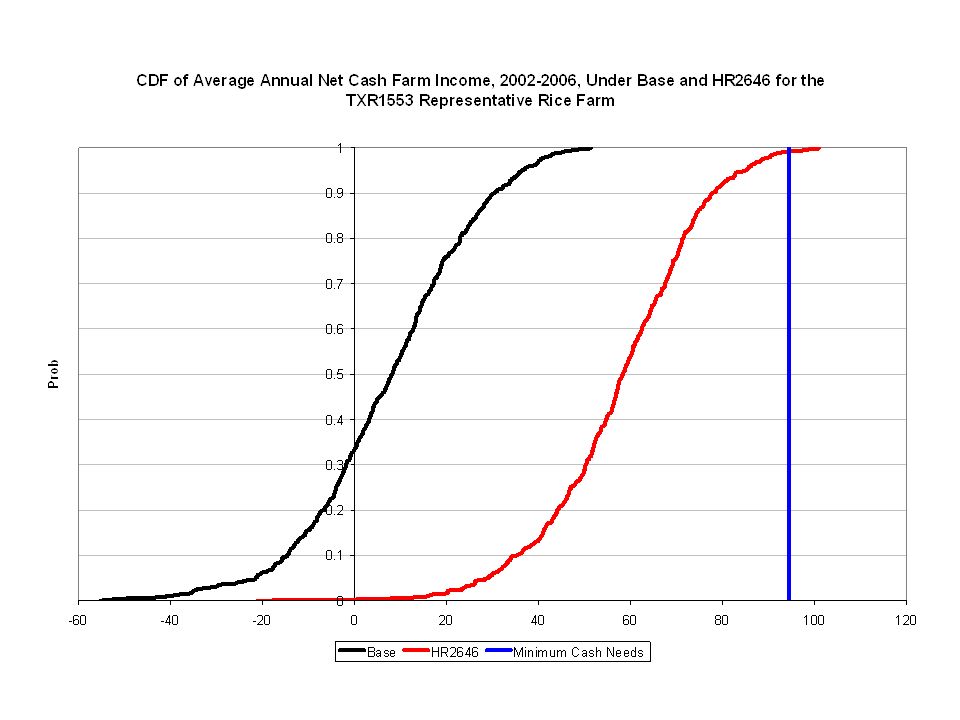
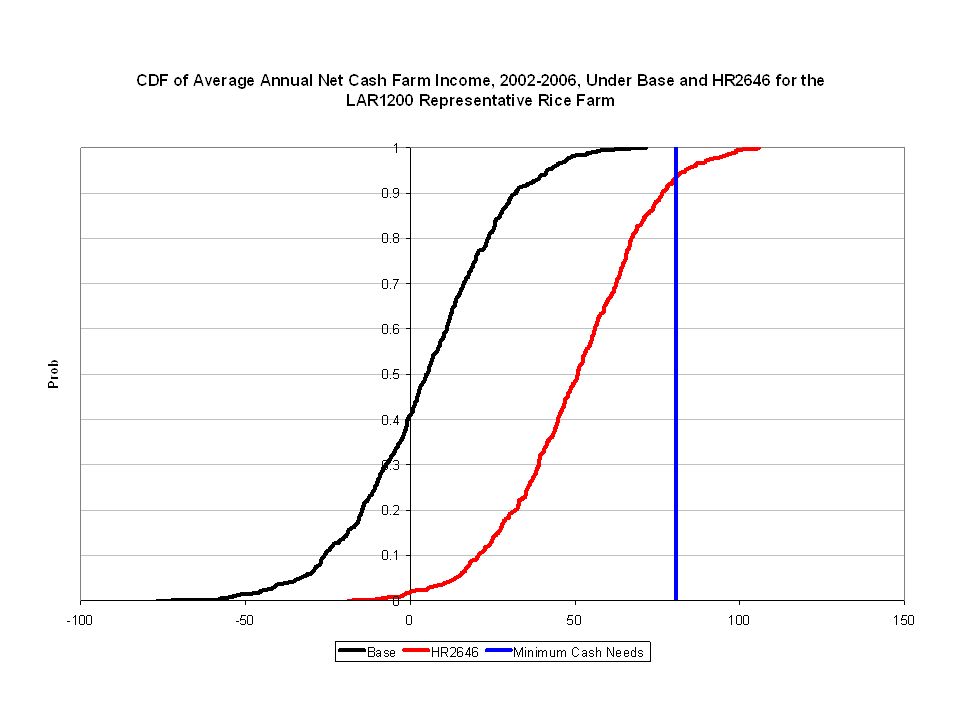
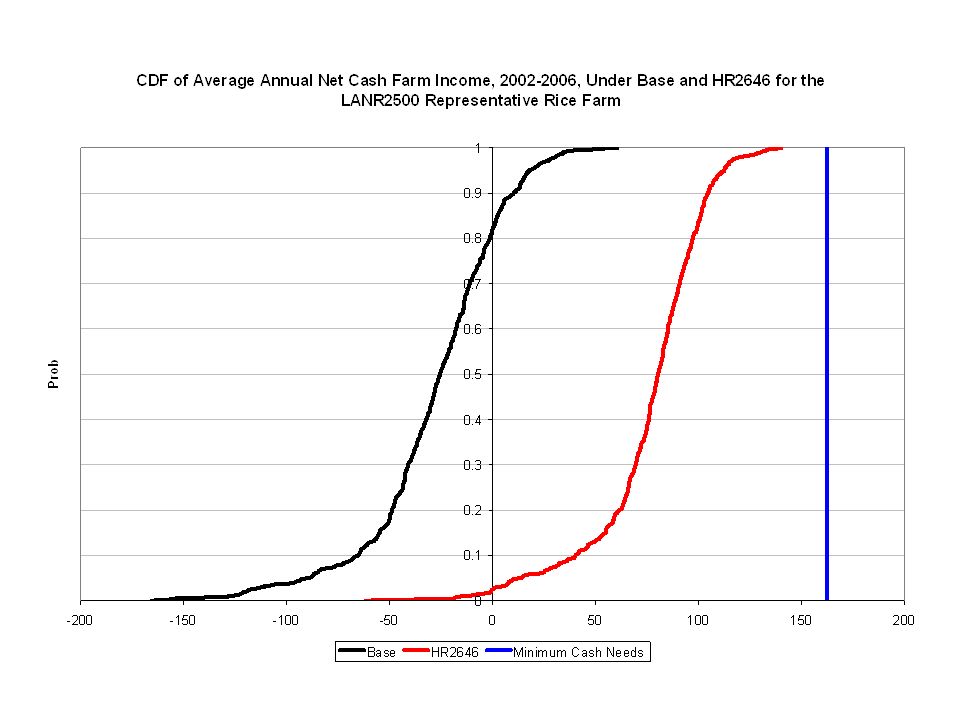
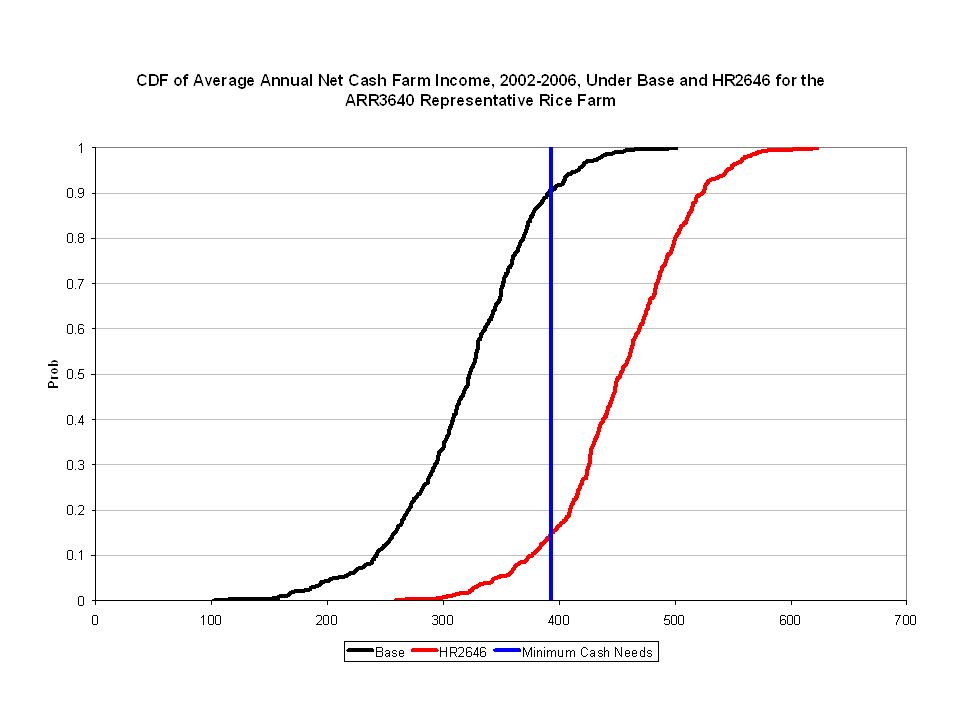
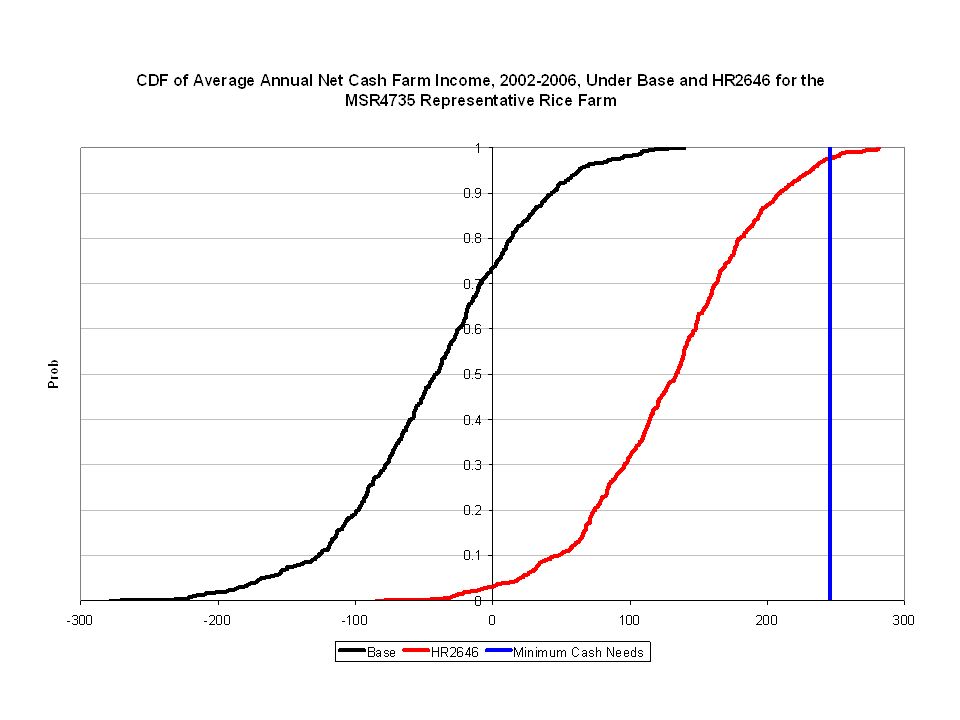
Comparison of the H.R. 2646 Farm Bill to a Continuation of the 1996 Farm Bill for Representative Rice Farms, 2002 - 2006 Change in Net Cash Farm Income % Change in Net Cash Farm Income Change in Probability of a Deficit Change in Probability of Decreasing Net Worth ($1,000)(% Points) Rice CAR424 431475.3%-3-20 CAR2365 2351020.0%-19-32 TXR1553 52569.1%00 TXR3774 105109.0%-16-59 LANR2500 101405.6%0-5 LAR1200 44744.7%-2-10 MOWR4000 17893.0%-11-54 MOER4000 14752.3%-37-78 MSR4735 164407.4%0-14 ARR3640 13142.5%-26-41
(% Points) Rice CAR %-3-20 CAR % TXR %00 TXR % LANR %0-5 LAR %-2-10 MOWR % MOER % MSR %0-14 ARR %")
35
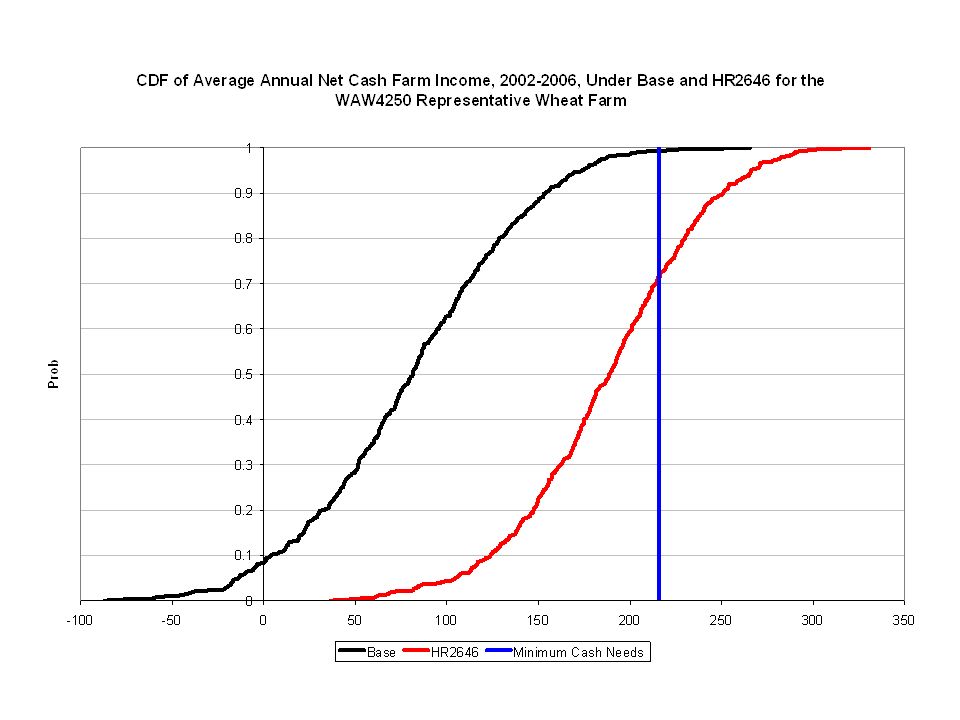
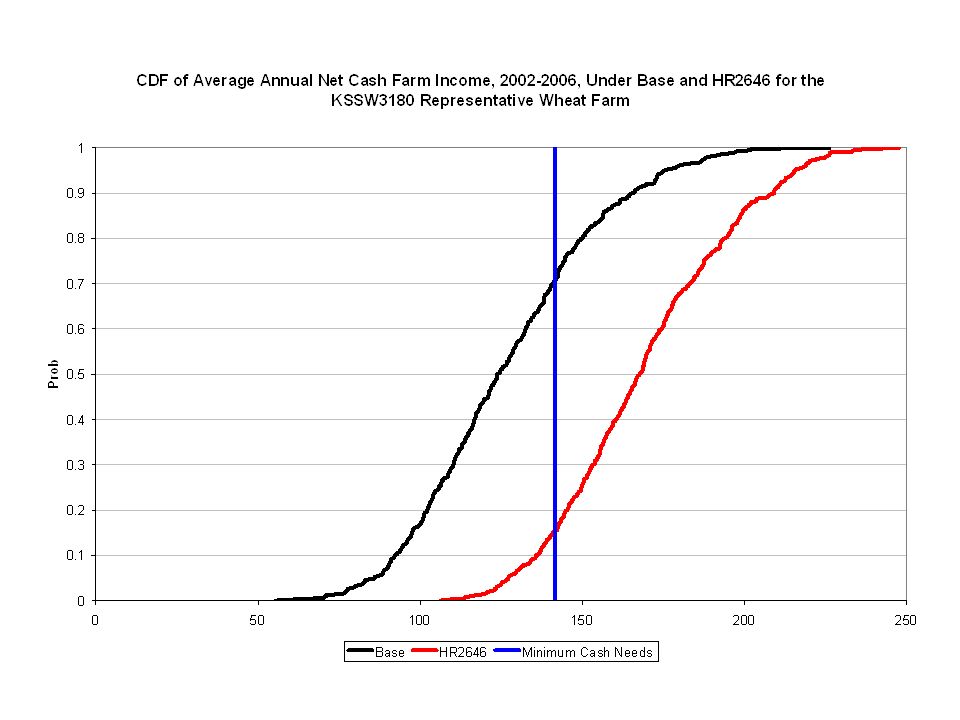
Comparison of the H.R. 2646 Farm Bill to a Continuation of the 1996 Farm Bill for Representative Wheat Farms, 2002 - 2006 Change in Net Cash Farm Income % Change in Net Cash Farm Income Change in Probability of a Deficit Change in Probability of Decreasing Net Worth ($1,000)(% Points) Wheat COW5440 3622.0%-12-4 COW2700 2028.0%-21-2 KSNW4300 571623.6%0 KSNW2325 26255.5%0-2 KSSW1385 2156.7%-11-67 KSSW3180 4133.7%-22-18 NDW4850 6239.1%-27-30 NDW1760 1129.9%-10-21 WAW1500 35598.6%0-6 WAW4250 98109.1%-11-83
(% Points) Wheat COW %-12-4 COW %-21-2 KSNW %0 KSNW %0-2 KSSW % KSSW % NDW % NDW % WAW %0-6 WAW %")
39
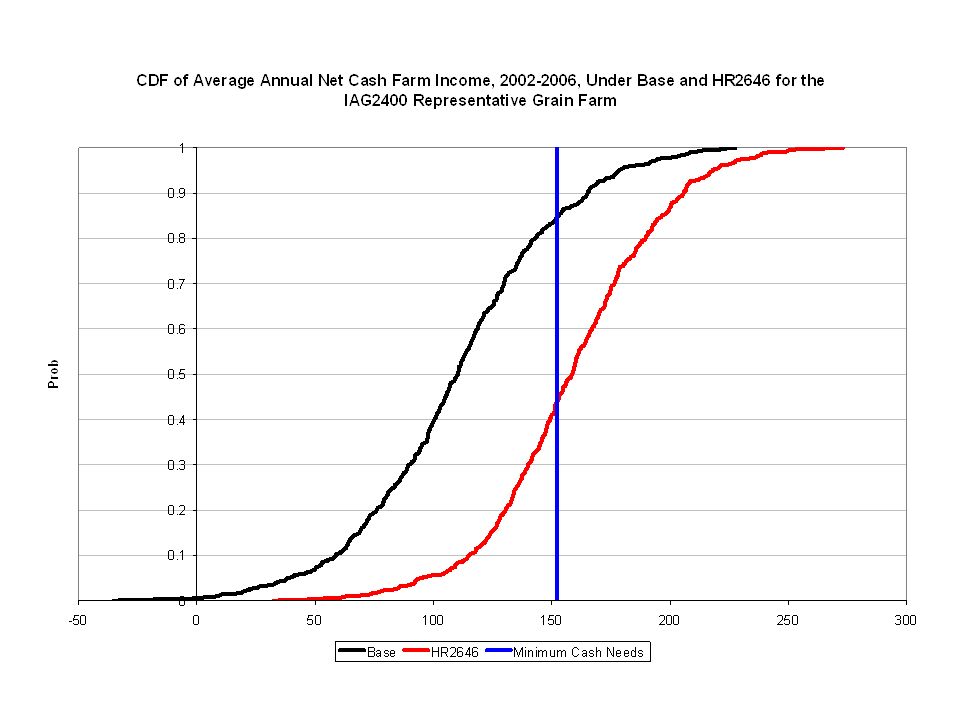
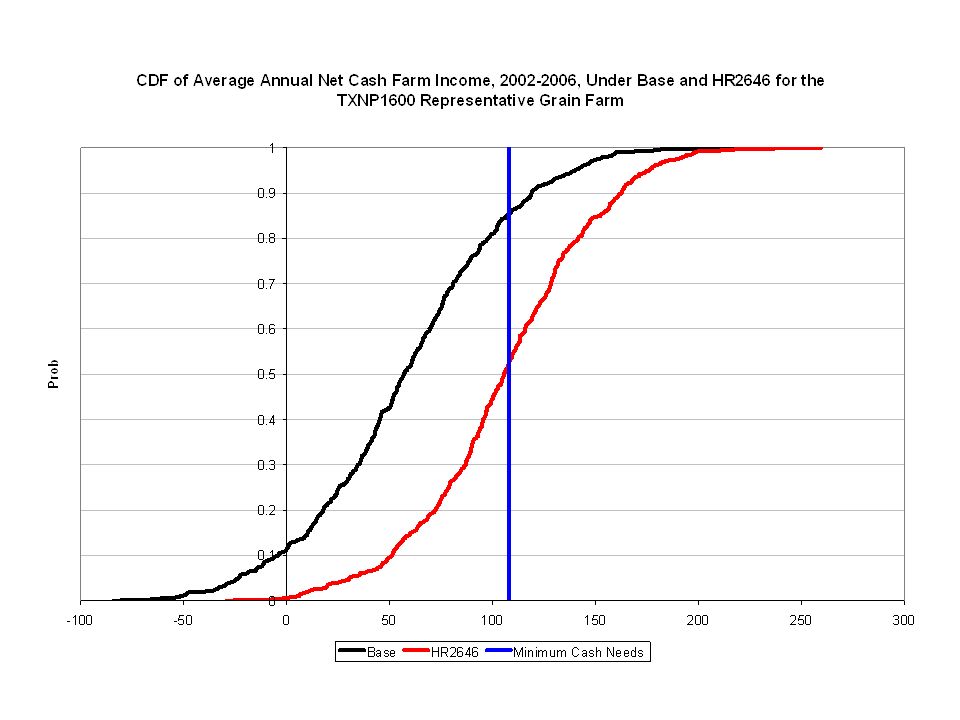
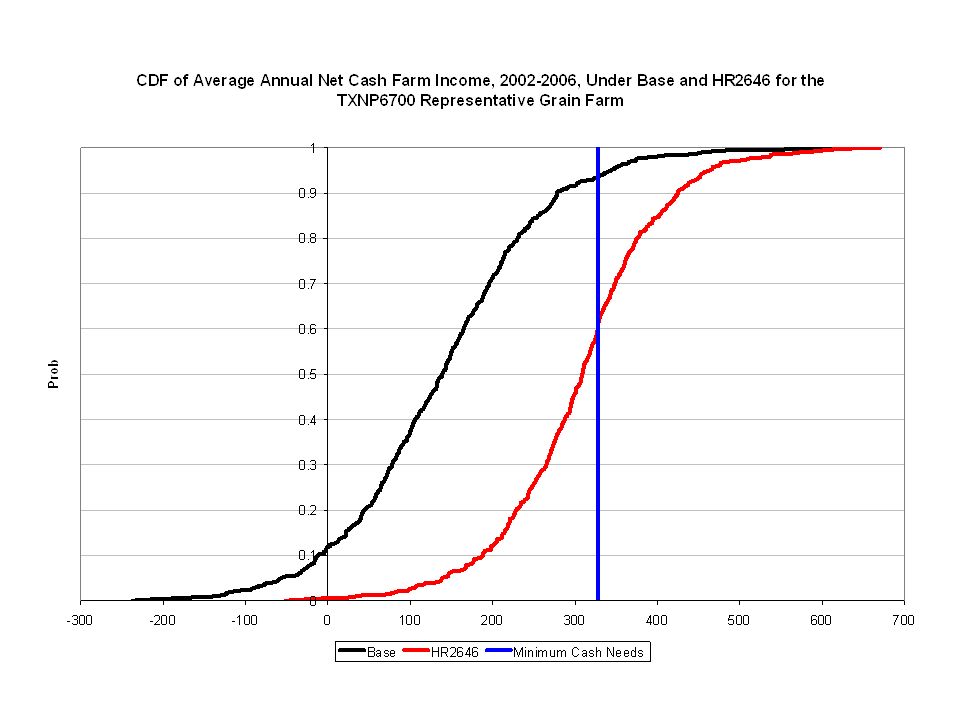
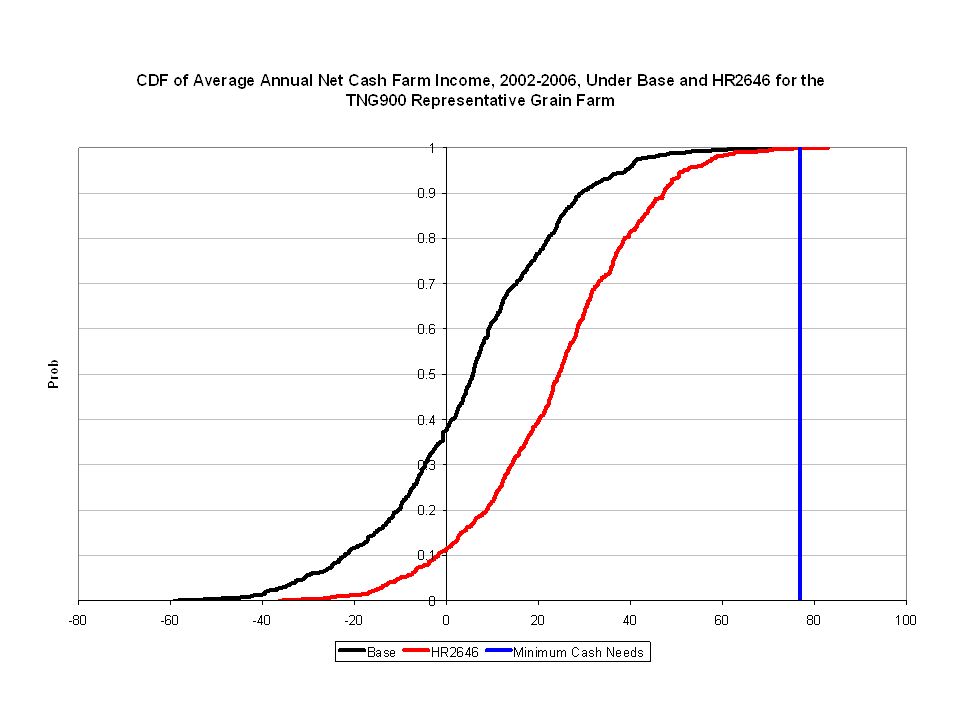
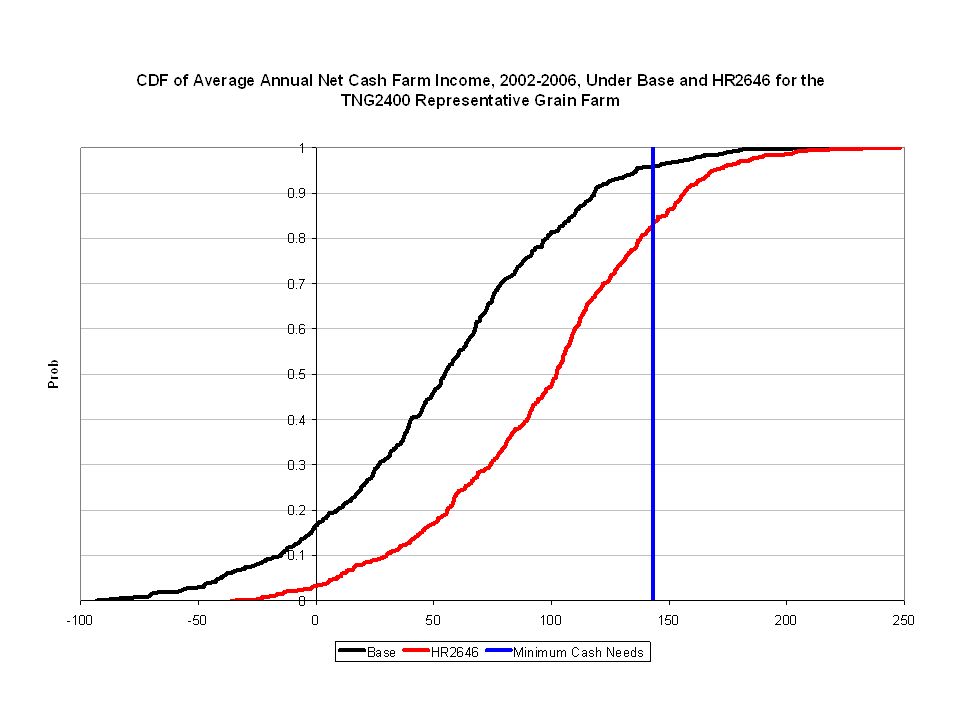
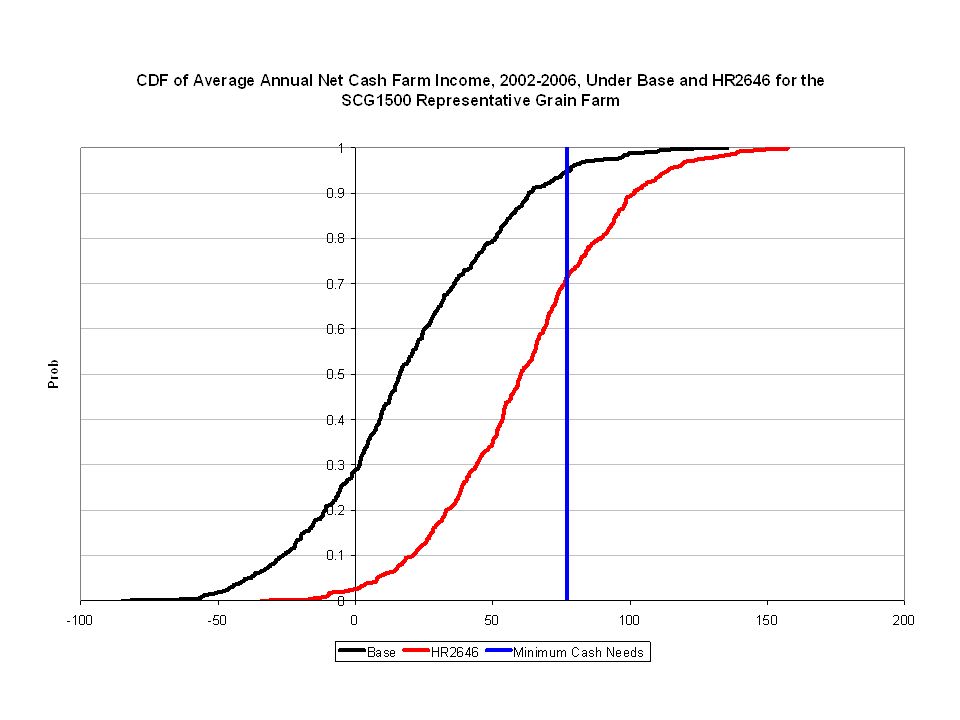
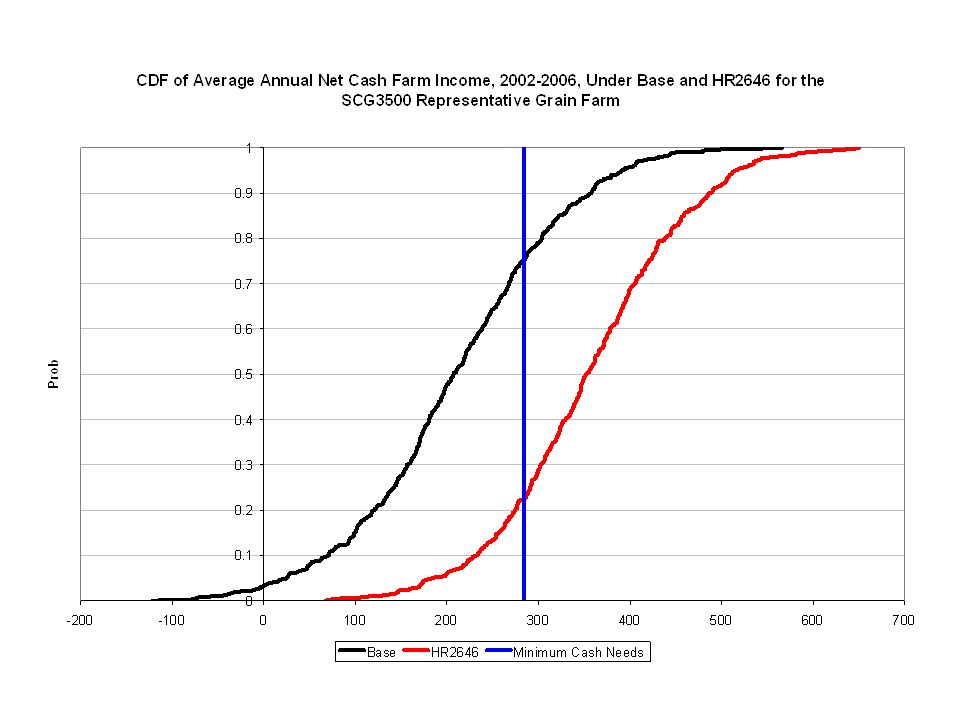
Comparison of the H.R. 2646 Farm Bill to a Continuation of the 1996 Farm Bill for Representative Feed Grain Farms, 2002 - 2006 Change in Net Cash Farm Income % Change in Net Cash Farm Income Change in Probability of a Deficit Change in Probability of Decreasing Net Worth ($1,000)(% Points) Feed Grain Farms TXNP16004480.6%-25-40 TXNP6700156127.2%-22-57 MOCG33004423.8%-21-35 MOCG17003229.7%-18-32 MONG140021169.4%0-13 IAG9502134.7%-20-55 IAG24004643.4%-36-33 NEG9003535.7%-31-17 NEG13004231.7%-21-27 TNG90016252.0%0 TNG24004180.1%-80 SCG150039255.0%-7-49 SCG350013167.8%-35-28
(% Points) Feed Grain Farms TXNP % TXNP % MOCG % MOCG % MONG %0-13 IAG % IAG % NEG % NEG % TNG %0 TNG %-80 SCG %-7-49 SCG %")
47
Summary 13 of 44 crop farms retained current Base acres while 31 farms changed Base to their 1998-2001 average planted acres All crop farms benefit from H.R. 2646 Farm Program, relative to continuing the 1996 Farm Bill –Higher net cash farm incomes (44 of 44) –Lower probability of cash flow deficits (37 of 44) –Lower probability of decreasing net worth (40 of 44)
 –Lower probability of cash flow deficits (37 of 44) –Lower probability of decreasing net worth (40 of 44).")
48
http://www.afpc.tamu.edu
Similar presentations


 Also referred to Freedom to Farm Developed by: Joe L. Outlaw.>")


 Data Have Been Used by AFPC Dr. James W. Richardson Co-Director Agricultural and Food Policy Center.>")


