Download presentation
Presentation is loading. Please wait.

1
E-Science, the GRID and Statistical Modelling in Social Research Rob Crouchley Collaboratory for Quantitative e-Social Science University of Lancaster

2
Contents The Problem/Motivation: Some Background on Statistical Methods and Social Research; A Solution to part of the Problem? GRID Enabling the Analysis of Multiprocess Random Effect Response Data Questions.

3
Part 1. Some Background on Statistical Methods and Social Research
Some Features of Social Science Research Complications A computationally demanding example Sabre and Stata/MP

4
Some Features of Quantitative Social Science Research
We often want to develop evidence based substantive theory. We want to know “what determines what”, e.g. long term unemployment and social exclusion And we want to explore the consequences of policy changes on individual behaviour, e.g. encouragement to stay on at school on educational attainment, truancy, and social exclusion Our data sets are often very small (<10GB) Our data sets are small relative to those that can occur in particle physics In physics they now measure data in PetaBytes (a PetaByte is equivalent to the data in a pile of CDs (not in their cases) of over 2.3 km high). Social science data sets are currently often less than 8 GB (13 CDs=1.82 cm) though there may be exceptions, e.g. in geographical databases. Social science data sets may be small but they are very complex =>one of the justification for e-Science
 Our data sets are small relative to those that can occur in particle physics. In physics they now measure data in PetaBytes (a PetaByte is equivalent to the data in a pile of CDs (not in their cases) of over 2.3 km high). Social science data sets are currently often less than 8 GB (13 CDs=1.82 cm) though there may be exceptions, e.g. in geographical databases. Social science data sets may be small but they are very complex =>one of the justification for e-Science.")
5
Some of the Complexities of non experimental data
Cluster effects, random and fixed effects; Contextual effects; Measurement Error; Missing data, dropout and selection; Parametric Assumptions; Endogenous Effects;

6
Some of the Consequent Issues
Disentangling the contributions created by the different complexities for our results is computationally intensive; Results really change as our model becomes more comprehensive; e.g. direct effects change sign, other become NS; Problems of Large Scale Fixed Effects Analysis, sparse matrices; To tackle these complexities we could use GRID enabled tools, resources and services.

7
Social Science Research
Randomised experiments offer the most powerful tool to understand social processes, but outside of psychology, they are infeasible, unethical or inappropriate (e.g. for instance we can not allocate pupils to different levels of education); Social scientists must therefore rely on observational data from longitudinal and other surveys e.g. YCS, NCDS, BHPS, The analysis of non experimental data involves complications.. Our data sets are small relative to those that can occur in particle physics In physics they now measure data in PetaBytes (a PetaByte is equivalent to the data in a pile of CDs (not in their cases) of over 2.3 km high). Social science data sets are currently often less than 8 GB (13 CDs=1.82 cm) though there may be exceptions, e.g. in geographical databases. Social science data sets may be small but they are very complex =>one of the justification for e-Science
; Social scientists must therefore rely on observational data from longitudinal and other surveys e.g. YCS, NCDS, BHPS, The analysis of non experimental data involves complications.. Our data sets are small relative to those that can occur in particle physics. In physics they now measure data in PetaBytes (a PetaByte is equivalent to the data in a pile of CDs (not in their cases) of over 2.3 km high). Social science data sets are currently often less than 8 GB (13 CDs=1.82 cm) though there may be exceptions, e.g. in geographical databases. Social science data sets may be small but they are very complex =>one of the justification for e-Science.")
8
Complication 1. Cluster Effects (CE)
Most large scale surveys use multi-stage sample designs to obtain 'representative' samples; this procedure often creates cluster effects, e.g. BHPS (households), YCS (schools); Pupils in the same class are often more behaviourally alike than pupils in different classes (even in the same school) Cluster effects – like students in the same class People living in the same village
, YCS (schools); Pupils in the same class are often more behaviourally alike than pupils in different classes (even in the same school) Cluster effects – like students in the same class. People living in the same village.")
9
Complication 1. Cluster Effects (CE)
Procedures have been developed to model cluster effects by means of shared random effects - MLwiN, Stata (Gllamm), SAS, AML; The estimation of non-identity link (and non nested CE) models, e.g. probit, can be computationally demanding; Cluster effects – like students in the same class People living in the same village Endogenous – variation within the variable
, SAS, AML; The estimation of non-identity link (and non nested CE) models, e.g. probit, can be computationally demanding; Cluster effects – like students in the same class. People living in the same village. Endogenous – variation within the variable.")
10
Complication 2. Measurement Errors (ME)
In observational studies, it is rarely possible to measure all relevant covariates accurately, e.g. age, educational attainment; Ignoring ME can seriously mislead the quantification of the link between explanatory and response variables; ME in one covariate can bias the association between other covariates and the response variable, even if those other covariates are measured without error; Women lie about age Some people lie about their education attainment

11
Complication 2. Measurement Errors (ME)
Also, some important determinants of behaviour are either not measured (i.e. omitted) or are unmeasurable (e.g. motivation); Repeated measures and longitudinal data provide the opportunity to deal with ME in explanatory variables, this adds to the computational demands of the analysis. Repeated measure – like the BHPS were same households are questioned every year
 or are unmeasurable (e.g. motivation); Repeated measures and longitudinal data provide the opportunity to deal with ME in explanatory variables, this adds to the computational demands of the analysis. Repeated measure – like the BHPS were same households are questioned every year.")
12
Complication 3. Missing Data, Dropout and Selection
All of the major longitudinal data sets available to the British social science community, (e.g. YCS, BHPS and NCDS), contain missing data and dropout; Ignoring this could create bias in the model estimated on the data; We need to model, as realistically as possible, the process by which the observed subjects have been retained in the sample, otherwise we will not know how much bias is present in our results; Also, some sample designs create selection effects of their own, e.g. by using a subset of locations, or oversampling the poor; These add to the computational demands of the analysis.
, contain missing data and dropout; Ignoring this could create bias in the model estimated on the data; We need to model, as realistically as possible, the process by which the observed subjects have been retained in the sample, otherwise we will not know how much bias is present in our results; Also, some sample designs create selection effects of their own, e.g. by using a subset of locations, or oversampling the poor; These add to the computational demands of the analysis.")
13
Complication 4. Parametric Assumptions
Our statistical tools are assumption rich: Parametric linear predictors, Parametric link functions and error structures; What if the assumed parametric relationships do not hold? BUT - Nonparametric statistical models are computationally intensive. Our tools assume a lot: Follow normal (gaussian distribution), etc.
, etc.")
14
Complication 5. Endogenous effects
The curse of endogenous effects, everything seems to depend on everything else; We need multiprocess models (simultaneous equations) to disentangle this complexity, adds to computation; Truancy depends on family background, background depends on wage, wage depends on educational attainment, education attainment depends on truancy,…
 to disentangle this complexity, adds to computation; Truancy depends on family background, background depends on wage, wage depends on educational attainment, education attainment depends on truancy,…")
15
Disentangling complexity with existing tools: an example
This is the kind of example that got me interested in e-Science.

16
Disentangling complexity with existing tools: an example endogenous effects
The YCS is a multi-stage stratified clustered random sample of individuals ages 16-17; I use YCS6 which covers young people eligible to leave school in , who are then observed over the period.

17
Part-time work and truancy are potential determinants of educational attainment
A comprehensive model will allow us to disentangle the observable, direct, effects of truancy on educational attainment from any effects that arise from correlation in the errors (unobserved effects).
.")
18
Educational Attainment

19
Level of truancy

20
Part Time Work

21
Trivariate Ordered Probit Model (Path Diagram)
Independent Errors (ep, et, eq) Part-time work Educational Attainment Truancy
 Part-time. work. Educational. Attainment. Truancy.")
22
Independent Errors (ep, et, eq)
This model is quick (1-2 seconds) to estimate, 3 linear predictors: - Probit for PT work, - Ordered Probits for Truancy and Qualifications; We can use standard software, e.g. Stata.
 to estimate, 3 linear predictors: - Probit for PT work, - Ordered Probits for Truancy and. Qualifications; We can use standard software, e.g. Stata.")
23
Correlated Errors

24
Correlation Structure

25
Problems and Model Extensions
Cant use standard software to fit the model via MLE; I used NAG software library, it has special routines to evaluate high dimensional multivariate normal integrals; Even so, this Model can take 2-3 weeks to estimate on a P4, 3 linear predictors, 169 parameters, 8,496 trivariate integrals for each function evaluation; Results from this model are quite different to those estimated under independence; e.g. one direct effect changes sign, another becomes NS;

26
What is happening? Evaluating lots of 3 dimensional integrals in order to compute our likelihood functions is computationally demanding; We could: Try other methods for evaluating integrals such as Gibbs sampling and MCMC, Use approximations: Laplace expansions with many terms Pseudo and Quasi Likelihood Methods Estimate fixed effects versions of the models; Use Instruments for the endogenous covariates All can be computationally demanding, and each approach has its own problems;

27
If we want to go this way, what can we do?
Use parallel algorithms on the Grid Use faster Hardware, e.g. HPCx, (also part of the Grid) Both
 Both.")
28
In the education example I’ve assumed
Particular directions for the direct effects No Non Ignorable dropout in the YCS No School Cluster effects present MVN Error structure Linear predictor, additive function No measurement error in observed covariates We do not yet have the computational power (on the GRID) to relax all the assumptions simultaneously in this model.
 to relax all the assumptions simultaneously in this model.")
29
The Grid… some Definitions
"…is the Web on steroids." "…is distributed computing across multiple administrative domains" Dave Snelling, senior architect of UNICORE […provides] “flexible, secure, coordinated resource sharing among dynamic collections of individuals, institutions, and resource” From “The Anatomy of the Grid: Enabling Scalable Virtual Organizations” "…enables communities (“virtual organizations”) to share geographically distributed resources as they pursue common goals.."
 to share geographically distributed resources as they pursue common goals..")
30
SABRE – Software for the Analysis of Binary Recurrent Events
What is it ? Programme for analyising multivariate binary, ordinal, count and recurrent events data. Employs fast numerical algorithms. Uses Gaussian Quadrature and NPMLE for the REs Some typical application areas. Infertility in humans, animal husbandry. Voting, trade union membership, economic activity and migration. Absenteeism studies.

32
SABRE Why use it ? >6 months >1 week Data is administrative records covering the duration in employment in the workforce of a major Australian state government to investigate the determinants of quits and separations amongst permanent and temporary workers. NP base line hazard, quadrature for the REs

33
An Alternative: Stata/MP

34
What about SABRE and Stata/MP
Stata/MP is 1.7 times faster on 2 processors Stata/MP is 2.8 times faster on 4 processors Stata/MP is 4 times faster on 8 processors Sabre can have a bit faster speedup, but the big difference is probably the base from which Stata/MP starts. Using the previous example on our HPC we could have (in minutes)
")
35
An empirical analysis of vacancy duration using micro data from Lancashire Careers
Service over the period 1985–1992, NP base line hazard, quadrature for the REs

36
What have I said so far? That the estimation (via maximum likelihood) of some statistical models can be very computationally demanding and beyond what you can usefully do on your desktop.
 of some statistical models can be very computationally demanding and beyond what you can usefully do on your desktop.")
37
Ways of running Sabre on the GRID
Directly via the operating system, e.g. Globus Via a Portal, e.g. Science Gateway Via a desktop application, like the tip of an iceberg (I’m going to concentrate on this for the rest of the talk)
")
38
Using the Grid Via a Desktop Application
Separation of Client and Server Logic Why ? Implementation of Service Logic may change to allow for improved algorithms, models or scheduling policies and so on However, user interface stays the same!!

39
Using the Grid Via a Desktop Application
Take as an example: SABRE : Using GROWL : Grid Resources on a Workstation Library. 3 Integration of SABRE functionality into Statistics Software (R and Stata)
")
40
Solution - How Host Sabre as Secure Web Service Difficult to do !!
Service needs to be secure Service needs to be persistent Many services provided via a single host on a single port Multiple clients Difficult to do !! Above features easy to host by employing generic GROWL server – allows the developer to concentrate just the service logic (algorithms, scheduling etc)
")
41
Web services A software system designed to support interoperable machine-to-machine interaction over a network. It has an interface that is described in a machine-processable format such as WSDL. Other systems interact with the Web service in a manner prescribed by its interface using messages, which may be enclosed in a SOAP envelope, or follow a RESTful approach. These messages are typically conveyed using HTTP, and normally comprise XML in conjunction with other Web-related standards. Software applications written in various programming languages and running on various platforms can use web services to exchange data over computer networks like the Internet in a manner similar to inter-process communication on a single computer. This interoperability (for example, between Java and Python, or Microsoft Windows and Linux applications) is due to the use of open standards. OASIS and the W3C are the primary committees responsible for the architecture and standardization of web services.
 is due to the use of open standards. OASIS and the W3C are the primary committees responsible for the architecture and standardization of web services.")
42
Client Client Client Client First Tier Second Tier Configuration
GROWL Server Agent Agent Agent Agent This is like an iceberg, you only see the bits on top The 2nd and 3rd layers are completely hidden from the user. Client Stata or R or SPSS or word on the desktop. Third layer, Agent service factory, if the 4 client select different sevrices, depends on what the client requests Sabre on the NGS, Sabre on 16 process, sabre on the desktop, all controlled through a common interface. Growl server is publically available, no reason why a dept cant take a GROWL server to access all the PCs in their OFFice, not restricted to running on the GRID Third Tier Services

43
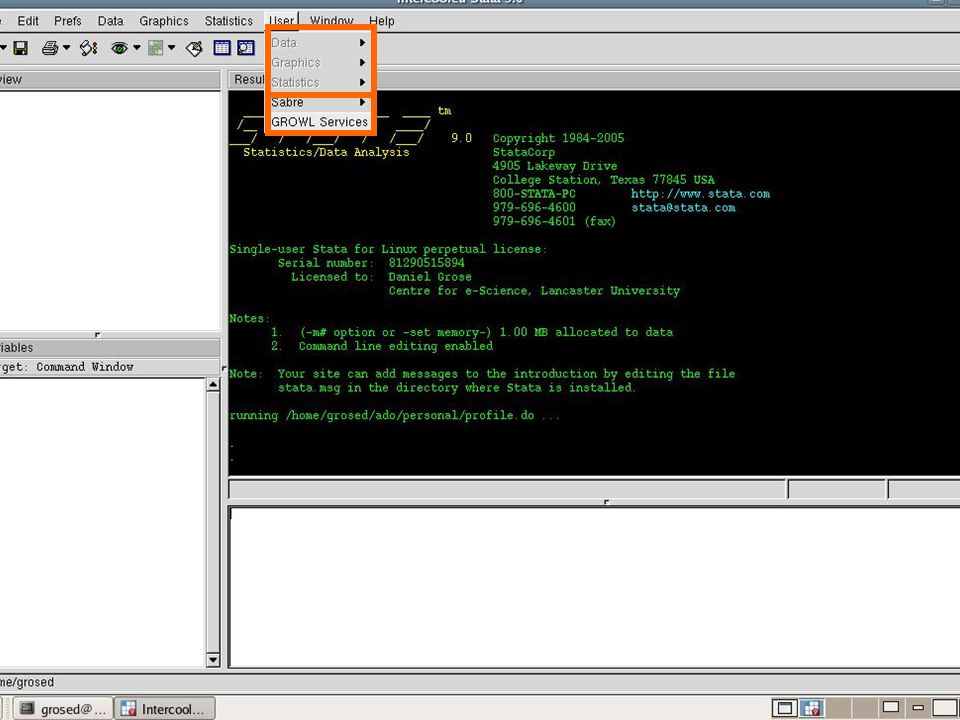
Example: Using Sabre on a GRID from Stata
User gets a Stata plugin (unzip it in the users ado directory) This adds some items to the Stata menus And provides a series of dialogue boxes
 This adds some items to the Stata menus. And provides a series of dialogue boxes.")
46
GROWL SERVICES Could contain lots of other software, e.g. MCMC software on the Grid Could use lots of different systems, NGS, NWG, etc

49
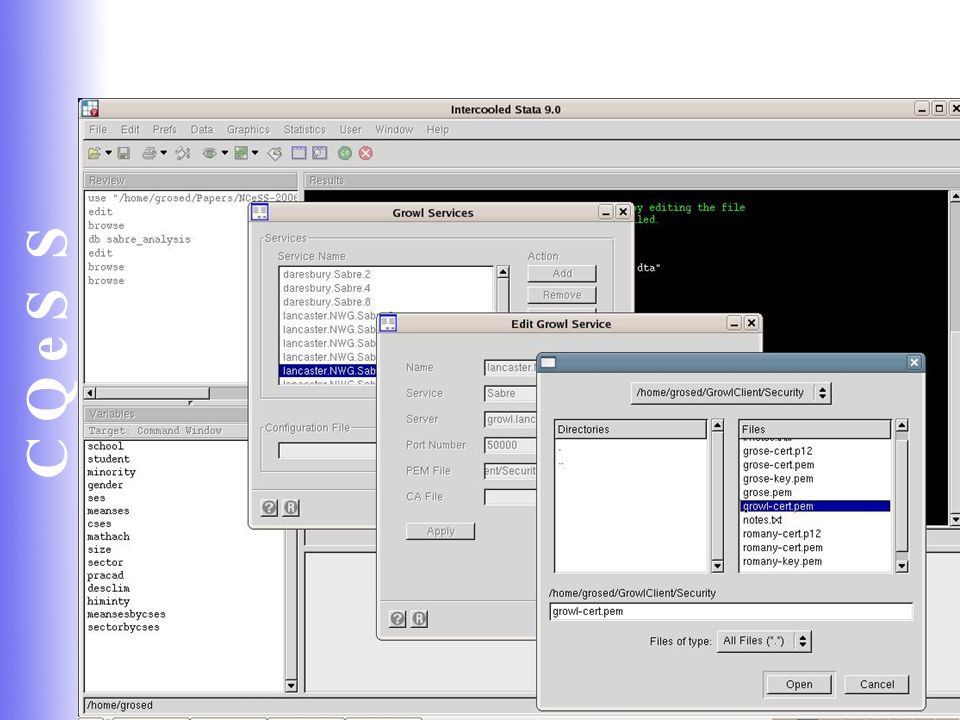
Integration

50
Integration

51
Integration

52
Integration

53
Authentication required for a Fit

54
SABRE – Availability and Support
Web Site Full Command Documentation Tutorials Example Data Publications Downloads “SabreR” binary R packages including documentation (end 06/2006) “SabreStata” Stata plugin including documentation (end 07/2006) Sabre source code
 SabreStata Stata plugin including documentation (end 07/2006) Sabre source code.")
55
What have I said in part 2 . There are beginning to be some tools that can make a lot more resources (Grid) available to you from within desktop applications.
 available to you from within desktop applications.")
56
Lancaster’s Statistical Software for e-Social Scientists
SABRE Software for the Analysis of Binary Recurrent Events Grid Resources On Workstation Library e-science. lancs.ac.uk/cqess/ SABRE SABRE is a program specifically designed for the analysis of binary, ordinal, count recurrent events as are common in many surveys. SABRE’s dedicated soft-ware ensures fast response times. SABRE + R Adding SABRE as a plug-in to R allows Sabre commands to be processed from the R user interface. Configuration of models and preparation of data is then undertaken using the extensive functionality of R SABRE+ R+GROWL Using GROWL Components, SABRE commands invoked in R are executed in parallel on the GRID, making SABRE an excellent e-Social Science tool. Application area’s Studies of voting behavior, trade union membership, economic activity and migration. Demographic surveys. Studies of infertility in humans. Animal husbandry. Absenteeism studies. Clustered sampling schemes. R Commander The familiar R interface is being maintained by using SABRE as a plug in Grid Resources on Work Stations GROWL employs a client/server architecture that hides the complexity of GRID middleware from the user. Client access to GROWL employs a secure (PKI/SSL) connection to a single port on the host system and clients are authenticated using the distinguished name extracted from their certificate. The use of a persistent server to access grid resources allows all of the service logic to be hosted by the server, making the client application, library or plugin extremely lightweight. Sabre was originally developed by Lancaster University’s Centre for Applied Statistics, further development and use cases have been funded by the EPSRC, and ESRC as part of the NCeSS CQeSS node Acknowledgements: Future developments Course material for the use of Sabre is currently being developed. It is planned to launch a Sabre/GROWL service on the North West Grid within the coming year. This will provide a utility based grid resource. Research into labour markets using Sabre/Growl. SABRE will become available as a plug in for STATA SABRE Specifications Mover stayer models, conventional logistic, logistic-normal and logistic-normal with end-points models to binary data. Ordered probit and logit random effect response models. Fits conventional log-linear, log-linear normal and log-linear normal with end-point models to count data. Substantial control is available over the parameters of the algorithm for the sophisticated user. Very long sequences of data. Multi-process data, where each response sequence is of a different type, limited to the simultaneous analysis of trivariate correlated sequences. Capable of running in a parallel computing environment Further information: sabre.lancs.ac.uk R Commander Sabre can be added as a library to R so that R is menu driven, rather than command driven. This makes R easier to use. Invoking a computational intensive and parallelised method on a Grid R Program OGSA client invoked as a method call Local O/S e.g. workstation OGS A Remote O/S, e.g. parallel computer Componentised Parallel Algorithm Middleware for e-Social Science Development of a parallel, multilevel, multi- process (OGSA) implementation of SABRE as an R object to enable the Social Scientists to disentangle the full stochastic complexity of socio-economic processes. SABRE and GROWL SABRE development GROWL provides a client-side lightweight library as a plug in to R, providing easy user friendly access to Grid resources and computational power, providing
 connection to a single port on the host system and clients are authenticated using the distinguished name extracted from their certificate. The use of a persistent server to access grid resources allows all of the service logic to be hosted by the server, making the client application, library or plugin extremely lightweight. Sabre was originally developed by Lancaster University’s Centre for Applied Statistics, further development and use cases have been funded by the EPSRC, and ESRC as part of the NCeSS CQeSS node. Acknowledgements: Future developments. Course material for the use of Sabre is currently being developed. It is planned to launch a Sabre/GROWL service on the North West Grid within the coming year. This will provide a utility based grid resource. Research into labour markets using Sabre/Growl. SABRE will become available as a plug in for STATA. SABRE Specifications. Mover stayer models, conventional logistic, logistic-normal and logistic-normal with end-points models to binary data. Ordered probit and logit random effect response models. Fits conventional log-linear, log-linear normal and log-linear normal with end-point models to count data. Substantial control is available over the parameters of the algorithm for the sophisticated user. Very long sequences of data. Multi-process data, where each response sequence is of a different type, limited to the simultaneous analysis of trivariate correlated sequences. Capable of running in a parallel computing environment. Further information: sabre.lancs.ac.uk. R Commander. Sabre can be added as a library to R so that R is menu driven, rather than command driven. This makes R easier to use. Invoking a computational intensive and parallelised method on a Grid. R Program. OGSA client invoked as a method call. Local O/S. e.g. workstation. OGS A. Remote O/S, e.g. parallel computer. Componentised Parallel Algorithm. Middleware for e-Social Science. Development of a parallel, multilevel, multi- process (OGSA) implementation of SABRE as an R object to enable the Social Scientists to disentangle the full stochastic complexity of socio-economic processes. SABRE and GROWL. SABRE development. GROWL provides a client-side lightweight library as a plug in to R, providing easy user friendly access to Grid resources and computational power, providing.")
57
You can watch a more detailed presentation about Growl by Dan Grose at the NCeSS conference on line at

58
Version on my PC Any Questions ?
C:\ laptopfiloes\CQeSS\Oxford RMF\imp\dan_grose_large Any Questions ?

Similar presentations