Download presentation
Presentation is loading. Please wait.

1
Year 5 Term 2 Unit 8 – Day 1

2
L.O.1 To be able to read and write whole numbers and know what each digit represents.

3
In your book write the value of each digit as it is pointed to.

4
Use the last answer you made to start each calculation and write the new answer in your book each time. 1. Add to 2. Add 300 3. Subtract 4. Add 6000 5. Subtract 4 6. Subtract 7. Add 700 8. Add 20

5
L.O.2 To be able to solve a problem by representing and interpreting data in tally charts and bar charts.

6
Q. Which number is most likely to turn up
Q. Which number is most likely to turn up when a normal 1 – 6 die is rolled? I will roll this die until I reach 20 or more and you will need to keep a record in your books of the running total. Before I begin you will need to predict and we will record how many times you think I will need to roll the die to reach my total.

7
Now we’ll try again. First we will record your predictions. And again!

8
Q. Is it possible to predict the number of rolls
Q. Is it possible to predict the number of rolls needed to get a total of 20 or more? Q. Suppose I put a number 3 on each face, could we predict how many rolls we would need to get a total of 20 or more? Q. How accurate would our prediction be? Why?

9
This time the target is 24 or more and there will
This time the target is 24 or more and there will be a normal 1 – 6 die. Q. What could be the greatest number of rolls needed to score 24 or more? What could the fewest number of rolls be? Work with a partner and conduct this experiment 10 times. Each time record the number of rolls you needed to reach 24 or more.

10
Q. Did anyone get a 24 in exactly 24 rolls or in exactly 4 rolls?
I want to collect the class results and put them on a chart. Q. How can we collect and display the class’ results? Would a tally chart or a bar chart be useful?

11
Work with the people on your table to
collect all your experiment results using tallies and counting the different numbers of rolls taken.

12
In order to collect the class’ results we are
going to write the results from each group in the middle column of OHT 8.1.then work out the totals.

13
FREQUENCY

14
REMEMBER… The total in the final column is called the Frequency of the number of rolls taken.

15
Q. Which number of rolls was the most frequent? Which was the least?
Answer these: Which frequencies occurred more than ¼ the time? Which occurred less than 1/3 the time? Which occurred exactly half the time? Which occurred twice as much as any others?

16
. OHT 8.1 can be turned round so the totals can be shown as a BAR CHART with the horizontal axis showing the NUMBER OF ROLLS and the vertical axis showing the FREQUENCIES

17
FREQUENCY LOOK ! NUMBER OF ROLLS

18
Q. If we are to draw this bar chart what scale
do we need on the vertical axis? When the scale has been decided you may each draw the bar chart on your squared paper.

19
By the end of the lesson the children should be able to:
Test a hypothesis from a simple experiment; Discuss a bar chart showing the frequency of the event; Discuss questions such as “Which number was rolled most often?”

20
Year 5 Term 2 Unit 8 – Day 2

21
L.O.1 To be able to order a set of positive and negative integers

22
Place the numbers in their correct position on the number line
Place the numbers in their correct position on the number line. – Volunteers! -20 20

23
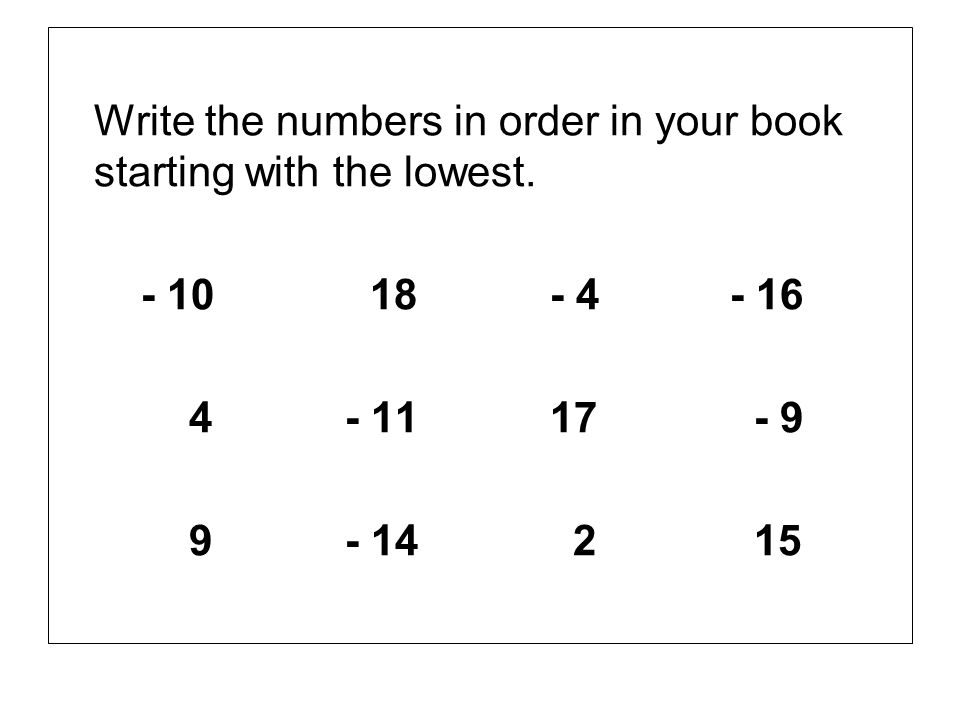
Write the numbers in order in your book starting with the lowest.
24
Now try these - starting with the lowest.

25
23 -19 18 -7 Prisms and spheres only.
Order these starting with the highest:

26
L.O.2 To be able to solve a problem by representing and interpreting data in bar line charts where intermediate points have no meaning, including those generated by a computer.

27
MOST LIKELY …. LEAST LIKELY ?
Yesterday we rolled dice to make 24 or more. Rolling 24 1’s to make 24 was VERY UNLIKELY. Which numbers of rolls of the dice appear to be MOST LIKELY …. LEAST LIKELY ?

28
We are going to do some more experiments using dice.
What is happening in this sequence of numbers? 2 , 3, (3) What is happening now? 2, 3, 5, 1 (4)
 What is happening now 2, 3, 5, 1 (4)")
29
Q. What is happening in these sequences?
3, 3, , 6, (5) 1, 2, , 2, (4) 3, 4, , , (5) 1, , (3) Q. What is the rule here?
 1, 2, 4, 2, (4) 3, 4, 5, 6, 3 (5) 1, 5, 1 (3) Q. What is the rule here")
30
The rule is to continue rolling until the number decreases, then stop.
Write down 3 sequences we might get when rolling a die and abiding by the rule. Q. What is the shortest sequence we could have? Q. What is the longest?

31
The shortest sequence we could have has only 2 terms e.g.
6, (2) 4, (2) The longest sequence of terms would have repeats e.g. 1, 1, 2, 2, 2, 2, 3, 3, 4, 5, (11) 1, 3, 3, 3, 3, 4, 4, 6, (9)
 4, 2 (2) The longest sequence of terms would have repeats e.g. 1, 1, 2, 2, 2, 2, 3, 3, 4, 5, 1 (11) 1, 3, 3, 3, 3, 4, 4, 6, 5 (9)")
32
I have read this in a book:
“more than half the time the sequences will have 4 or less terms.” (copy onto board) Q. Do you think this is true? ? Using your dice each of you is to generate 20 sequences using the stopping rule “when it decreases stop.” List your sequences and the number of terms in each.
 Q. Do you think this is true Using your dice each of you is to generate 20 sequences using the stopping rule when it decreases stop. List your sequences and the number of terms in each.")
33
In groups of 5 pool your results using
tallies for the number of terms. Q. What was the longest sequence of terms in your group? Q. Do the results in your group suggest that the statement on the board is true? Q. What table should we use to collect and display the results to the whole class?

34
Our table needs to cover the numbers from 2 to the largest number of terms
we have. The graph will be shown as a bar-line graph. Q. Will there be gaps between the lines?

35
Frequency / Number of Terms
2 3 4 5 6 7 8 9 10 11 12 13 14 15 16 17 18 19 20 21 22 23 Frequency

36
. Frequency Number of Terms
Number of Terms

38
On your squared paper draw the bar-line
On your squared paper draw the bar-line chart using the whole-class data set.

39
Q. Is this graph similar in shape to the bar chart you drew yesterday?
Q. How many data items are there in the grand total? Q. Were there 4 or less terms in our sequences in more than half our data items? Q. Is this more than half our data? Do we think the claim is true or false?

40
With a partner work out some statements about the behaviour of the sequences.
Be prepared to share your ideas.

41
By the end of the lesson the children should be able to:
Test a hypothesis about the frequency of an even number by collecting data quickly; Discuss a bar chart or bar line chart and check the prediction.

42
Year 5 Term 2 Unit 8 – Day 3

43
L.O.1 To be able to recognise which simple fractions are equivalent.

44
½ ¾ ¼ Q. Which figure is the NUMERATOR? Q. Which is the DENOMINATOR? Q. Are the fractions in order of size, smallest first?

45
½. Volunteers! The order should be : ¼ ½ ¾
We will list some fractions which are equal to ½. Volunteers! Q. Can you describe the relationship between the numerator and the denominator?

46
Here are some fractions equivalent to ½ :
2/4 8/ /6 4/8 9/18 5/ / /22 50/ / / / Q. If the numerator is 15 what must the denominator be to go with these equivalent fractions? What if the numerator is 42?

47
We will list some fractions which are equivalent to ¼. Volunteers!
Q. What is the relationship between the numerator and the denominator?

48
: Here the fraction is ¼. Here are some equivalent fractions:
¼ 2/8 4/16 20/80 5/20 3/12 7/ /24 9/ / / 27/ Q. If the numerator is 14 what must the denominator be to go with these equivalent fractions? What if the numerator was 27?

49
We will list some fractions which are equivalent to ¾.
One is 15/20. How does this work? Q. What is the relationship between the numerator and the denominator?

50
: Here the fraction is ¾ . Here are some equivalent fractions:
3/4 6/8 12/16 60/80 18/24 9/12 21/ /24 27/ / / 27/ Q. If the numerator is 21 what must the denominator be to go with these equivalent fractions? What if the numerator was 27?

51
L.O.2 To be able to solve a problem by representing and interpreting data in bar line charts where intermediate points may have meaning.

52
This table shows the temperature in °C of a surface
This table shows the temperature in °C of a surface exposed to the sun over a 24 hour period. Q. When was it hottest / coldest? Q. If we are going to put the data onto a graph which numbers should we put on the time axis and which on the temperature axis?

53
The time axis must be 0 to 24 and the temperature axis must be 0 to 60. Q. Which way round shall we place the graph paper? Q. Where should we place the first X on our record.

54
Is this a sensible way round?
60 55 50 45 40 35 30 25 20 15 10 5 Temperature in °C Time in hours Is this a sensible way round?

55
Is this more sensible? Temperature in °C 60 57 54 51 48 45 42 39 36 33
30 27 24 21 18 15 12 9 6 3 Is this more sensible? Time in hours

56
Let’s try this way Temperature in °C 60 57 54 51 48 45 42 39 36 33 30
27 24 21 18 15 12 9 6 3 Let’s try this way Time in hours

57
Q. What time of day were the 7th, 8th and 9th temperatures taken?
Complete your own graph. Q. Can you work out at what times of day the different temperatures were taken? Q. What time of day were the 7th, 8th and 9th temperatures taken? What about the 19th, 20th and 21st? Q. How could we estimate the temperature at 3.5 hours? Q. Are there values in the spaces between the X ‘s ?

58
Use a ruler to join the points you have plotted.
If we had more detailed measurements would the points make a smoother curve?

59
REMEMBER… Time and temperature are MEASURES
and not COUNTS or FREQUENCIES so the intermediate points have meaning and we can join the X ‘s and use them to answer different questions. Q. For how long was the temperature greater than 40°C? Less than 20°C? Work out some questions about your graph for your partner to answer. Prisms – 10; Spheres – 8; Tetrahedra – 5.

60
Here is another set of measurements collected over the same 24 hours
Here is another set of measurements collected over the same 24 hours. These show the intensity of the light and are measured in lux. Q. Why are there 0’s for hours 8 to 12? Q. When was the light strongest?

61
There are 0’s for hours 8 to 12 because
There are 0’s for hours 8 to 12 because there was no light so it must have been night time. The light was strongest at hour 21 – this must have been close to midday.

62
By the end of the lesson the children should be able to:
Draw and interpret a line graph; Understand that intermediate points may or may not have meaning.

63
Year 5 Term 2 Unit 8 – Day 4

64
L.O.1 To be able to add or subtract any pair of 2-digit numbers

65
We are going to do this sum and record the strategies we use below.

66
One strategy is: 63

67
How could we add these? Write 3 different strategies in your book.

68
Do these neatly in your book using your preferred strategy.

69
We are going to do this sum and record the strategies we use below.

70
85 – 59 One strategy is: 85 – 29 85 – 25 + 1 26

71
How could we subtract these?
Write different strategies in your book.

72
6 Do these neatly in your book using your preferred strategy.
94 – – 49 41 – – 59 73 – – 69 55 – – 79

73
Now try these: 46 – – 11 57 – – 21 74 – – 31 95 – – 41

74
L.O.2 To be able to solve a problem by representing and interpreting data in bar line charts where intermediate points have meaning.

75
We are going to turn a straight line graph into a multiplication table.

76
We are going to turn a straight line graph into a multiplication table.
First we mark the end points 0,0 and 10,40 of our line

77
Then we join the ends with a line to make a straight line graph.

78
Q. Which times table does this represent?
How do you decide?

79
It is the 4 times table. Let’s say it all together. Numbers other than whole numbers can be multiplied by 4 !

80
What number is halfway between 2 and 3 ?
Is it 2.5? What is 2.5 x 4 ?

81
Write the answers to these:
2.5 x 4 = 3.5 x 4 = 4.5 x 4 = 5.5 x 4 = 6.5 x 4 = 7.5 x 4 = 8.5 x 4 = 9.5 x 4 =

82
Where is 3.2 on the horizontal axis?
How can we use the graph to find: x 4? If the graph was in cm. squares we could use a ruler to help us.

83
On your cm paper draw a graph of the
5x table. The horizontal axis will be 10cm and the vertical axis will be 25cm with each cm representing 2 units.

84
. Graph of the 5x table Q. How can we use the graph to find these?
50 48 46 44 42 40 38 36 34 32 30 28 26 24 22 20 18 16 14 12 10 8 6 4 2 Graph of the 5x table Let’s say it all together Q. How can we use the graph to find these? 4.5 x 5 3.6 x 5

85
. Write the answers to these: 1.4 x 5 = 2.5 x 5 = 4.8 x 5 = 6.6 x 5 =
50 48 46 44 42 40 38 36 34 32 30 28 26 24 22 20 18 16 14 12 10 8 6 4 2

86
. Graph of the 5x table Which other tables can we put on our graph?
50 48 46 44 42 40 38 36 34 32 30 28 26 24 22 20 18 16 14 12 10 8 6 4 2 Graph of the 5x table Which other tables can we put on our graph?

87
. We can draw these: 2x table 3x table and 4x table
50 48 46 44 42 40 38 36 34 32 30 28 26 24 22 20 18 16 14 12 10 8 6 4 2 We can draw these: 2x table 3x table and 4x table Put them on your graph using colours

88
. Use these graphs to find: 4.5 x 2 = 4.5 x 3 = 4.5 x 4 = 4.5 x 5 =
50 48 46 44 42 40 38 36 34 32 30 28 26 24 22 20 18 16 14 12 10 8 6 4 2 Use these graphs to find: 4.5 x 2 = 4.5 x 3 = 4.5 x 4 = 4.5 x 5 =

89
. Tetrahedras find 2.7 x 2 = 3.5 x 2 = 4.3 x 3 = 3.5 x 3 = 5.7 x 4 =
50 48 46 44 42 40 38 36 34 32 30 28 26 24 22 20 18 16 14 12 10 8 6 4 2 Tetrahedras find 3.5 x 2 = 3.5 x 3 = 3.5 x 4 = 3.5 x 5 = 5.5 x 2 = 6.3 x 3 = 7.5 x 4 = 9.2 x 5 = Spheres find 2.7 x 2 = 4.3 x 3 = 5.7 x 4 = 7.2 x 5 = Prisms find 3.9 x 2 = 8.1 x 3 = 4.7 x 4 = 5.9 x 5 =

90
Q. Which times table does this represent?
The multiplication by 10 gives 25. 10 x ? = 25 Q. What number x 10 gives 25?

91
2.5 x 10 = 25 Find estimates for 3 x 2.5 4 x 2.5 7 x 2.5 8 x 2.5
Which line would we need to draw to get estimates of multiplication by 3.8?

92
0,0 and 10,38 We would need a line whose coordinates are
Draw the line on your graphs Use the graph to find estimates for 5 x 3.8 3 x 3.8 7.5 x 3.8

93
What strategies did you use to obtain your estimates?
Did you use approximations e.g. 5 x 3.8 ~ 5 x 4.0 = 20 Exact answers are: 5 x 3.8 = 19.0 3 x 3.8 = 11.4 7.5 x 3.8 = 28.5 What are the limitations of the graph method?

94
By the end of the lesson the children should be able to:
Draw and interpret a line graph where intermediate points have meaning.

Similar presentations


 Grants Chapter 6.>")


