Download presentation
Presentation is loading. Please wait.

1
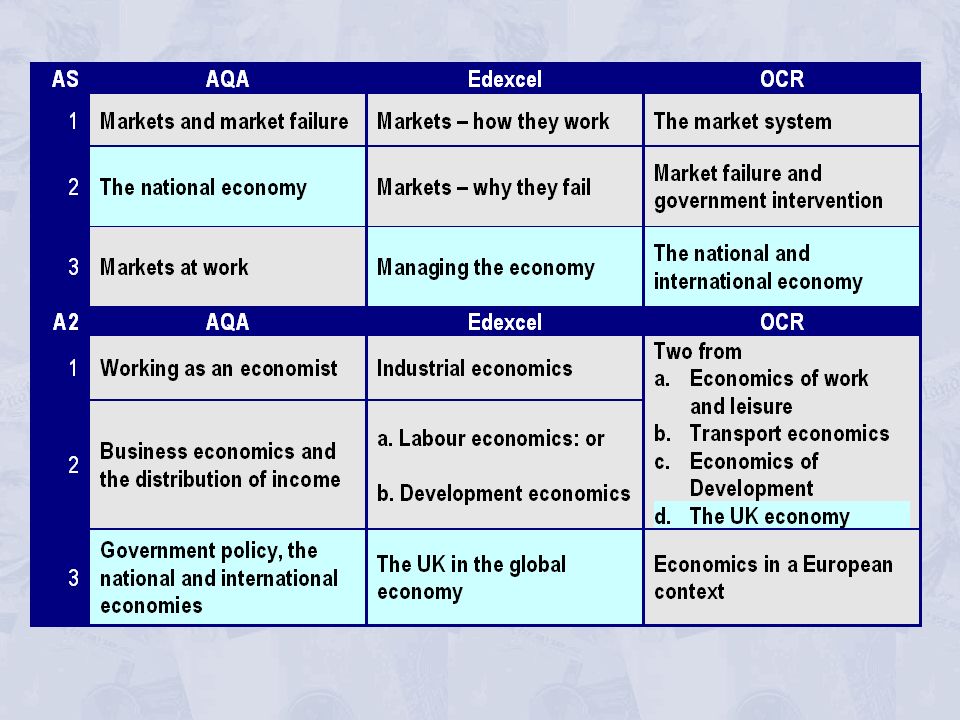
AS/A2 The national economy
The UK Economy: a Health Check How well has the economy been performing, and what’s round the corner?

3
The UK Economy Main macroeconomic objectives Important indicators
Long-term economic growth Stability Low inflation Low unemployment (Reduction in poverty and inequality) Important indicators Productivity Interest rates Exchange rates Balance of trade Public borrowing
 Important indicators. Productivity. Interest rates. Exchange rates. Balance of trade. Public borrowing.")
4
Macroeconomic Performance
Economic Growth and Fluctuations

5
Economic growth in the UK
Labour Conservative Annual growth rate (%)
")
6
Growth rates in selected industrial countries
UK USA EU12 Japan Annual growth rate (%)
")
7
Output gaps in the UK: 1980–2007 Source: based on data in Economic Outlook (OECD, various years)
")
8
Output gaps in selected countries: 1980–2007
Source: based on data in Economic Outlook (OECD, various years)
")
9
Macroeconomic Performance
Economic Growth and Fluctuations

10
Macroeconomic Performance
Long-term Economic Growth

11
UK GDP at market prices (2001 = 100)
Source: National Statistics time series data

12
Average annual growth rates 1997 to 2007
Source: based on data in OECD Economic Outlook (OECD)
")
13
Aggregate demand and aggregate supply
AD2 Aggregate demand and aggregate supply AS2 AS Price level P2 Y2 P1 AD O Y1 National output (real GDP)
")
14
Aggregate demand and aggregate supply
AD2 Aggregate demand and aggregate supply AS2 AS Price level P2 P1 Y3 AD O Y1 Y2 National output (real GDP)
")
15
The UK Economy How to increase aggregate supply? More resources
Investment Natural resources (e.g. oil) Labour (e.g. from migration or higher retirement age) Greater use of resources (e.g. longer working week) Greater productivity of resources Investment in R&D Greater incentives for efficiency
 Labour (e.g. from migration or higher retirement age) Greater use of resources (e.g. longer working week) Greater productivity of resources. Investment in R&D. Greater incentives for efficiency.")
16
Productivity in selected countries (UK = 100)
Source: Pre-Budget Report 2005 and 2006, Box 3.1, (H.M. Treasury)
")
17
International comparisons of Output per Worker (2005)
Source: Budget Report 2007, Box 3.1, (H.M. Treasury)
")
18
Gross fixed capital formation as a
percentage of GDP: 1960–2005 Source: based on data in OECD Economic Outlook (OECD)
")
19
Macroeconomic Performance
Long-term Economic Growth

20
Macroeconomic Performance
Inflation

21
Inflation rates in the UK
Annual growth rate (%)
")
22
Inflation rates in selected industrial countries
UK USA EU12 Japan Annual growth rate (%)
")
23
Average (CPI) inflation rates 1997 to 2007
Source: based on data in OECD Economic Outlook (OECD)
")
24
Macroeconomic Performance
Inflation

25
Macroeconomic Performance
Unemployment

26
UK unemployment rates Annual growth rate (%)
")
27
Unemployment rates in selected industrial countries
UK USA EU12 Japan Annual growth rate (%)
")
28
Average LFS unemployment rates 1997 to 2007
Source: based on data in OECD Economic Outlook (OECD)
")
29
Macroeconomic Performance
Unemployment

30
Macroeconomic Performance
Balance of Payments

31
Balance of payments on current account
Source: Budget Report 2007, Chart B7 (H. M. Treasury)
")
32
Macroeconomic Performance
Balance of Payments

33
Macroeconomic Performance
Policy rules

34
Policy rules Fiscal policy the Golden Rule
over the economic cycle, the Government will borrow only to invest and not to fund current spending the sustainable investment rule: net debt kept below 40 per cent of GDP over the economic cycle

35
Meeting the Golden Rule?
But: Public spending increasing more rapidly than Budget Forecast. Is public spending delivering value for money? Curb on real public spending growth from 4.8% over past 6 years to 2.7% next year and 2% thereafter. Source: Budget Report 2007, Chart 2.3 (H. M. Treasury)
")
36
Meeting the sustainable investment rule?
Public-Sector Net Debt as % of GDP Percentage of GDP Source: Public-sector Finances Databank, Table A8 (H. M. Treasury)
")
37
Policy rules Fiscal policy Monetary policy the Golden Rule
over the economic cycle, the Government will borrow only to invest and not to fund current spending the Sustainable Investment Rule: net debt kept below 40 per cent of GDP over the economic cycle Monetary policy Bank of England independence Inflation target: 2% CPI inflation (1%) in 24 months’ time
 in 24 months’ time.")
38
Inflation rates in the UK
Annual growth rate (%)
")
39
Current CPI inflation projection based on market interest rate expectations
Source: Inflation Report May 2007, Chart 5.3 (Bank of England)
")
40
Inflation performance and expectations
Source: Budget Report 2007, Box 3.1 (H.M. Treasury)
")
41
Inflation and Unemployment
75 80 76 74 77 Inflation (%) 79 81 90 71 73 82 78 89 72 70 91 85 69 84 65 88 68 83 62 87 66 97 95 92 86 61 64 67 98 06 94 05 96 63 01 02 93 00 99 60 04 03 Unemployment (%)
 Unemployment (%)")
42
The path of inflation and unemployment in the UK?
1975 1980 1990 1978 1972 1984 2006 1997 1967 1993

43
Macroeconomic Performance
Policy rules

44
Macroeconomic Performance
Trade-offs?

45
Average Inflation and Unemployment for G7 Countries (1997–2007)
USA Italy Canada UK France Germany Japan Source: based on data in OECD Economic Outlook (OECD)
")
46
Average Inflation and Economic Growth for G7 Countries (1997–2007)
Japan Germany France UK Canada Italy USA Source: based on data in OECD Economic Outlook (OECD)
")
47
Macroeconomic Performance
Trade-offs?

48
But are we getting happier?
Issues But are we getting happier?

49
Issues Is GDP a good measure? Does material gain = happiness?
What about ‘bads’? e.g. commuting costs What about ‘defensive expenditure’ e.g. security What about hours worked and stress at work? What about household debt?

50
Household debt in G7 countries
UK USA Japan Canada Germany Household debt as % of disposable income (%) France Italy Source: based on data in OECD Economic Outlook (OECD)
 France. Italy. Source: based on data in OECD Economic Outlook (OECD)")
51
Index of Sustainable Economic Welfare (ISEW) 1950–96 (max = 100)
UK Netherlands USA Source: New Economics Foundation/Friends of the Earth

52
Issues Is GDP a good measure? Poverty and inequality
Does material gain = happiness? What about ‘bads’? e.g. commuting costs What about ‘defensive expenditure’ e.g. security What about hours worked and stress at work? What about household debt? Poverty and inequality

53
Size distribution of UK income after taxes and benefits by quintile group of households
Bottom 20% Next 20% Middle Top 12% 16% 22% 43% 7% Bottom 20% Next 20% 7% 11% Middle 20% Top 20% 44% 16% 22% Next 20% 1996/7 2005/6 Source: ‘The effects of taxes and benefits on household income. 2005/06 (National Statistics)
")
54
Issues Is GDP a good measure? Poverty and inequality Social cohesion
Does material gain = happiness? What about ‘bads’? e.g. commuting costs What about ‘defensive expenditure’ e.g. security What about hours worked and stress at work? What about household debt? Poverty and inequality Social cohesion

55
Issues Is GDP a good measure? Poverty and inequality Social cohesion
Does material gain = happiness? What about ‘bads’? e.g. commuting costs What about ‘defensive expenditure’ e.g. security What about hours worked and stress at work? What about household debt? Poverty and inequality Social cohesion The environment

56
For access to free datasets see:

Similar presentations


, 04/22/2010 release. Estimates of detailed employment and wage data for the states.>")


 Grants Chapter 6.>")

