Download presentation
Presentation is loading. Please wait.

1
ACCESS for ELLs® Scores, Reliability and Validity
Prepared by Dorry Kenyon, CAL ISBE Meeting, Chicago, IL February 21, 2007 Developed by the Center for Applied Linguistics WIDA/CAL (c) 2007 WIDA/CAL Grade Level Cut Score Review Study
 2007 WIDA/CAL Grade Level Cut Score Review Study.")
2
Outline of my presentation
What do scores on ACCESS for ELLs® mean? What do we know about the reliability of ACCESS for ELLs® scores? What do we know about the validity of ACCESS for ELLs® scores? So what does this mean for using scores on ACCESS for ELLs®? WIDA/CAL (c) 2007 WIDA/CAL Grade Level Cut Score Review Study
 2007 WIDA/CAL Grade Level Cut Score Review Study.")
3
1. What do scores on ACCESS for ELLs® mean?

4
Two types of scores WIDA ACCESS for ELLs® Scale Scores = psychometrically-derived measure WIDA ACCESS for ELLs® Proficiency Level Scores = socially-derived interpretation of the scale score in terms of the WIDA Standards’ Proficiency Level Definitions WIDA/CAL (c) 2007 WIDA/CAL Grade Level Cut Score Review Study
 2007 WIDA/CAL Grade Level Cut Score Review Study.")
5
What is measured? Scale Scores (and interpretive Proficiency Level Scores) are given for measures in the four domains Listening Speaking Reading Writing Scale Scores are combined into four composite scores (which are also interpreted in Proficiency Level Scores) Oral (listening and speaking) Literacy (reading and writing) Comprehension (listening and reading) Overall Composite (listening, speaking, reading, and writing) WIDA/CAL (c) 2007 WIDA/CAL Grade Level Cut Score Review Study
 Oral (listening and speaking) Literacy (reading and writing) Comprehension (listening and reading) Overall Composite (listening, speaking, reading, and writing) WIDA/CAL (c) 2007 WIDA/CAL Grade Level Cut Score Review Study.")
6
Weighting of the overall composite
Scale Scales of the four domains are weighted differently in the overall composite score Listening (15%) Speaking (15%) Reading (35%) Writing (35%) WIDA/CAL (c) 2007 WIDA/CAL Grade Level Cut Score Review Study
 Speaking (15%) Reading (35%) Writing (35%) WIDA/CAL (c) 2007 WIDA/CAL Grade Level Cut Score Review Study.")
7
ACCESS administration times and composite score weights
Listening (15%): minutes, machine scored Reading (35%): minutes, machine scored Writing (35%): Up to 1 hour, rater scored Speaking (15%): Up to 15 minutes, administrator scored Administration times do not reflect logistics time, that is, the time needed to assemble students in the test room and to distribute, collect and secure test booklets. WIDA/CAL (c) 2007 WIDA/CAL Grade Level Cut Score Review Study
: minutes, machine scored. Reading (35%): minutes, machine scored. Writing (35%): Up to 1 hour, rater scored. Speaking (15%): Up to 15 minutes, administrator scored. Administration times do not reflect logistics time, that is, the time needed to assemble students in the test room and to distribute, collect and secure test booklets. WIDA/CAL (c) 2007 WIDA/CAL Grade Level Cut Score Review Study.")
8
Scale Scores vs. Proficiency Level Scores
The WIDA ACCESS for ELLs® Scale Scores are the psychometrically derived measures of student proficiency Range from 100 to 600 One scale applies to all grades through vertical equating of tests Vertical scale score takes into account that assessment tasks taken by students in the grade 9-12 cluster are more challenging than the assessment tasks taken by students in the grade 1-2 cluster Average scale scores consistently show an increase from grade to grade WIDA/CAL (c) 2007 WIDA/CAL Grade Level Cut Score Review Study
 2007 WIDA/CAL Grade Level Cut Score Review Study.")
9
2005-2006 Overall Composite Scale Scores

10
2005-2006 Overall Composite Scale Scores

11
Scale Scores vs. Proficiency Level Scores
Proficiency Level Scores are socially-derived interpretations of the WIDA ACCESS for ELLs® Scale Scores in terms of the six proficiency levels defined in the WIDA Standards Comprised of two numbers, e.g. 2.5 First number indicates the proficiency level into which the student’s scale score places him or her (e.g. 2 = Beginning) Second number indicates how far, in tenths, the student’s scale places him or her between the lower and the higher cut score of the proficiency level (e.g. 2.5 = 5/10 or ½ of the way between the cut score for level 2 and for level 3) The same scale score is interpreted differently based on what grade level cluster different students are in The same proficiency level score corresponds to different scale scores based on the grade level cluster
 Second number indicates how far, in tenths, the student’s scale places him or her between the lower and the higher cut score of the proficiency level (e.g. 2.5 = 5/10 or ½ of the way between the cut score for level 2 and for level 3) The same scale score is interpreted differently based on what grade level cluster different students are in. The same proficiency level score corresponds to different scale scores based on the grade level cluster.")
12
Example: Scale score of 350
Grades Domain Cut 1/2 2/3 3/4 4/5 5/6 1-2 Overall 259 285 313 332 354 3-5 292 325 350 370 394 6-8 319 347 374 393 410 9-12 373 396 412 429 350 350 350 350 WIDA/CAL (c) 2007 WIDA/CAL Grade Level Cut Score Review Study
 2007 WIDA/CAL Grade Level Cut Score Review Study.")
13
Example: Overall composite proficiency level score 6.0
9-12 429 410 6-8 394 3-5 354 1-2 Easy Items Less Proficient Students Hard Items More Proficient Students 350 475 600 225 100

14
How are proficiency level scores derived?
While Proficiency Level Scores are socially-derived interpretations, they are not arbitrary Set by panels of content experts Set following best technical practices Set by consensus building procedures (standard setting studies) Set by carefully documented replicable procedures For WIDA ACCESS for ELLs®, these were set by panels of experts in April of 2004, for each grade level cluster (see WIDA Technical Report #1 for complete details)
 Set by carefully documented replicable procedures. For WIDA ACCESS for ELLs®, these were set by panels of experts in April of 2004, for each grade level cluster (see WIDA Technical Report #1 for complete details)")
15
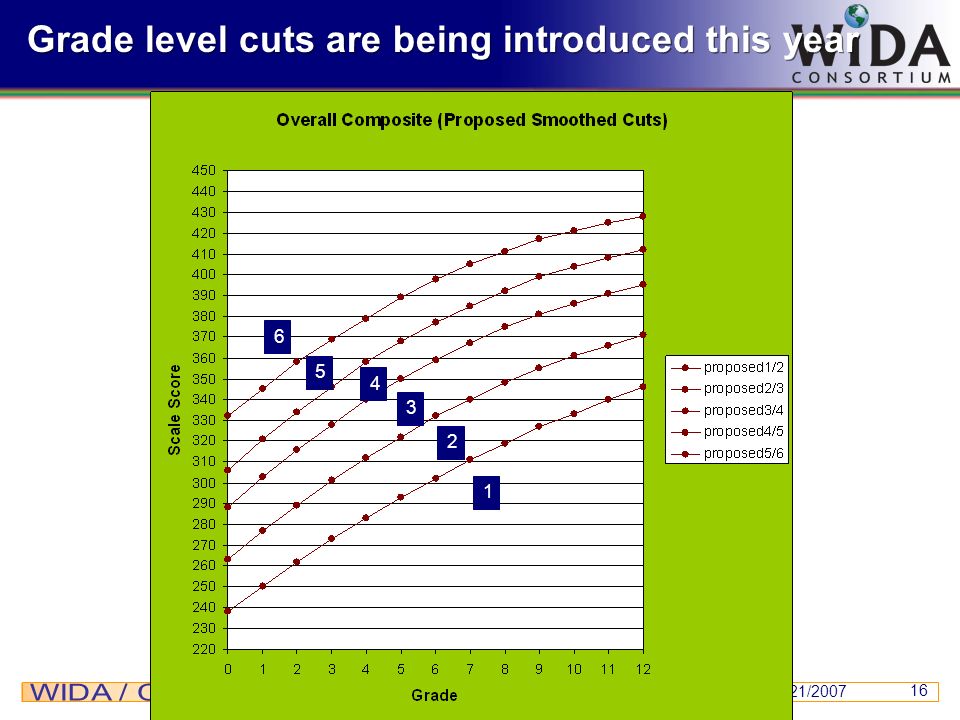
Originally WIDA had grade level cluster cuts
1 2 3 4 5 6 Can these be shrunk? WIDA/CAL (c) 2007 WIDA/CAL Grade Level Cut Score Review Study
 2007 WIDA/CAL Grade Level Cut Score Review Study.")
16
Grade level cuts are being introduced this year
1 2 3 4 5 6
17
Cluster vs. grade level cuts

18
2005-2006 Overall Composite Scale Scores
Cut—we can add a link to the graph on the previous page. WIDA/CAL (c) 2007 WIDA/CAL Grade Level Cut Score Review Study
 2007 WIDA/CAL Grade Level Cut Score Review Study.")
19
Effect of grade level cut scores
Spelling of “proficiency” in graphic Proficiency Level Score WIDA/CAL (c) 2007 WIDA/CAL Grade Level Cut Score Review Study
 2007 WIDA/CAL Grade Level Cut Score Review Study.")
20
2. What do we know about the reliability of ACCESS for ELLs® scores?

21
What is reliability? Psychometrically speaking, reliability refers to the consistency of test scores. What evidence is there that this test score result is not just a chance occurrence, but would have been obtained had the student been tested on multiple occurrences or scored under multiple occasions?

22
Multiple forms of ACCESS for ELLs®
In the Annual Technical Report, the reliability of each of the 44 separate test forms for ACCESS for ELLs® is reported. Cluster List Read Write Speak Total K 1 4 1-2 3 10 3-5 6-8 9-12 13 5 44

23
Types of reliability reported
For all test forms, internal consistency (coefficient alpha) is reported. For writing, agreement between operational raters is also reported (20%) For speaking, agreement between administrators from field test data is also given currently, but a larger study is underway Reliabilities for domain scores based on the individual forms for Series 100 ( ) are within expected and acceptable ranges
 is reported. For writing, agreement between operational raters is also reported (20%) For speaking, agreement between administrators from field test data is also given currently, but a larger study is underway. Reliabilities for domain scores based on the individual forms for Series 100 ( ) are within expected and acceptable ranges.")
24
Reliability of the overall composite
Results indicate that the reliability of the overall composite score across tiers is similar and very high across all grade level clusters (Series 100). K .930 1-2 .949 3-5 .941 6-8 .933 9-12 .936
. K")
25
The most important reliability index
For tests like ACCESS for ELLs®, by which decisions are based on a student’s classification into proficiency levels, the accuracy of classification is perhaps the most important reliability index. This index gives an estimate of how reliably a student was placed to be at least at or above a certain category (versus below that category).
.")
26
Accuracy of classification indices (Series 100)
Grade Cluster Cut K 1-2 3-5 6-8 9-12 1/2 .925 .974 .977 .968 .951 2/3 .949 .943 .940 .936 .921 3/4 na .928 .917 .912 .924 4/5 .945 .954 5/6 .975 .972 .976

27
3. What do we know about the validity of ACCESS for ELLs® scores?

28
What is validity? Validity refers to an evaluative judgment of the degree to which theoretical rationales and empirical evidence support the adequacy and appropriateness of inferences and actions made on the basis of test scores.

29
Validity issues for ACCESS for ELLs®
Issues related to ACCESS for ELLs® include Do the described proficiency levels exist? How does the test relate to other measures of English language proficiency? How confident are we in the cut scores that place students into the various levels, that they really define the levels? Do we know that ACCESS for ELLs® tests the language needed for academic success and is not a content test? And so on…

30
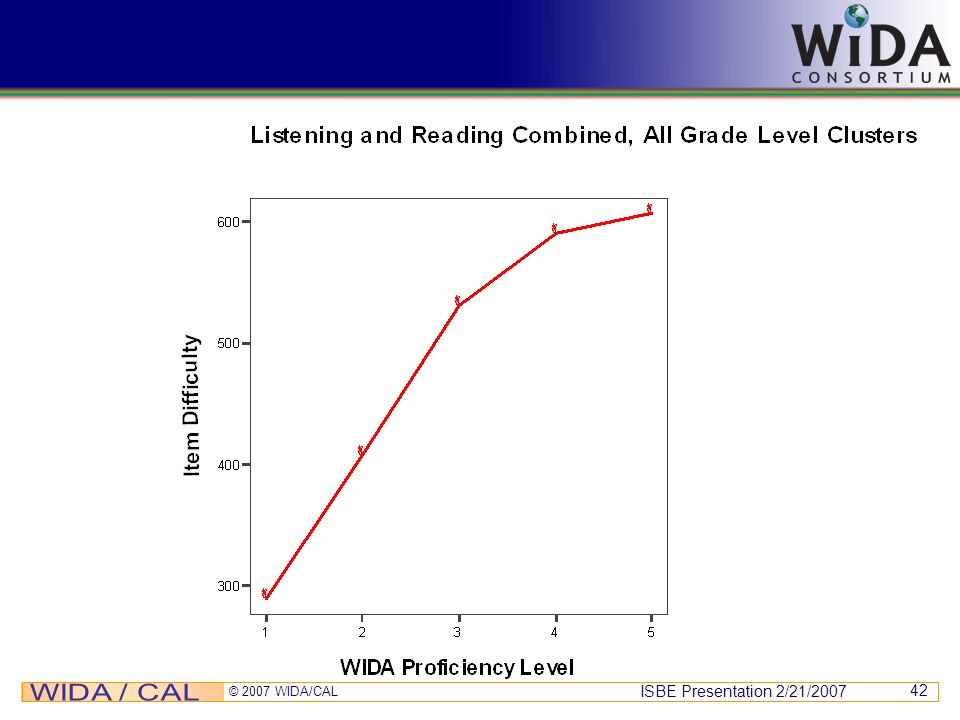
Study 1: Do the levels of the Standards really exist?
Reading and Listening Selected Response Type Items SI = Social and Instructional Language LA = language of Language Arts MA = language of Math SC = language of Science SS = language of Social Studies

31
The Standards guide test development
ACCESS for ELLS® makes the WIDA Standards operational WIDA Standards provide Content (What?) Performance Levels (How well?)
 Performance Levels (How well )")
32
Large-scale Standards: SC reading

33
Large-Scale standards: SC reading
Classify living organisms (such as birds and mammals) by using pictures or icons
 by using pictures or icons.")
34
Large-scale Standards: SC reading
Interpret data presented in text and tables in scientific studies

35
5: technical language of the content areas
At the given level of English language proficiency, English language learners will process, understand, produce, or use: 5: technical language of the content areas 2: general language of the content areas 1: pictorial or graphic representation of the language of the content areas

36
Validation issues Validity is about the adequacy and appropriateness of inferences about students made on the basis of test scores. The WIDA Standards make claims about what students at five different proficiency levels can do. Can those claims be substantiated empirically?

37
Research study questions
Are the ACCESS for ELLs™ items empirically ordered by difficulty as predicted by the WIDA Standards? Does that ordering differ by domain (listening or reading)? Does that ordering differ by standard (SI, LA, MA, SC, SS)?
 Does that ordering differ by standard (SI, LA, MA, SC, SS)")
38
Data Results from ACCESS for ELLs™ field test Fall 2004
Over 6500 students grades 1 to 12 8 WIDA states About 3.5% proportional representation

39
Method Items were vertically scaled across grade levels using common item equating Item difficulty was determined using the Rasch measurement model Items that did not meet the requirements of the model were eliminated from the analysis Average item difficulties were calculated by proficiency level

40
Number of items used = 651

41
Results

45
Conclusions

46
1. Are the ACCESS for ELLs™ items empirically ordered by difficulty as predicted by the WIDA Standards? Yes. WIDA Standards (MPIs) provided sufficient content and rationale to develop specifications that operationalized the five proficiency levels through listening and reading selected response items.
 provided sufficient content and rationale to develop specifications that operationalized the five proficiency levels through listening and reading selected response items.")
47
2. Does that ordering differ by domain (listening or reading)?
No. The general ordering was similar across listening and reading. Some difference between listening level 5 and reading level 5 was observed.

48
3. Does that ordering differ by standard (SI, LA, MA, SC, SS)?
Yes. SI (social and instructional language) items showed a clear tendency to be easier than items assessing language in the content areas, particularly at higher proficiency levels. Items assessing language in the content areas were similar except at level 5 where language arts appeared easier than expected.
 items showed a clear tendency to be easier than items assessing language in the content areas, particularly at higher proficiency levels. Items assessing language in the content areas were similar except at level 5 where language arts appeared easier than expected.")
49
Discussion 1. While many additional validation issues remain, this preliminary empirical analysis based on the field test data indicate that the WIDA Standards provide a strong basis for distinguishing among proficiency levels of ELLs.

50
Discussion 2. The operational plan for ongoing WIDA assessment item renewal and development provides opportunity to tighten item specifications based on empirical research while operationalizing the WIDA Standards.

51
Process of test development
1. Theory and Research 2. Standards 3. Specifications 4. Assessment

52
Study 2: Validation evidence from the bridge study
What can we learn about ACCESS for ELLs™ from the WIDA Consortium’s bridge study? Study 1: What is the relationship between performances on the older English language proficiency tests and on ACCESS for ELLS™? Study 2: What is the relationship between the “cut score” denoting the highest level of proficiency on the older tests and the predicted corresponding score on ACCESS for ELLs™ in terms of ACCESS proficiency levels? Assesses both listening and speaking One-on-one with administrator and examinee Computer adaptive – because computer selects each item from bank of items depending on scoring of each item, examinee will never get same test twice, so can be used for pre- and post-testing, no fear of students “memorizing” answers! Also available in print version. WIDA/CAL (c) 2007 WIDA/CAL Grade Level Cut Score Review Study
 2007 WIDA/CAL Grade Level Cut Score Review Study.")
53
Purpose of the bridge study
To help WIDA Consortium member states understand the performances of their ELLs in acquiring English on the older tests (for which they had data) in terms of the new test, especially to: meet compliance with Title III requirements provide continuity of data flow for cohorts of English language learners identified in , the baseline year provide information that may help determine Annual Measurable Achievement Objectives (AMAOs) for the established cohorts in the transitional year Assesses both listening and speaking One-on-one with administrator and examinee Computer adaptive – because computer selects each item from bank of items depending on scoring of each item, examinee will never get same test twice, so can be used for pre- and post-testing, no fear of students “memorizing” answers! Also available in print version. WIDA/CAL (c) 2007 WIDA/CAL Grade Level Cut Score Review Study
 in terms of the new test, especially to: meet compliance with Title III requirements. provide continuity of data flow for cohorts of English language learners identified in , the baseline year. provide information that may help determine Annual Measurable Achievement Objectives (AMAOs) for the established cohorts in the transitional year. Assesses both listening and speaking. One-on-one with administrator and examinee. Computer adaptive – because computer selects each item from bank of items depending on scoring of each item, examinee will never get same test twice, so can be used for pre- and post-testing, no fear of students memorizing answers! Also available in print version. WIDA/CAL (c) 2007 WIDA/CAL Grade Level Cut Score Review Study.")
54
The older tests IDEA Proficiency Test (IPT)
Language Assessment Scales (LAS) Language Proficiency Test Series (LPTS) Maculaitis II (MAC II) Assesses both listening and speaking One-on-one with administrator and examinee Computer adaptive – because computer selects each item from bank of items depending on scoring of each item, examinee will never get same test twice, so can be used for pre- and post-testing, no fear of students “memorizing” answers! Also available in print version. NOTE: The first three tests do NOT have separate scores for listening and speaking! WIDA/CAL (c) 2007 WIDA/CAL Grade Level Cut Score Review Study
 Language Proficiency Test Series (LPTS) Maculaitis II (MAC II) Assesses both listening and speaking. One-on-one with administrator and examinee. Computer adaptive – because computer selects each item from bank of items depending on scoring of each item, examinee will never get same test twice, so can be used for pre- and post-testing, no fear of students memorizing answers! Also available in print version. NOTE: The first three tests do NOT have separate scores for listening and speaking! WIDA/CAL (c) 2007 WIDA/CAL Grade Level Cut Score Review Study.")
55
WIDA levels of English Language Proficiency
ENTERING BEGINNING DEVELOPING EXPANDING 1 2 3 4 5 BRIDGING 6.0 Reaching 4.5 The five proficiency levels derive from Wisconsin’s scale and definitions. The labels used here were created by the WIDA development team. WIDA/CAL (c) 2007 WIDA/CAL Grade Level Cut Score Review Study
 2007 WIDA/CAL Grade Level Cut Score Review Study.")
56
Participants 4,985 students from IL and RI
WIDA/CAL (c) 2007 WIDA/CAL Grade Level Cut Score Review Study
 2007 WIDA/CAL Grade Level Cut Score Review Study.")
57
Procedures 2005 operational ACCESS administration (AL, ME, VT)
Participating students in IL and RI administered older test and operational ACCESS within 6-8 week window Scoring of older test took place within local districts following their standard procedures and submitted to ACCESS scoring vendor Scoring of ACCESS was with Spring 2005 operational scoring Data matched by ACCESS scoring vendor Older test data cleaned at CAL Analyses at CAL WIDA/CAL (c) 2007 WIDA/CAL Grade Level Cut Score Review Study
 2007 WIDA/CAL Grade Level Cut Score Review Study.")
58
Analyses: Study 1 Pearson correlations between performances on each form of older test (raw or scale score) and ACCESS for ELLs™ scale scores Because each form for the older tests was unique, 64 correlational analyses were performed IPT (14) LAS (14) LPTS (16) MAC II (20) Summarized by averaging Assesses both listening and speaking One-on-one with administrator and examinee Computer adaptive – because computer selects each item from bank of items depending on scoring of each item, examinee will never get same test twice, so can be used for pre- and post-testing, no fear of students “memorizing” answers! Also available in print version. WIDA/CAL (c) 2007 WIDA/CAL Grade Level Cut Score Review Study
 LAS (14) LPTS (16) MAC II (20) Summarized by averaging. Assesses both listening and speaking. One-on-one with administrator and examinee. Computer adaptive – because computer selects each item from bank of items depending on scoring of each item, examinee will never get same test twice, so can be used for pre- and post-testing, no fear of students memorizing answers! Also available in print version. WIDA/CAL (c) 2007 WIDA/CAL Grade Level Cut Score Review Study.")
59
Results: Study 1 example (IPT Reading)
IPT Reading Score with ACCESS Reading Scale Score IPT Form (Read) ACCESS Read Scale Score IPT_EL IPT Read Raw Score Pearson Correlation .741** N 205 IPT_R_1AB .540** 250 IPT_R_2AB .618** 296 IPT_R_3AB .713** 317 Assesses both listening and speaking One-on-one with administrator and examinee Computer adaptive – because computer selects each item from bank of items depending on scoring of each item, examinee will never get same test twice, so can be used for pre- and post-testing, no fear of students “memorizing” answers! Also available in print version. WIDA/CAL (c) 2007 WIDA/CAL Grade Level Cut Score Review Study
 ACCESS Read Scale Score. IPT_EL. IPT Read Raw Score. Pearson Correlation. .741** N IPT_R_1AB. .540** 250. IPT_R_2AB. .618** 296. IPT_R_3AB. .713** 317. Assesses both listening and speaking. One-on-one with administrator and examinee. Computer adaptive – because computer selects each item from bank of items depending on scoring of each item, examinee will never get same test twice, so can be used for pre- and post-testing, no fear of students memorizing answers! Also available in print version. WIDA/CAL (c) 2007 WIDA/CAL Grade Level Cut Score Review Study.")
60
Results: Study 1 summary range
Average Correlations (All Levels of Each Test within Domain) Test List Speak Read Write IPT 0.601 0.625 0.653 0.631 LAS 0.503 0.570 0.591 0.525 LPTS 0.603 0.651 0.741 0.675 MAC II 0.433 0.453 0.593 0.509 Assesses both listening and speaking One-on-one with administrator and examinee Computer adaptive – because computer selects each item from bank of items depending on scoring of each item, examinee will never get same test twice, so can be used for pre- and post-testing, no fear of students “memorizing” answers! Also available in print version. WIDA/CAL (c) 2007 WIDA/CAL Grade Level Cut Score Review Study
 Test. List. Speak. Read. Write. IPT LAS LPTS MAC II Assesses both listening and speaking. One-on-one with administrator and examinee. Computer adaptive – because computer selects each item from bank of items depending on scoring of each item, examinee will never get same test twice, so can be used for pre- and post-testing, no fear of students memorizing answers! Also available in print version. WIDA/CAL (c) 2007 WIDA/CAL Grade Level Cut Score Review Study.")
61
Results: Study 1 summary by test across domains
Average Correlations (All Levels of Each Test within Domain) Test List Speak Read Write IPT 0.601 0.625 0.653 0.631 LAS 0.503 0.570 0.591 0.525 LPTS 0.603 0.651 0.741 0.675 MAC II 0.433 0.453 0.593 0.509 Assesses both listening and speaking One-on-one with administrator and examinee Computer adaptive – because computer selects each item from bank of items depending on scoring of each item, examinee will never get same test twice, so can be used for pre- and post-testing, no fear of students “memorizing” answers! Also available in print version. WIDA/CAL (c) 2007 WIDA/CAL Grade Level Cut Score Review Study
 Test. List. Speak. Read. Write. IPT LAS LPTS MAC II Assesses both listening and speaking. One-on-one with administrator and examinee. Computer adaptive – because computer selects each item from bank of items depending on scoring of each item, examinee will never get same test twice, so can be used for pre- and post-testing, no fear of students memorizing answers! Also available in print version. WIDA/CAL (c) 2007 WIDA/CAL Grade Level Cut Score Review Study.")
62
Results: Study 1 summary by domain across tests
Average Correlations (All Levels of Each Test within Domain) Test List Speak Read Write IPT 0.601 0.625 0.653 0.631 LAS 0.503 0.570 0.591 0.525 LPTS 0.603 0.651 0.741 0.675 MAC II 0.433 0.453 0.593 0.509 Assesses both listening and speaking One-on-one with administrator and examinee Computer adaptive – because computer selects each item from bank of items depending on scoring of each item, examinee will never get same test twice, so can be used for pre- and post-testing, no fear of students “memorizing” answers! Also available in print version. WIDA/CAL (c) 2007 WIDA/CAL Grade Level Cut Score Review Study
 Test. List. Speak. Read. Write. IPT LAS LPTS MAC II Assesses both listening and speaking. One-on-one with administrator and examinee. Computer adaptive – because computer selects each item from bank of items depending on scoring of each item, examinee will never get same test twice, so can be used for pre- and post-testing, no fear of students memorizing answers! Also available in print version. WIDA/CAL (c) 2007 WIDA/CAL Grade Level Cut Score Review Study.")
63
Discussion: Study 1 Generally moderate to high correlations between ACCESS for ELLs® and older tests; ACCESS appears to assessing a similar construct (criterion-related validity) but is not interchangeable with the older tests Correlations across all tests with reading were highest; most familiar to students and test developers? Correlations across all tests with listening were lowest; but three tests did not have separate scores for listening and speaking! Correlations across domains between LPTS and ACCESS for ELLs® were highest; LPTS the newest of the ‘older generation’ Assesses both listening and speaking One-on-one with administrator and examinee Computer adaptive – because computer selects each item from bank of items depending on scoring of each item, examinee will never get same test twice, so can be used for pre- and post-testing, no fear of students “memorizing” answers! Also available in print version. WIDA/CAL (c) 2007 WIDA/CAL Grade Level Cut Score Review Study
 but is not interchangeable with the older tests. Correlations across all tests with reading were highest; most familiar to students and test developers Correlations across all tests with listening were lowest; but three tests did not have separate scores for listening and speaking! Correlations across domains between LPTS and ACCESS for ELLs® were highest; LPTS the newest of the ‘older generation’ Assesses both listening and speaking. One-on-one with administrator and examinee. Computer adaptive – because computer selects each item from bank of items depending on scoring of each item, examinee will never get same test twice, so can be used for pre- and post-testing, no fear of students memorizing answers! Also available in print version. WIDA/CAL (c) 2007 WIDA/CAL Grade Level Cut Score Review Study.")
64
Analyses: Study 2 From predicted scores tables, found for each grade level the ACCESS for ELLs® proficiency level score corresponding to the “cut score” of the highest proficiency level on the older test Summarized findings by calculating averages and standard deviations Assesses both listening and speaking One-on-one with administrator and examinee Computer adaptive – because computer selects each item from bank of items depending on scoring of each item, examinee will never get same test twice, so can be used for pre- and post-testing, no fear of students “memorizing” answers! Also available in print version. WIDA/CAL (c) 2007 WIDA/CAL Grade Level Cut Score Review Study
 2007 WIDA/CAL Grade Level Cut Score Review Study.")
65
Predicted scores table example
Predicted ACCESS = * LAS LAS RW 2AB Writing Raw Score to WIDA ACCESS Writing Scale Score LAS RW 2AB Raw Score LAS Proficiency Level (by grade) Predicted ACCESS Score Writing 4,5,6 4,5 6 1 270 1.9 1.8 28 319 3.0 2.4 272 29 321 3.1 2.5 2 274 30 322 3 275 31 324 4 277 32 326 5 279 33 327 … 27 317 2.9 55 366 4.5 3.7 Assesses both listening and speaking One-on-one with administrator and examinee Computer adaptive – because computer selects each item from bank of items depending on scoring of each item, examinee will never get same test twice, so can be used for pre- and post-testing, no fear of students “memorizing” answers! Also available in print version. WIDA/CAL (c) 2007 WIDA/CAL Grade Level Cut Score Review Study
 Predicted. ACCESS. Score. Writing. 4,5,6. 4, … Assesses both listening and speaking. One-on-one with administrator and examinee. Computer adaptive – because computer selects each item from bank of items depending on scoring of each item, examinee will never get same test twice, so can be used for pre- and post-testing, no fear of students memorizing answers! Also available in print version. WIDA/CAL (c) 2007 WIDA/CAL Grade Level Cut Score Review Study.")
66
Finding the WIDA proficiency level score example
Predicted ACCESS = * LAS LAS RW 2AB Writing Raw Score to WIDA ACCESS Writing Scale Score LAS RW 2AB Raw Score LAS Proficiency Level (by grade) Predicted ACCESS Score Writing 4,5,6 4,5 6 … 42 2 343 3.8 3.2 43 345 3.9 44 3 347 3.3 45 348 46 350 4 Assesses both listening and speaking One-on-one with administrator and examinee Computer adaptive – because computer selects each item from bank of items depending on scoring of each item, examinee will never get same test twice, so can be used for pre- and post-testing, no fear of students “memorizing” answers! Also available in print version. WIDA/CAL (c) 2007 WIDA/CAL Grade Level Cut Score Review Study
 Predicted. ACCESS. Score. Writing. 4,5,6. 4,5. 6. … Assesses both listening and speaking. One-on-one with administrator and examinee. Computer adaptive – because computer selects each item from bank of items depending on scoring of each item, examinee will never get same test twice, so can be used for pre- and post-testing, no fear of students memorizing answers! Also available in print version. WIDA/CAL (c) 2007 WIDA/CAL Grade Level Cut Score Review Study.")
67
Truncated example results: Listening
K 1 2 3 … 11 12 Listening IPT 6.0 4.3 4.8 LAS 4.7 4.4 LPTS 3.1 3.4 3.8 3.7 3.0 MAC II 3.3 5.2 2.9 Assesses both listening and speaking One-on-one with administrator and examinee Computer adaptive – because computer selects each item from bank of items depending on scoring of each item, examinee will never get same test twice, so can be used for pre- and post-testing, no fear of students “memorizing” answers! Also available in print version. WIDA/CAL (c) 2007 WIDA/CAL Grade Level Cut Score Review Study
 2007 WIDA/CAL Grade Level Cut Score Review Study.")
68
Results: Study 2 summary range
Average Proficiency Level Score (Standard Deviation) Test List Speak Read Write IPT 4.9 (0.80) 4.0 (0.36) 3.9 (0.97) 2.9 (0.64) LAS 4.8 (0.67) 5.1 (0.81) 3.1 (1.11) LPTS 3.5 (0.53) (0.79) 5.3 (0.71) (0.74) MAC II 3.7 (0.78) (0.76) 3.0 (0.40) Assesses both listening and speaking One-on-one with administrator and examinee Computer adaptive – because computer selects each item from bank of items depending on scoring of each item, examinee will never get same test twice, so can be used for pre- and post-testing, no fear of students “memorizing” answers! Also available in print version. WIDA/CAL (c) 2007 WIDA/CAL Grade Level Cut Score Review Study
 Test. List. Speak. Read. Write. IPT (0.80) 4.0. (0.36) 3.9. (0.97) 2.9. (0.64) LAS (0.67) 5.1. (0.81) 3.1. (1.11) LPTS (0.53) (0.79) 5.3. (0.71) (0.74) MAC II (0.78) (0.76) 3.0. (0.40) Assesses both listening and speaking. One-on-one with administrator and examinee. Computer adaptive – because computer selects each item from bank of items depending on scoring of each item, examinee will never get same test twice, so can be used for pre- and post-testing, no fear of students memorizing answers! Also available in print version. WIDA/CAL (c) 2007 WIDA/CAL Grade Level Cut Score Review Study.")
69
Interpretation: Highest test and domain
ENTERING BEGINNING DEVELOPING EXPANDING 1 2 3 4 5 BRIDGING 6.0 Reaching LPTS Reading The five proficiency levels derive from Wisconsin’s scale and definitions. The labels used here were created by the WIDA development team. LPTS Reading WIDA/CAL (c) 2007 WIDA/CAL Grade Level Cut Score Review Study
 2007 WIDA/CAL Grade Level Cut Score Review Study.")
70
Interpretation: Lowest test and domain
ENTERING BEGINNING DEVELOPING EXPANDING 1 2 3 4 5 BRIDGING 6.0 Reaching The five proficiency levels derive from Wisconsin’s scale and definitions. The labels used here were created by the WIDA development team. IPT Writing LPTS Reading WIDA/CAL (c) 2007 WIDA/CAL Grade Level Cut Score Review Study
 2007 WIDA/CAL Grade Level Cut Score Review Study.")
71
Results: Study 2 High and low by test across domains
Average Proficiency Level Score (Standard Deviation) Test List Speak Read Write IPT 4.9 (0.80) 4.0 (0.36) 3.9 (0.97) 2.9 (0.64) LAS 4.8 (0.67) 5.1 (0.81) 3.1 (1.11) LPTS 3.5 (0.53) (0.79) 5.3 (0.71) (0.74) MAC II 3.7 (0.78) (0.76) 3.0 (0.40) Assesses both listening and speaking One-on-one with administrator and examinee Computer adaptive – because computer selects each item from bank of items depending on scoring of each item, examinee will never get same test twice, so can be used for pre- and post-testing, no fear of students “memorizing” answers! Also available in print version. WIDA/CAL (c) 2007 WIDA/CAL Grade Level Cut Score Review Study
 Test. List. Speak. Read. Write. IPT (0.80) 4.0. (0.36) 3.9. (0.97) 2.9. (0.64) LAS (0.67) 5.1. (0.81) 3.1. (1.11) LPTS (0.53) (0.79) 5.3. (0.71) (0.74) MAC II (0.78) (0.76) 3.0. (0.40) Assesses both listening and speaking. One-on-one with administrator and examinee. Computer adaptive – because computer selects each item from bank of items depending on scoring of each item, examinee will never get same test twice, so can be used for pre- and post-testing, no fear of students memorizing answers! Also available in print version. WIDA/CAL (c) 2007 WIDA/CAL Grade Level Cut Score Review Study.")
72
Results: Study 2 High and low by domain across tests
Average Proficiency Level Score (Standard Deviation) Test List Speak Read Write IPT 4.9 (0.80) 4.0 (0.36) 3.9 (0.97) 2.9 (0.64) LAS 4.8 (0.67) 5.1 (0.81) 3.1 (1.11) LPTS 3.5 (0.53) (0.79) 5.3 (0.71) (0.74) MAC II 3.7 (0.78) (0.76) 3.0 (0.40) Assesses both listening and speaking One-on-one with administrator and examinee Computer adaptive – because computer selects each item from bank of items depending on scoring of each item, examinee will never get same test twice, so can be used for pre- and post-testing, no fear of students “memorizing” answers! Also available in print version. WIDA/CAL (c) 2007 WIDA/CAL Grade Level Cut Score Review Study
 Test. List. Speak. Read. Write. IPT (0.80) 4.0. (0.36) 3.9. (0.97) 2.9. (0.64) LAS (0.67) 5.1. (0.81) 3.1. (1.11) LPTS (0.53) (0.79) 5.3. (0.71) (0.74) MAC II (0.78) (0.76) 3.0. (0.40) Assesses both listening and speaking. One-on-one with administrator and examinee. Computer adaptive – because computer selects each item from bank of items depending on scoring of each item, examinee will never get same test twice, so can be used for pre- and post-testing, no fear of students memorizing answers! Also available in print version. WIDA/CAL (c) 2007 WIDA/CAL Grade Level Cut Score Review Study.")
73
Discussion: Study 2 (1 of 3)
Results varied widely from a close relationship to WIDA proficiency span (LPTS Reading) to much lower, though in general, “cut scores” on older tests tended to be much lower than the WIDA 6.0; were ELLs exited too early under the older tests? do ACCESS for ELLs™ standards and performance level definitions better align with levels of English proficiency needed for academic success? with a single test across districts within a states, states will have clearer data to better understand the development of English proficiency in ELLs and its relationship to academic achievement Assesses both listening and speaking One-on-one with administrator and examinee Computer adaptive – because computer selects each item from bank of items depending on scoring of each item, examinee will never get same test twice, so can be used for pre- and post-testing, no fear of students “memorizing” answers! Also available in print version. WIDA/CAL (c) 2007 WIDA/CAL Grade Level Cut Score Review Study
 to much lower, though in general, cut scores on older tests tended to be much lower than the WIDA 6.0; were ELLs exited too early under the older tests do ACCESS for ELLs™ standards and performance level definitions better align with levels of English proficiency needed for academic success with a single test across districts within a states, states will have clearer data to better understand the development of English proficiency in ELLs and its relationship to academic achievement. Assesses both listening and speaking. One-on-one with administrator and examinee. Computer adaptive – because computer selects each item from bank of items depending on scoring of each item, examinee will never get same test twice, so can be used for pre- and post-testing, no fear of students memorizing answers! Also available in print version. WIDA/CAL (c) 2007 WIDA/CAL Grade Level Cut Score Review Study.")
74
Discussion: Study 2 (2 of 3)
Results varied widely across tests and domains; LPTS with the highest “cut scores” in reading and writing had lowest “cut scores” in listening and speaking; but three tests did not have separate scores for listening and speaking, including LPTS! LPTS had only “fluent”/”non-fluent” listening and speaking categories? Assesses both listening and speaking One-on-one with administrator and examinee Computer adaptive – because computer selects each item from bank of items depending on scoring of each item, examinee will never get same test twice, so can be used for pre- and post-testing, no fear of students “memorizing” answers! Also available in print version. WIDA/CAL (c) 2007 WIDA/CAL Grade Level Cut Score Review Study
 2007 WIDA/CAL Grade Level Cut Score Review Study.")
75
Discussion: Study 2 (3 of 3)
Across tests, writing had lowest “cut scores” for three of four tests; is writing on ACCESS for ELLs™ unduly hard?, or is it more indicative of what is needed for academic success? Assesses both listening and speaking One-on-one with administrator and examinee Computer adaptive – because computer selects each item from bank of items depending on scoring of each item, examinee will never get same test twice, so can be used for pre- and post-testing, no fear of students “memorizing” answers! Also available in print version. WIDA/CAL (c) 2007 WIDA/CAL Grade Level Cut Score Review Study
 2007 WIDA/CAL Grade Level Cut Score Review Study.")
76
Important considerations in interpretations
CONTENT differences between all five tests include: Degree of alignment with English language proficiency and academic content standards Number and types of items in each subsection or language domain Depth of knowledge of the items Inclusion of the language of math, science, and social studies Ceiling levels of the measures Rubrics used for interpreting speaking and writing METHODOLOGICAL caveats include: Use of linear regression across all analyses Sometimes small numbers of students in subgroups Distribution of observed scores (Spring testing)
")
77
Preliminary conclusions
Correlational data show strong support for ACCESS for ELLs™ as a measure of English proficiency (criterion-related validity) Comparison of “cut scores” indicate that the WIDA Standards, as operationalized by ACCESS for ELLs™, describe a longer proficiency continuum than the older tests Additional studies are needed to explore the relationship between that extended continuum and academic achievement
 Comparison of cut scores indicate that the WIDA Standards, as operationalized by ACCESS for ELLs™, describe a longer proficiency continuum than the older tests. Additional studies are needed to explore the relationship between that extended continuum and academic achievement.")
78
Validity evidence from the grade level cut score review study
75 teachers from 14 WIDA states Examined test items and (for writing and speaking) examinee performances in light of the WIDA Standard’s model Performance Indicators and the Standard’s performance level descriptors Through a structured process came up with proposed grade level cut scores (based on empirical proposed scores based on current cluster level cut scores) As in the original standard setting study, evaluated the confidence they had in the cut scores representing the different performance levels Results: Confidence increased greatly over first study
 examinee performances in light of the WIDA Standard’s model Performance Indicators and the Standard’s performance level descriptors. Through a structured process came up with proposed grade level cut scores (based on empirical proposed scores based on current cluster level cut scores) As in the original standard setting study, evaluated the confidence they had in the cut scores representing the different performance levels. Results: Confidence increased greatly over first study.")
79
Evaluations from grade level cut score review
Averages across all participants How confident are you in the cut scores? (4 = hi, 1 = lo) Red = below 3.10 / Black = 3.11 to 3.40 / Green = above 3.40 Read Write List Speak Orig Rev 1/2 3.08 3.41 3.39 3.46 3.22 3.51 3.24 2/3 2.83 3.47 3.28 3.43 3.15 3.55 3.01 3/4 2.98 3.48 3.33 3.36 3.17 3.57 2.89 3.37 4/5 3.05 3.54 3.35 3.19 3.53 2.84 5/6 3.52 3.18 3.60 2.97 3.56
 Red = below 3.10 / Black = 3.11 to 3.40 / Green = above Read. Write. List. Speak. Orig. Rev. 1/ / / / /")
80
Evaluations from grade level cut score review
Averages across all participants How confident are you in the cut scores? (4 = hi, 1 = lo) Red = below 3.10 / Black = 3.11 to 3.40 / Green = above 3.40 Read Write List Speak Orig Rev 1/2 3.08 3.41 3.39 3.46 3.22 3.51 3.24 2/3 2.83 3.47 3.28 3.43 3.15 3.55 3.01 3/4 2.98 3.48 3.33 3.36 3.17 3.57 2.89 3.37 4/5 3.05 3.54 3.35 3.19 3.53 2.84 5/6 3.52 3.18 3.60 2.97 3.56
 Red = below 3.10 / Black = 3.11 to 3.40 / Green = above Read. Write. List. Speak. Orig. Rev. 1/ / / / /")
81
Evaluations from grade level cut score review
Averages across all participants How confident are you in the cut scores? (4 = hi, 1 = lo) Red = below 3.10 / Black = 3.11 to 3.40 / Green = above 3.40 Read Write List Speak Orig Rev 1/2 3.08 3.41 3.39 3.46 3.22 3.51 3.24 2/3 2.83 3.47 3.28 3.43 3.15 3.55 3.01 3/4 2.98 3.48 3.33 3.36 3.17 3.57 2.89 3.37 4/5 3.05 3.54 3.35 3.19 3.53 2.84 5/6 3.52 3.18 3.60 2.97 3.56
 Red = below 3.10 / Black = 3.11 to 3.40 / Green = above Read. Write. List. Speak. Orig. Rev. 1/ / / / /")
82
Evaluations from grade level cut score review
Averages across all participants How confident are you in the cut scores? (4 = hi, 1 = lo) Red = below 3.10 / Black = 3.11 to 3.40 / Green = above 3.40 Read Write List Speak Orig Rev 1/2 3.08 3.41 3.39 3.46 3.22 3.51 3.24 2/3 2.83 3.47 3.28 3.43 3.15 3.55 3.01 3/4 2.98 3.48 3.33 3.36 3.17 3.57 2.89 3.37 4/5 3.05 3.54 3.35 3.19 3.53 2.84 5/6 3.52 3.18 3.60 2.97 3.56
 Red = below 3.10 / Black = 3.11 to 3.40 / Green = above Read. Write. List. Speak. Orig. Rev. 1/ / / / /")
83
Other validity studies underway at CAL
Some ongoing internal research at CAL (1) What do we learn from the results of the technical analyses of Series 100 to improve item and form specifications? (2) How do we improve the construction of items appropriate (both from content and empirical results) to their targeted proficiency levels? (3) What evidence do we have that ACCESS for ELLs tests the language of the content areas and not knowledge of the content areas?
 What do we learn from the results of the technical analyses of Series 100 to improve item and form specifications (2) How do we improve the construction of items appropriate (both from content and empirical results) to their targeted proficiency levels (3) What evidence do we have that ACCESS for ELLs tests the language of the content areas and not knowledge of the content areas")
84
#1 Example from Series 100 analyses

85
#1 Example from Series 100 analyses

86
#2 Example 3-5 Read Prof Level 2
WIDA/CAL (c) 2007 WIDA/CAL Grade Level Cut Score Review Study
 2007 WIDA/CAL Grade Level Cut Score Review Study.")
87
#2 Example 3-5 Read Prof Level 5
WIDA/CAL (c) 2007 WIDA/CAL Grade Level Cut Score Review Study
 2007 WIDA/CAL Grade Level Cut Score Review Study.")
88
Interaction of Performance Level Descriptions and model Performance Indicators
Language Proficiency (Performance Level Descriptions) 1 Entering 2 Beginning 3 Developing 4 Expanding 5 Bridging PIs L 1 L 2 L 3 L4 L 5 Linguistic Complexity Vocabulary Usage Language Control WIDA/CAL (c) 2007 WIDA/CAL Grade Level Cut Score Review Study
 1 Entering. 2 Beginning. 3 Developing. 4 Expanding. 5 Bridging. PIs. L 1. L 2. L 3. L4. L 5. Linguistic Complexity. Vocabulary Usage. Language Control. WIDA/CAL (c) 2007 WIDA/CAL Grade Level Cut Score Review Study.")
89
#3 Confirmatory Factor Analyses (SEM)
RSI SI RLA RMA Read Score R-prof LA RSC RSS MA Engprof LSI LLA SC List Score L-prof LMA SS LSC LSS

90
Other research (and possibilities)
Native speaker studies (Alabama data) Relationship between performance on ACCESS for ELLs and state content tests (?) WIDA/CAL (c) 2007 WIDA/CAL Grade Level Cut Score Review Study
 Relationship between performance on ACCESS for ELLs and state content tests ( ) WIDA/CAL (c) 2007 WIDA/CAL Grade Level Cut Score Review Study.")
91
Logistic regression with state data?
Yes X hi% lo% Probability 80% No X Score ACCESS Scale Score low high WIDA/CAL (c) 2007 WIDA/CAL Grade Level Cut Score Review Study
 2007 WIDA/CAL Grade Level Cut Score Review Study.")
92
4. So what does this mean for using scores on ACCESS for ELLs®?
Be sure to understand the meaning of scale scores and proficiency level scores Have confidence using scores knowing that the reliability (consistency) of the scale scores are high; in particular, for the overall composite score that the accuracy of classification based on the overall composite is also high initial validity studies strongly support the use of ACCESS for ELLs® test scores as a valid indicator of levels of proficiency in accordance with the WIDA Standards the WIDA Consortium supports a rigorous program of on-going test improvement, supported by research the WIDA Consortium continues to collect evidences in support of the validity of the use of test scores
 of the scale scores are high; in particular, for the overall composite score. that the accuracy of classification based on the overall composite is also high. initial validity studies strongly support the use of ACCESS for ELLs® test scores as a valid indicator of levels of proficiency in accordance with the WIDA Standards. the WIDA Consortium supports a rigorous program of on-going test improvement, supported by research. the WIDA Consortium continues to collect evidences in support of the validity of the use of test scores.")
93
For more information, please contact the WIDA Hotline: 1-866-276-7735 or www.wida.us/helpform
World Class Instructional Design and Assessment, Center for Applied Linguistics, Metritech, Inc., WIDA/CAL (c) 2007 WIDA/CAL Grade Level Cut Score Review Study
 2007 WIDA/CAL Grade Level Cut Score Review Study.")
Similar presentations


 Grants Chapter 6.>")
