Download presentation
Presentation is loading. Please wait.

1
Evaluating District-Wide Professional Learning to Build Capacity for RTI
Michelle Avila Bolling, Ed.S. Lisa Sirian Stear, Ph.D. Sharon Rinks, Psy.D. Danny Hicks, Ed.S. Cindy Jenik, Ph.D.

2
Goals for Today’s Session
Establish the context Project conception System support Format for training Enabling and disabling factors Outcome data Future plans Questions Explore the CD of materials

3
Carroll County West central GA On GA/AL state line 50 miles from
Atlanta 503 square miles Population 109,965 (2006 census) Cost of living 93% of U.S avg.
 Cost of living. 93% of U.S avg.")
4
District Enrollment 23rd largest school system in Georgia
14,800 students in Pre-K through 12th grade Ethnicity: 68% White 18% African-American 7% Other

5
Personnel 2,225 total staff members 99.25% “Highly Qualified” teachers
1,261 certified 964 classified 99.25% “Highly Qualified” teachers 62% of certified staff members hold masters degree or higher Psychological Services 4 doctoral, 4 educational specialist 3 licensed, 5 certified APPIC training program

6
Schools • 11 elementary schools • 6 middle schools • 6 high schools
• 3 ninth grade academies • 1 alternative school • 1 technical education center 2 psychoeducational centers

7
Project Timeline Spring 2007 Summer 2007 Spring/Summer 2008 Fall 2008
Georgia mandated RTI to begin Fall 2007 Summer 2007 District RTI Manual introduced to principals Every school provided a copy Spring/Summer 2008 Conceptualized the RTI Institute Created training materials Fall 2008 Conducted training Spring 2009 School teams redelivered Fall 2009/Spring 2010 Evaluated progress

8
The Problem Frustration from implementation or lack thereof
Need for training others Lack of district resources and funds Lack of state-level guidance Confusion regarding the 4-tier pyramid

9
The Problem: Referral Data
Manual Released Training Occurred

10
Project Conception Seeking System Support Met with our supervisor
Met with the district PD coordinator Mapped out a blueprint for training Arranged for leadership module

11
Project Conception District Enabling Support
Extra work days over the summer to develop modules Time commitment Extra support from graduate student interns and practicum students Provided materials, meeting space, and snacks Paid for substitutes for teacher participants

13
Leadership Module Leadership and administrative support
Important for any innovation and essential if you want it to work Administrators control resources Time Personnel Materials/resources Administrators outline duties and expectations for personnel Endorsement in the face of possible resistance to change

14
Unless commitment is made, there are only promises and hopes
Unless commitment is made, there are only promises and hopes... but no plans. - Peter Drucker

15
The Professional Learning Model
Voluntary participation Distributed learning over time Meaningful choices Opportunities for practice Authentic cases Learning communities/teaming Responsive to participants’ needs Tailored feedback

17
Selecting Team Members
Voluntary participation Administrative representation 3-4 other individuals Curriculum specialists Grade-level teacher leaders Counselors Psychologists Graduation coaches Special education teachers All team members had to commit to completion of the entire training.

18
I start with the premise that the function of leadership is to produce more leaders, not more followers. - Ralph Nader

20
Overview Module Agenda
Overview of training Establish a common language Self-Assessment of readiness Discuss goals and action planning Gather questions and confusions

22
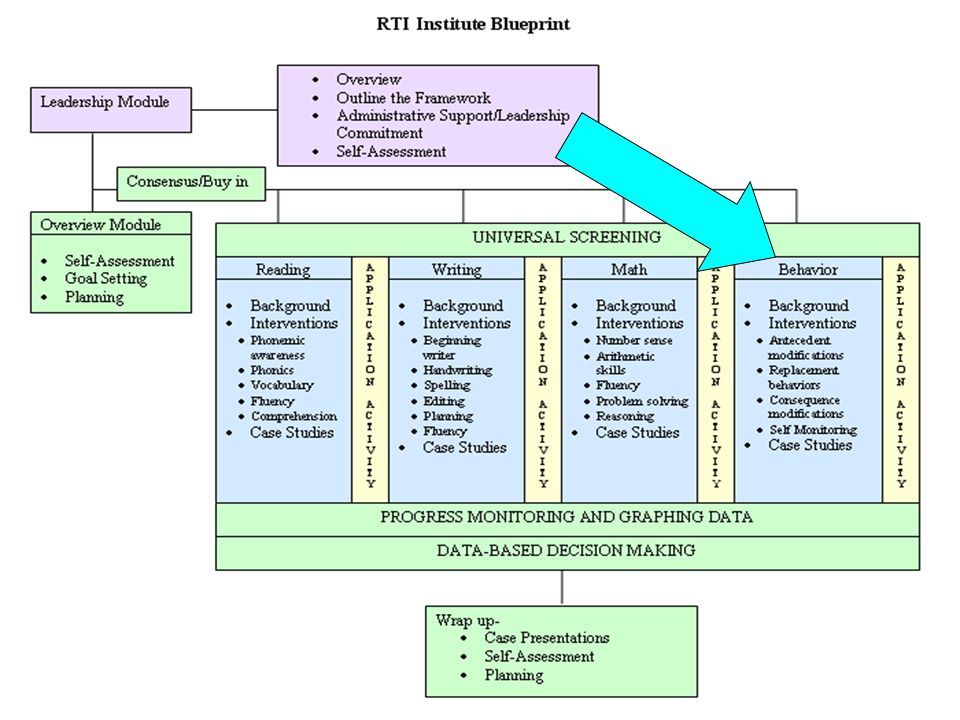
Reading Module Agenda Process the Application Activity
Evidence-based RTI practices in reading Practice progress monitoring administration Oral Reading Fluency Maze Progress monitoring & data entry Practice data entry Review decision making for each case Case studies Discuss Application Activity

23
Interventions Five areas Phonemic Awareness Phonics Vocabulary Fluency
Comprehension

24
Interactive Table of Contents

26
Writing Module Agenda RTI implementation status reports
Process the Application Activity Activating prior knowledge – RTI Bingo Evidence-based RTI practices in writing Universal screening Intervention Progress monitoring Practice progress monitoring scoring Case studies Discuss Application Activity

27
Interventions Six Areas Comprehensive Strategies Beginning Writing
Handwriting Spelling Editing Planning Fluency Comprehensive Strategies

29
Math Module Agenda Round robin problem solving for RTI
Evidence-based RTI practices in math Universal screening Intervention Intervention fidelity Progress monitoring Establishing goals challenge activity Math case studies Discuss Application Activity

30
Interventions Whole Group Strategies for Tiers I & II Six Areas
Number sense Arithmetic Fluency Problem Solving Reasoning Mnemonic Strategies

32
Behavior Module Agenda
School-wide Positive Behavior Supports (Tier I) Evidence-based RTI practices in behavior management Universal screening Intervention Functional behavioral assessment Behavior intervention planning Progress monitoring Discuss application activity
 Evidence-based RTI practices in behavior management. Universal screening. Intervention. Functional behavioral assessment. Behavior intervention planning. Progress monitoring. Discuss application activity.")
33
Interventions Class or School Interventions for Tiers I & II
Four Areas Antecedent Modifications Replacement Behaviors Consequence Modifications Self-Monitoring

35
Wrap-Up Agenda SARTII Case Presentations Forms and Documents Planning
Discussion

36
Researching the Program
Participant Perceptions Researcher Perceptions School Readiness Ratings Rubric Evaluation of Permanent Products Team Interview Data

37
Course Participants Total Number of Participants Who Completed Course N=58 Elementary Participants N=36 Middle & High Participants N=22

38
Outcome Data – Self-Report Ratings
Prior to training, only 20.6% of participants reported at least a competent level of understanding of RTI. Post-training, 89.7% reported a competent level of understanding. Significantly higher rates of understanding found (t= , p<.001)
")
39
Outcome Data – Self-Report Ratings
Prior to training, only 15.5% of participants felt competent to implement RTI. After the training, 82.8% of participants felt competent. Significantly higher rates of skills reported (t= , p<.001)
")
40
Outcome Data – Self-Report Ratings
Prior to training, only 13.8% of participants felt competent to act as a resource to others. After the training, 81% felt competent. Significantly higher rates reported (t= , p<.001)
")
41
Outcome Data – Self-Report Ratings

42
Outcome Data – Self-Report Ratings

43
Outcome Data – Self-Report Ratings
Participants reported significantly higher agreement that the RTI model will help children in their school be more successful (t=-8.045, p=.016).
.")
44
Outcome Data – Redelivery (2/2009)
Format of Redelivery Percentage of Schools School-wide whole-group training 31% Grade-level team trainings 77% Individual consultation Posting on intranet or distributing handouts Other: Weekly RTI support meeting 7% 87% of schools (13/15) did some form of redelivery One additional school had 100% participation
 did some form of redelivery. One additional school had 100% participation.")
45
Researcher Perceptions Enabling Factors
District & principal support Group discussion opportunities Application activities Case studies – saw improvement Consistent team membership Thoughtful selection of team membership Collaborative nature of the team Technology support Voluntary participants Flexibility of implementation

46
Researcher Perceptions Disabling Factors
Participants were “voluntold” Teams had limited administrative support Resistance to change/inflexible structures Too much content, too little time Competing district initiatives Location of training Lack of resources and information for high school students (only 1 of 5 high schools completed training) Flexibility of implementation – looking for district-wide guidance
 Flexibility of implementation – looking for district-wide guidance.")
47
Outcome Data - SARTII Self-Assessment of RTI Implementation (SARTII)*
Status Ratings: Not Started (The activity occurs 0% of the time) Just Started (The activity occurs 1 to 24% of the time) In Progress (The activity occurs 25 to 74% of the time) Achieved (The activity occurs 75 to 100% of the time) Maintaining (continues to occur 75 to 100% of the time) *Adapted from the IL-ASPIRE SAPSI v. 1.6 Center for School Evaluation, Intervention and Training (CSEIT) Loyola University Chicago, Florida Problem Solving/Response to Intervention Project (SAPSI Fall, 2007), & North Carolina Comprehensive Assessment of Need (NCCAN)
 Just Started (The activity occurs 1 to 24% of the time) In Progress (The activity occurs 25 to 74% of the time) Achieved (The activity occurs 75 to 100% of the time) Maintaining (continues to occur 75 to 100% of the time) *Adapted from the IL-ASPIRE SAPSI v Center for School Evaluation, Intervention and Training (CSEIT) Loyola University Chicago, Florida Problem Solving/Response to Intervention Project (SAPSI Fall, 2007), & North Carolina Comprehensive Assessment of Need (NCCAN)")
48
Outcome Data – SARTII Consensus
Maintaining Achieved In Progress Just Started Not Started

49
Outcome Data – SARTII Infrastructure
Maintaining Achieved In Progress Just Started Not Started

50
Outcome Data – SARTII Infrastructure
Maintaining Achieved In Progress Just Started Not Started

51
Outcome Data – SARTII Infrastructure
Maintaining Achieved In Progress Just Started Not Started

52
Outcome Data – SARTII Infrastructure
Maintaining Achieved In Progress Just Started Not Started

53
Outcome Data – SARTII Infrastructure
Maintaining Achieved In Progress Just Started Not Started

54
Outcome Data – SARTII Implementation
Maintaining Achieved In Progress Just Started Not Started

55
Outcome Data – SARTII Implementation
Maintaining Achieved In Progress Just Started Not Started

56
Outcome Data – SARTII Implementation
Maintaining Achieved In Progress Just Started Not Started

57
Outcome Data – SARTII Growth over time in all areas, except…
Perception of district level support initially increased, but has since decreased Change in personnel Funding Less growth in involving parents Schools reported collecting data on consensus Unsure of the means of data collection – survey?

58
Referral Data Manual Released Training Occurred

59
Referral Data

60
Rubric Ratings Over Time
Though the participant schools began at a higher level of competency, their rate of growth significantly exceeded that of nonparticipating schools, F(1,23)=14.81 , p<.005.
=14.81 , p<.005.")
61
Rubric Analysis Strengths Weaknesses Tier II intervention plans
Universal screening Tier III intervention plans Form is present The target is identified Baseline is appropriate Clearly identified appropriate interventions Interventionist identified Results reported Weaknesses Tier II intervention plans Form Baseline data Progress monitoring plan Goal Setting (Tiers II & III) Sticking to review dates Fidelity review Documentation of referral for evaluation Intervention Review Team Rubric range 0-56
 Sticking to review dates. Fidelity review. Documentation of referral for evaluation. Intervention Review Team. Rubric range")
62
Interview Data: Team Members
Assistant Principal Counselor School Psychologist Special Education Teacher(s) Regular Education Teacher(s) EIP Teacher(s)
 Regular Education Teacher(s) EIP Teacher(s)")
63
Interview Data How did everyone in your school become knowledgeable about the RTI process?
RTI Institute Redelivered training To the entire faculty and staff In smaller groups “On-the-job training… learn while you work the process!” School-based RTI teams (composed of reps from each grade) Monthly grade-level meetings Information provided through s and online
 Monthly grade-level meetings. Information provided through s and online.")
64
Interview Data How on board with RTI would you consider your faculty and staff?
“I’m not sure that they like it, but they’re doing it”(1st grade teacher) More on board with certain tiers than others Consensus is increasing As they see the process work By finding ways to make the whole process more “doable” and, thus, acceptable By requiring staff members to present students who were in need of help to the RTI committee (e.g., their “two lowest in the class”) Ways consensus could be improved If there were explicit rules from the county about what to do If there was more accountability; administration could help with this
 More on board with certain tiers than others. Consensus is increasing. As they see the process work. By finding ways to make the whole process more doable and, thus, acceptable. By requiring staff members to present students who were in need of help to the RTI committee (e.g., their two lowest in the class ) Ways consensus could be improved. If there were explicit rules from the county about what to do. If there was more accountability; administration could help with this.")
65
Interview Data Are the right personnel involved with RTI?
Yes Every grade-level/subject area is represented Every “area” (e.g., counselors, EIP teachers, psychologists) Diverse membership helps in the problem-solving process Previous years’ teachers provide history and context Decisions can be made because the right people are at the meeting No Not all schools have a regular education teacher from each grade-level involved with RTI
 Diverse membership helps in the problem-solving process. Previous years’ teachers provide history and context. Decisions can be made because the right people are at the meeting. No. Not all schools have a regular education teacher from each grade-level involved with RTI.")
66
Interview Data Describe Any Changes You’ve Seen in How Your School Looks at Tier I Data.
Data are accessible to teachers Data are available in a timely manner “We now look at data from more than one program, including benchmarks, STAR, GRASP, and DIBELS, at regular intervals and move students up to Tier II when needed.” (5th grade teacher) “Progress monitoring data is used to direct and reform instruction.” (Assistant Principal)
 Progress monitoring data is used to direct and reform instruction. (Assistant Principal)")
67
Interview Data Describe Any Changes You’ve Seen in How Your School Looks at Tier II/III Data.
Don’t just go by teacher opinion anymore Meetings occur at regular intervals Data are analyzed at each meeting Modifications to goals are made as needed Interventions are modified/changed if they are not working “We have more tools to use as interventions so that we have better data” (4th grade teacher)
")
68
Interview Data What Noticeable Changes in Classroom Practices Have There Been Since RTI Was Implemented? Frequent progress monitoring More interventions to address specific deficits More creative use of time- finding time during the day for intervention Altered schedules to create an extra class period Teachers provide intervention in their areas of strength Increased awareness of behavioral difficulties collecting behavioral data figuring out the reasons behind behavior more aware of and involved in creating BIP’s

69
Interview Data What keeps the RTI process from functioning optimally at your school?
Not enough… Time (also, time management issues) Money Manpower Resources or identified strategies People who have knowledge and/or experience with the RTI process Staff development time/day Accountability
 Money. Manpower. Resources or identified strategies. People who have knowledge and/or experience with the RTI process. Staff development time/day. Accountability.")
70
Interview Data What Keeps the RTI Process from Functioning Optimally at Your School?
Student absences/transiency Group management issues individuals in each group progress at different rates which often results in the need for changes in groups and creation of new groups The time it takes to get a student into tier III or IV, especially for students who have significant issues Lack of increased/intensive intervention once the student moves into Tier III

71
Interview Data What Would Help Your School Do RTI Better?
More… Time for the 3 P’s: planning, providing interventions, and progress monitoring! Money: to purchase resources/interventions and to fund interventionists Manpower: people to provide and monitor interventions Experience in actually implementing the process Intervention resources/updated intervention bank Staff development: days and trainings Psychologist involvement: time to observe, test, and offer suggestions, support, and interventions

72
Interview Data What Would Help Your School Do RTI Better?
Better support system overall A person at each school whose sole responsibility is RTI A person at each grade level who has the time to be primarily responsible for RTI at that grade level Better communication about available resources with other schools in the county with school systems who are doing RTI well Expanded use of certain programs (e.g., Orton-Gillingham for groups in all grade-levels) Explicit guidance from the county office
 Explicit guidance from the county office.")
73
Moving Forward Plans Obstacles Continue to support school efforts
Share our assessment results with the District Establish a collaborative relationship with new district personnel Obstacles Balancing individual teacher needs with collective goals of the school/district Nonparticipating teams are at a disadvantage Consensus in some schools has been hard to establish New district personnel assigned to RTI

74
Exploring the CD

75
Questions

76
Contact Us Michelle.Bolling@carrollcountyschools.com

Similar presentations


>")

 & The IST Process>")


 Progress Monitoring Interventions Tiers Training/Materials Problem Solving Model Allocation of Resources.>")


 in Primary Grades>")
>")