Download presentation
Presentation is loading. Please wait.

1
Please do not talk at this time May 26
Poverty Teach In Thursday! Please turn in your Notebook in to the stage! If you prefer to rip out pages 15 – 25 and staple them, you may. Then turn in current events Public Service announcement in the turn in box. The seniors have been told that all students will have spent some class time getting the information contained in this slide show so they will be familiar with key terms etc. Feel free to edit the slideshow as you see fit. It was created with 9th graders as target audience in terms of use of vocabulary etc. Depending on your approach you can discuss the teach-in first as a jumping off point or reference it throughout the slideshow.

2
Questions to Consider What is poverty?
What does it look like to be poor? Why is there poverty? Where is there poverty? What does a person need to have an adequate standard of living? These are questions for students to solicit students’ ideas and prior knowledge. You can use them as a ‘warm-up’ activity. For the last question the following items probably should be included if the students do not come up with them on their own: Safe and clean housing Affordable and healthy food Affordable transportation Healthcare Opportunities for upward mobility Access to quality education You may want to include a discussion about how standards of living vary from nation to nation, region to region, state to state and city to city.

3
Why does it matter? By understanding what poverty is, we acknowledge its existence. This is the first step to combating the hardships it creates. It brings awareness to the effects of scarcity and how it affects people. Awareness inspires activism.

4
According to the United Nations
“Poverty: a human condition characterized by the sustained or chronic deprivation of the resources, capabilities, choices, security and power necessary for the enjoyment of an adequate standard of living and other civil, cultural, economic, political and social rights.”

5
What does this mean? lack of resources
Lack of materials necessary to survive lack of capabilities and choices Lack of education and skills necessary to choose your future lack of security Consistent exposure to violence and ongoing conflict On this slide and the next one the UN definition has been delineated element by element. Each one is animated so you can have the students try their own breakdown/definition of each element and then provide the basic definition to ensure there is consistency across the classroom and across classrooms

6
What does this mean? lack of adequate standard of living
Safe and clean housing, healthcare and transportation are inaccessible (Standard of Living also encompasses resources, choices and security) lack of rights (civil, cultural, economic, political and social) They are denied to you because of a weak or oppressive government They are inaccessible to you because you are poor (lack an adequate Standard of Living)
 lack of rights (civil, cultural, economic, political and social) They are denied to you because of a weak or oppressive government. They are inaccessible to you because you are poor (lack an adequate Standard of Living)")
7
Why define poverty? The United Nations believes that poverty is as much a denial of natural rights as it is an economic struggle. Recognizing denial of rights is essential to restoring them. Only by knowing exactly what poverty is can we know how to eradicate it.

8
How is the official UN definition used?
Used to identify, assess and act effectively on global situations. Used as a standard or reference point across nations. Commonly measured as an income of $1 to $2 a day. The $1-$2 per day as a ‘standard’ definition of poverty was ‘officially’ established back in the 1990s by the UN in an effort to create a more systematic and holistic approach to combating poverty in terms of program expenditures and targets. You may want to have students think about how much money they spend in a day or a week and compare it to this poverty threshold. So for example you can use the ubiquitous Starbucks example of a single coffee drink being 2 to 3x the poverty threshold.

9
The nations that are in white provide no data but it is safe to say that quite a few of them would be shaded in particularly in Africa, Southeast Asia and the Caribbean. This maps and others like it are generated based on data provided by the UN and NGOs.

10
Who uses this definition?
The following organizations use this definition to help decide how to best reduce poverty: International Organizations: UN: UNICEF, WHO, WFP World Bank IMF Philanthropic Organizations/NGOs: Millennium Campaign ONE Oxfam

11
Who uses this definition?
Governments use this definition to assess social and economic conditions to evaluate and carry out national economic policies and other programs to help the poor both within their own countries and abroad.

12
The United States

13
United States Definition of Poverty
Poverty in the US is officially defined by the US government. The Census Bureau uses a set of money income thresholds to determine who is in poverty. This is money earned before taxes and does not include any non cash benefits such as food stamps. Thresholds are money income “minimums” based on specific details of a family. The "absolute poverty line" is the threshold below which families or individuals are considered to be lacking the resources to meet the basic needs for healthy living; having insufficient income to provide the food, shelter and clothing needed to preserve health. (HHS definition) The last slide is optional and has some information on the history of how these thresholds were developed. They have not been updated since 1964 except to account for inflation. A number of alternatives have been suggested but based on studies conducted by various groups it would seem that these thresholds end up being fairly accurate within 1-2% points as compared to other methods of calculation. The obvious problem with the thresholds is that they do not account for variations of needs and expenses from state to state and region to region.
 The last slide is optional and has some information on the history of how these thresholds were developed. They have not been updated since 1964 except to account for inflation. A number of alternatives have been suggested but based on studies conducted by various groups it would seem that these thresholds end up being fairly accurate within 1-2% points as compared to other methods of calculation. The obvious problem with the thresholds is that they do not account for variations of needs and expenses from state to state and region to region.")
14
2008 Poverty Thresholds, Selected Family Types
How does it all add up? 2008 Poverty Thresholds, Selected Family Types Single Individual Under 65 years $ 11,201 65 years & older $ 10,326 Single Parent One child $ 14,840 Two children $ 17,346 Two Adults No children $ 14,417 $ 17,330 $ 21,834 Three children $ 25,694 Minimum Wage - The federal minimum wage was increased 70 cents in July 2008, the second of three steps to raise it from $5.15 an hour to $7.25 an hour by 2009. If someone works 40 hours per week for 50 weeks a year earning minimum wage are they above or below the thresholds? One activity for the students to do is calculate what it means to work at minimum wage and where it places you on the poverty thresholds. Additional information is the federal minimum wage was $5.15 from 1997 to California’s minimum wage is $8.00 p/h.

16
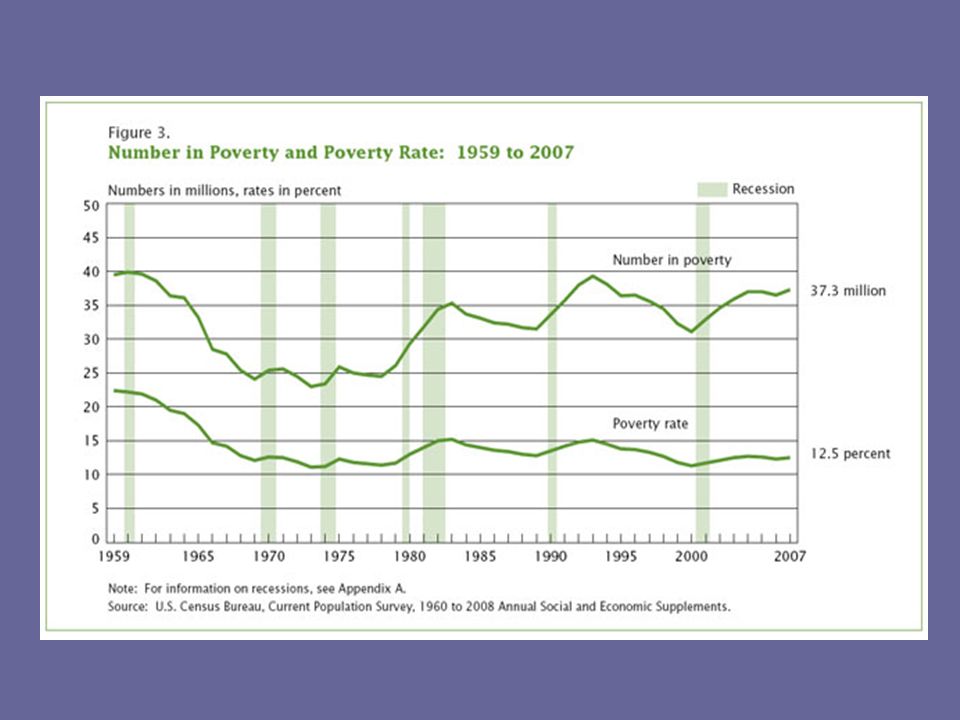
How does it all add up? Health Insurance - About 47 million people (16%) were without health insurance coverage in This included about 9 million children. Federal Programs - In May 2008, food stamp participation of about 28,400,000 persons was up over the prior May by more than 2 million people. Need for Federal Funds - In 2007, 37.3 million people (12.5%) in the United States were in poverty.
 were without health insurance coverage in This included about 9 million children. Federal Programs - In May 2008, food stamp participation of about 28,400,000 persons was up over the prior May by more than 2 million people. Need for Federal Funds - In 2007, 37.3 million people (12.5%) in the United States were in poverty.")
17
Why does the US have an official definition of poverty?
Minimum Wage - The definition of poverty is taken into consideration when the federal government sets the minimum wage. Health Insurance - State and local governments may use the federal poverty definition to determine whether people qualify for state-funded health insurance programs. Federal Programs - The definition of poverty is used to determine eligibility for more than 25 government assistance programs such as the Food Stamp Program, National School Lunch Program. Allocation of Federal Funds - The definition of poverty is also looked at and is used to determine how to distribute Federal dollars in order to benefit the most people. The last bullet point references federal programs that are targeted towards poverty alleviation. So states with higher levels of poverty will receive proportionally higher % of federal dollars for programs such as Food Stamps even if they are proportionally paying fewer federal taxes.

18
Many of the counties in the western states with the highest percentages of poverty match up with the location of Native American reservations. According US Census Bureau data the richest state in the US is Maryland at $65,000 (based on median household income) and the poorest is Mississippi at $34,000 per year. California ranks in the top 10 at $56,000 per year. 6 out of the top 10 poorest states are in the South. 5 out the top 10 richest states are on the east coast (Mid Atlantic to New England).
 and the poorest is Mississippi at $34,000 per year. California ranks in the top 10 at $56,000 per year. 6 out of the top 10 poorest states are in the South. 5 out the top 10 richest states are on the east coast (Mid Atlantic to New England).")
19
Poverty in Mountain View
According to the 2000 Census: 6.8% of the population and 3.6% of families in Mountain View had incomes below the poverty line in 1999. 5.3% of native-born residents live below the poverty line. 7.0% of foreign-born residents live below the poverty line. 7.2% of those under the age of 18 were living below the poverty line. 6% of Mountain View residents are below the poverty line vs. 12% for the whole state. 19

20
Teach-In Essential Questions
What is poverty? Is poverty inevitable? Is poverty best addressed through public or private efforts? You can use these to wrap up the presentation with a Think-Pair-Share discussion.

21
A few ways to understand poverty:
Thresholds developed in by Mollie Orshansky of the Social Security Administration (Original Purpose: To conduct studies about the Department of Agriculture’s food economy analyses) A few ways to understand poverty: -consumption based poverty: (minimum income) -poverty as a failure of capabilities: i.e. one fails to provide x, y, z for themselves. Optional slide.
 A few ways to understand poverty: -consumption based poverty: (minimum income) -poverty as a failure of capabilities: i.e. one fails to provide x, y, z for themselves. Optional slide.")
22
May 27 – 28 Senior Teach In! Seniors will teach the whole school about Poverty.

Similar presentations


 Households Below Average Income ESDS Government FRS.>")

