Download presentation
Presentation is loading. Please wait.

1
COPIOS 2011 17, 18 y 19 de Noviembre de 2011 MULTICRITERIA DECISION AIDING BASED ON CUMULATIVE PROSPECT THEORY: THE TODIM METHOD Luiz Flavio Autran Monteiro Gomes, Ibmec, Av. Presidente Wilson, 118, 11th floor, CEP: , Rio de Janeiro, Brazil, Collaborator: Xavier Ignacio González, School of Engineering, University of Buenos Aires, Av. Las Heras Piso 1º. C1127AAR Buenos Aires, Argentina, Abstract: Introduction. Multicriteria and behavioral decision aiding. The classical TODIM method. Real estate valuation as a multi-criteria problem. Application of the TODIM method to a case study in a Brazilian city. Analysis of results. Conclusions and suggestions for future research.

2
Introduction 1.1. Multicriteria decision aiding Many times human decision problems are considered ill-structured or complex decision problems Participants that are usually involved in a complex human decision process: The decision maker (or decision owner) The decision agents – and those that may be affected by the decision to be made can be included here The decision analyst (a technical person, having a strong background in Management Science, Decision Theory, Decision Sciences, etc.)
 The decision agents – and those that may be affected by the decision to be made can be included here. The decision analyst (a technical person, having a strong background in Management Science, Decision Theory, Decision Sciences, etc.)")
3
Typical characteristics of ill-structured problems:
Criteria for solving them are at least 2, and they conflict one against the other. Criteria and alternatives are not clearly defined, and consequences from choosing one alternative with respect to criteria are not well understood. Criteria and alternatives are interrelated such that one criterion partially implies another; similarly, the effectiveness from selecting one alternative depends on the choice of another (in case they are not mutually exclusive). The solution to the problems depends on a group of people, each having his own point of view. Constraints are not well-defined and many times are intermixed with criteria. Some of the criteria are quantifiable (e.g., in terms of monetary values) while other criteria are hardly quantifiable – except for value judgments or scores along pre-defined scales. Sometimes those scales can be set cardinal (i.e., numerical), ordinal, or verbal, depending upon data that are available.
. The solution to the problems depends on a group of people, each having his own point of view. Constraints are not well-defined and many times are intermixed with criteria. Some of the criteria are quantifiable (e.g., in terms of monetary values) while other criteria are hardly quantifiable – except for value judgments or scores along pre-defined scales. Sometimes those scales can be set cardinal (i.e., numerical), ordinal, or verbal, depending upon data that are available.")
4
Along any human decison process participants use:
Reason Intuition Rationality in a decison process is usually bounded by 3 major factors, inherent to its participants: Their cognitive capacities are finite Their values and personal motivations not always coincide with those of the organization Their knowledgement of the problem to be solved are usually partial

5
In organizations most oftenly we tend to reach a solution that does not equally satisfy all decision criteria as well as all participants in the decision process We therefore search for a satisficing (i.e. not necessarily optimal) solution
 solution.")
6
Decision support (or decision aiding) is indeed
a multicriteria decision aiding ─ in practically all relevant decision problems in the world of organizations we consider at least 2 (and usually more than 2) conflicting criteria There are 3 stages in multicriteria decision aiding: Problem structuring Analysis of the problem (by using at least one multicriteria method) Recommendation (for decision making) Problem structuring advances through interactions among the decision analyst and the other participants in the decision aiding process – and therefore many times multicriteria decision aiding / making is seen as a social and political process
 conflicting criteria. There are 3 stages in multicriteria decision aiding: Problem structuring. Analysis of the problem (by using at least one multicriteria method) Recommendation (for decision making) Problem structuring advances through interactions among the decision analyst and the other participants in the decision aiding process – and therefore many times multicriteria decision aiding / making is seen as a social and political process.")
7
Genesis of multicriteria decision aiding:
Appearance of Operations Research during World War II After WWII, OR starts to be used for tackling non-military (e.g. transportation) problems; large-scale computers In the 60’s and 70’s various real-world problems led OR professionals (here included teachers and researchers) to try to expand their available tool-bag towards solving what were considered as ill-structured problems – complex and ill-defined problems problems (Ex: The population of your community is growing. Your water supply will not support many new people. What do you do?)
 problems; large-scale computers. In the 60’s and 70’s various real-world problems led OR professionals (here included teachers and researchers) to try to expand their available tool-bag towards solving what were considered as ill-structured problems – complex and ill-defined problems problems (Ex: The population of your community is growing. Your water supply will not support many new people. What do you do )")
8
First steps in multicriteria decision aiding:
Until the 60’s (and even after) – naïve weighting Paris, end of the 60’s – genesis of ELECTRE methods (Paris subway) U.S.A., 70’s – academic environment 80’s and 90’s – Boom of methods, setting of foundations Today – a number of methods, either discrete or continuous (also called multicriteria “optimization” methods) for tackling multiple criteria, imprecision, uncertainty, risk, group decision making, etc. Multicriteria methods for decision aid can be used to support individual or group decison making Both types of methods can deal with either crisp or imprecise input data (fuzzy, interval, rough, grey, etc, etc.)
 – naïve weighting. Paris, end of the 60’s – genesis of ELECTRE methods (Paris subway) U.S.A., 70’s – academic environment. 80’s and 90’s – Boom of methods, setting of foundations. Today – a number of methods, either discrete or continuous (also called multicriteria optimization methods) for tackling multiple criteria, imprecision, uncertainty, risk, group decision making, etc. Multicriteria methods for decision aid can be used to support individual or group decison making. Both types of methods can deal with either crisp or imprecise input data (fuzzy, interval, rough, grey, etc, etc.)")
9
It is crucial to recognize that all these methods permit organizing decision processes and making the analyses transparent The correct use of a method can facilitate the exchange of ideas among different participants. Through sensitivity analyses one can test the stability of candidate solutions and through robustness analysis we can check the predictive capability of each method.

10
Some basic discrete methods:
SAW MAUT AHP TOPSIS MACBETH Verbal Decision Analysis ELECTRE UTA PROMÉTHÉE Even Swaps TODIM VIP Analysis

11
1.2. Behavioral decision aiding
Decision aiders can do a much better job if their models are based on a solid behavioral foundation Behavioral decision theory is considered to have formally begun with Ward Edwards 1954 Psychological Bulletin article Behavioral decision theory has been established as “The approach of reflecting on axiomatic frameworks in the domain of descriptive theories (…) geared towards our goal of decision support” (Eisenführ, Weber, and Langer , 2010 or EWL) Cumulative Prospect Theory by Tversky and Kahneman is “currently the most prominent descriptive decision theory under uncertainty” (EWL) Again, according to EWL, “the original Prospect Theory (OPT) from 1979 is only of historical importance today. However, to prevent possible misunderstandings, the cumulative version of Prospect Theory is commonly referred to as CPT” OPT was developed by Daniel Kahneman and Amos Tversky and first published in The term prospect referred to a lottery in the original formulation of that theory. A prospect (x1, p1; …; xn, pn) is a contract that yields outcome xi with probability pi, where p1 +…+ pn = 1.
 geared towards our goal of decision support (Eisenführ, Weber, and Langer , 2010 or EWL) Cumulative Prospect Theory by Tversky and Kahneman is currently the most prominent descriptive decision theory under uncertainty (EWL) Again, according to EWL, the original Prospect Theory (OPT) from 1979 is only of historical importance today. However, to prevent possible misunderstandings, the cumulative version of Prospect Theory is commonly referred to as CPT OPT was developed by Daniel Kahneman and Amos Tversky and first published in The term prospect referred to a lottery in the original formulation of that theory. A prospect (x1, p1; …; xn, pn) is a contract that yields outcome xi with probability pi, where p1 +…+ pn = 1.")
12
With prospect theory Kahneman and Tversky aimed to describe how people choose between probabilistic alternatives and evaluate potential losses and gains defined with respect to a reference point or status quo. Consequently two domains are identified, the domains of gains and the domain of losses. A number of experiments have allowed researchers to conclude that humans tend to show risk-averse behavior in the domain of gains and a risk-seeking behavior in the domain of losses. The difference between CPT and OPT is that weighting is applied to the cumulative probability distribution function, as in rank-dependent Expected Utility Theory, instead of being applied to the probabilities of individual outcomes. CPT is therefore a further development of prospect theory. CPT overcomes some clear limitations that OPT had and, due to its success as a descriptive theory of how people decide when facing risk, it is considered as having more accuracy than Expected Utility Theory as a psychological theory of preferences under risk.

13
Prospect Theory in decision aiding:
The decision aider aim’s is prescriptive – to help determine what a decider should do However, in order to be effective, the aider needs some descriptive understanding of the decision maker mental processes and capabilities This leads us to understanding the difference between the two key decision paradigms: Expected Utility Theory (von Neumann & Morgenstern, 40’s) and Prospect Theory (Kahneman & Tversky, 70’s) While the Expected Utility Theory paradigm is a normative view of decision making, the Prospect Theory paradigm allows describing how people make decisions under risk
 and Prospect Theory (Kahneman & Tversky, 70’s) While the Expected Utility Theory paradigm is a normative view of decision making, the Prospect Theory paradigm allows describing how people make decisions under risk.")
14
Human Decisions are always made under some risk level
The simplest notion of risk is that of a relationship between the chance of occurrence of an undesirable event and the seriousness of the consequences from such an event, it it really occurs In Management, risk has a considerable importance and it has been studied in fields such as Risk Management (Finance) and Risk Analysis (Operations Management) The history of risk is highly intermixed with the history of Probability Theory Human Decisions are always made under some risk level When one is trying to help people that are to make complex decisions, their risk behaviour can not be ignored As human decisions always occur under some uncertainty, it is only natural that decision aiding explicitly takes risk into account
 and Risk Analysis (Operations Management) The history of risk is highly intermixed with the history of Probability Theory. Human Decisions are always made under some risk level. When one is trying to help people that are to make complex decisions, their risk behaviour can not be ignored. As human decisions always occur under some uncertainty, it is only natural that decision aiding explicitly takes risk into account.")
15
Classical (von Neumann) Utility Function
Risk-averse Risk-neutral Risk-prone Risk Classical (von Neumann) Utility Function
 Utility Function.")
16
An example – A city is preparing to fight a rare and highly lethal virus (Problem 1)
fatal cases are expected Program A people are saved Program B there is chance of 1 to 3 of saving people and a chance of 2 to 3 that nobody will be saved Which Program would you implement, A or B?

17
Typical answers that we get from respondents:
72 % prefer Program A 28 % prefer Program B Conclusion: The majority choice (72 %) shows an aversion to risk
 shows an aversion to risk.")
18
Another formulation of the same example (Problem 2)
Program C people die Program D there is a chance of 1 to 3 de that noboby will die and a chance of 2 to 3 that people will die Which Program would you implement, C or D?

19
Again, typical answers that we get from respondents:
22 % prefer Program C 78 % prefer Program D Conclusion: The majority choice (78 %) shows a risk proneness
 shows a risk proneness.")
20
Overall conclusions: When decision problems are formulated in terms of gains, choices are usually risk-averse. When problems are framed in terms of losses, choices tend to be risk-prone. Neverthless, Problems 1 e 2 are absolutely the same.

21
When people have to make decisions under risk, they show a pattern of preferences that is not generally compatible with Expected Utility Theory Prospect Theory provides a broader, descriptive model for understanding how humans make decisions under risk People are risk-averse in the domain of gains and risk-prone in the domain of losses

22
A Prospect Theoretical Value Function
Losses Gains A Prospect Theoretical Value Function

23
But how can we make use of the Prospect Theory paradigm for effective decision aiding?
Models of decision aiding that are based on the Prospect Theory paradigm tend to have a better prospective capability – this is the case of the TODIM method I.e., Prospect Theory-based, multicriteria decision aiding models (e.g., TODIM) are in principle preferable over other types of decision aiding models
 are in principle preferable over other types of decision aiding models.")
24
Previous attempts to use Prospect Theory in multicriteria decision aiding:
Korhonen, Moskowitz and Wallenius (1990) investigated choice behavior in interactive multi-criteria decision making. The validation of Prospect Theory theory made by Korhonen, Moskowitz and Wallenius used a linear approximation to prospect theory. Korhonen, Moskowitz and Wallenius have shown that Tversky’s additive difference model can indeed be regarded as a generalization of prospect theory to the multi-criteria context. Saminen and Wallenius (1993) tested linear prospect theory in a deterministic multi-criteria decision-making environment. These two authors then concluded that prospect theory was a reasonable model of choice for many individuals within the framework of their research. Salminen (1991, 1992, 1994) proposed an interactive method for solving discrete deterministic multi-criteria decision problems and assumed linear prospect theoretical value functions for the decision makers. He approximated the S-shaped value functions of prospect theory by piecewise linear marginal value functions. Salminen’s proposed procedure was therefore valid only for convex preferences. This author pointed out that the major problem in operationalizing OPT was how to find an individual reference alternative. He then proposed as alternative possibilities the current option, the use of aspiration levels and the ideal point, but concluded that there was no unique solution to that problem.
 investigated choice behavior in interactive multi-criteria decision making. The validation of Prospect Theory theory made by Korhonen, Moskowitz and Wallenius used a linear approximation to prospect theory. Korhonen, Moskowitz and Wallenius have shown that Tversky’s additive difference model can indeed be regarded as a generalization of prospect theory to the multi-criteria context. Saminen and Wallenius (1993) tested linear prospect theory in a deterministic multi-criteria decision-making environment. These two authors then concluded that prospect theory was a reasonable model of choice for many individuals within the framework of their research. Salminen (1991, 1992, 1994) proposed an interactive method for solving discrete deterministic multi-criteria decision problems and assumed linear prospect theoretical value functions for the decision makers. He approximated the S-shaped value functions of prospect theory by piecewise linear marginal value functions. Salminen’s proposed procedure was therefore valid only for convex preferences. This author pointed out that the major problem in operationalizing OPT was how to find an individual reference alternative. He then proposed as alternative possibilities the current option, the use of aspiration levels and the ideal point, but concluded that there was no unique solution to that problem.")
25
The TODIM method was formulated in the early 1990s and has been the object of a number of publications since then. Chen et al. (2010) used the TODIM method for solving interval multi-criteria decision-making problems. These last authors concluded that their proposed TODIM-based method for dealing with interval numbers accurately describes human decision-making behavior in reality, besides being computationally simple. TODIM is based on nonlinear prospect theory as the shape of its value function is the same as the gains/losses function of prospect theory. Gains and losses in prospect theory are always referred to a reference point. When using TODIM paired comparisons between criteria are performed and one criterion is taken as the reference point of each other criterion. The mathematical formulation of the so-called classical TODIM method follows.
 used the TODIM method for solving interval multi-criteria decision-making problems. These last authors concluded that their proposed TODIM-based method for dealing with interval numbers accurately describes human decision-making behavior in reality, besides being computationally simple. TODIM is based on nonlinear prospect theory as the shape of its value function is the same as the gains/losses function of prospect theory. Gains and losses in prospect theory are always referred to a reference point. When using TODIM paired comparisons between criteria are performed and one criterion is taken as the reference point of each other criterion. The mathematical formulation of the so-called classical TODIM method follows..")
26
1.3. The classical TODIM method
The TODIM (an acronym in Portuguese for Interactive and Multicriteria Decision Making) method is a discrete multicriteria method founded on Prospect Theory The multiattribute value function of TODIM is built in parts, with their mathematical descriptions reproducing the gain/loss function of Prospect Theory. The global multiattribute value function of TODIM aggregates all measures of gains and losses over all criteria; that function is based on Tversky’s idea of an additive difference function Being founded on Prospect Theory , TODIM can either use a status quo, reference alternative or the concept of a floating reference alternative Getting the weights of criteria (all equal in this application) Choosing a reference criterion Valuation of the alternatives in relation to each criterion, with normalization by dividing each weight by largest weight for each criterion Computing a matrix of relative dominance Calculation of the measurements of the overall desirability of each alternative Sensitivity analysis An Excel®-based spreadsheet for calculations and for producing graphs
 method is a discrete multicriteria method founded on Prospect Theory. The multiattribute value function of TODIM is built in parts, with their mathematical descriptions reproducing the gain/loss function of Prospect Theory. The global multiattribute value function of TODIM aggregates all measures of gains and losses over all criteria; that function is based on Tversky’s idea of an additive difference function. Being founded on Prospect Theory , TODIM can either use a status quo, reference alternative or the concept of a floating reference alternative. Getting the weights of criteria (all equal in this application) Choosing a reference criterion. Valuation of the alternatives in relation to each criterion, with normalization by dividing each weight by largest weight for each criterion. Computing a matrix of relative dominance. Calculation of the measurements of the overall desirability of each alternative. Sensitivity analysis. An Excel®-based spreadsheet for calculations and for producing graphs.")
27
Measure of relative dominance of each alternative i over another alternative j:
Variables and parameters of TODIM: (i,j) – dominance measurement of an alternative i in relation to another alternative j c (i, j) – measure of value of alternative I as compared against alternative j according to criterion c arc – substitution rate for criterion c as compared against criterion r wic and wjc – valuations of alternatives i and j according to criterion c – attenuation factor, applicable to the segment of the value function in the negative quadrant i – overall desirability of each alternative
 – dominance measurement of an alternative i in relation to another alternative j. c (i, j) – measure of value of alternative I as compared against alternative j according to criterion c. arc – substitution rate for criterion c as compared against criterion r. wic and wjc – valuations of alternatives i and j according to criterion c. – attenuation factor, applicable to the segment of the value function in the negative quadrant. i – overall desirability of each alternative.")
28
Gain, no gain & no loss, and Loss parts of the value function:

29
Desirability of each alternative:
The function c reproduces the value function of OPT and replicates the most relevant shape characteristics. That function fulfills the concavity for positive outcomes (convexity for negative outcomes) and it enlarges the perception of negative values for losses than positive values for gains, both value functions are steeper for negative outcomes than for positive ones. Each shape characteristic of the value function models psychological processes: the concavity for gains describes a risk aversion attitude, the convexity describes a risk seeking attitude; the assumption that losses carry more weight than gains is represented by a steeper negative function side.
 and it enlarges the perception of negative values for losses than positive values for gains, both value functions are steeper for negative outcomes than for positive ones. Each shape characteristic of the value function models psychological processes: the concavity for gains describes a risk aversion attitude, the convexity describes a risk seeking attitude; the assumption that losses carry more weight than gains is represented by a steeper negative function side.")
30
When introducing the CPT in 1992,Tversky & Kahneman define the subjective value ν of an outcome x, as a two-part power function of the form: α quantifies the curvature of the subjective value function for gains, β does for losses, and the parameter λ quantifies the loss aversion. For α, β < 1, the value function exhibits risk aversion over gains and risk seeking over losses. Furthermore, if λ, the loss-aversion coefficient, is greater than one, individuals are more sensitive to losses than gains.

31
A more general parametric form of the function c follows:
The classical formulation of TODIM’s value function is indeed a particular case of the more general Tversky and Kahneman’s CPT where α=0.5 and λ=1/ θ. A more general parametric form of the function c follows:

32
We can therefore say that the formulation of TODIM in terms of CPT is
Different kinds of decision makers can be understood in terms of their risk and loss attitude. Although the TODIM method does not deal with risk directly, the way the decision maker evaluates the outcomes of any decision can be expressed by their risk attitude: for instance, a cautious decision maker will undervalue a superior result more than a braver one. Apart from parameter , the attenuation factor of the losses, function c does not offer other parameters to delineate the behavior of diverse decision makers, therefore a generic formulation is proposed. It can be shown that the ratio arc/(∑arc) can be interpreted as a probability. This allows us to make full use of CPT, including its decision weights. We can therefore say that the formulation of TODIM in terms of CPT is indeed a formulation in terms of the concept of capacity. Here a capacity is a non-additive set function that generalizes the standard notion of probability. Capacities are also known under the name of fuzzy measures.
 can be interpreted as a probability. This allows us to make full use of CPT, including its decision weights. We can therefore say that the formulation of TODIM in terms of CPT is. indeed a formulation in terms of the concept of capacity. Here a capacity is a non-additive set function that generalizes the standard notion of probability. Capacities are also known under the name of fuzzy measures.")
33
Some publications in English on the classical TODIM method:
RANGEL, L.A.D.; GOMES, L.F.A.M.; CARDOSO, F. P. An application of the TODIM method to the evaluation of broadband Internet plans. Pesquisa Operacional , v. 31, p , 2011. MOSHKOVICH, H.; GOMES, L.F.A.M.; MECHITOV, A.I. An integrated multicriteria decision-making approach to real estate evaluation: case of the TODIM method. Pesquisa Operacional , v. 31, p. 3-20, 2011. GOMES, C.F.S.; GOMES, L.F.A.M.; MARANHÃO, F.J.C. Decision analysis for the exploration of gas reserves: merging TODIM and THOR. Pesquisa Operacional , v. 30, p , 2010. CHEN, F.-d.; ZHANG, X.; Kang, F.; FAN, Z.-p. and CHEN, X. A Method for Interval Multiple Attribute Decision Making With Loss Aversion International Conference of Information Science and Management Engineering, IEEE Computer Society, , 2010. GOMES, L. F. A. M. ; RANGEL, L.A.D. An Application of the TODIM Method to the Multicriteria Rental Evaluation of Residential Properties. European Journal of Operational Research, v. 193, p , 2009. GOMES, L. F. A. M.; GOMES, LC.F.S.; RANGEL, L.A.D. A comparative decision analysis with THOR and TODIM: rental evaluation in Volta Redonda. Revista Tecnologia , v. 30, p. 7-11, 2009. GOMES, L. F. A. M. ; RANGEL, L.A.D.; MARANHÃO, F. J. C. Multicriteria Analysis of Natural Gas Destination in Brazil: An application of the TODIM Method. Mathematical and Computer Modelling, v. 50, p , 2009. F.F. NOBRE, F.F; L.T.F. TROTTA, L.T.F.; GOMES, L.F.A.M. Multi-criteria decision making – an approach to setting priorities in health care. Statistics in Medicine, v. 18, p , 1999. GOMES, L.F.A.M.; LIMA, M.M.P.P. From Modelling Individual Preferences to Multicriteria Ranking of Discrete Alternatives: A Look at Prospect Theory and the Additive Difference Model. Foundations of Computing and Decision Sciences, v. 17, p , 1992. GOMES, L.F.A.M.; LIMA, M.M.P.P. TODIM: Basics and Application to Multicriteria Ranking of Projects with Environmental Impacts. Foundations of Computing and Decision Sciences, v. 16, p , 1992.

34
2. An application case study: real estate valuation in Volta Redonda
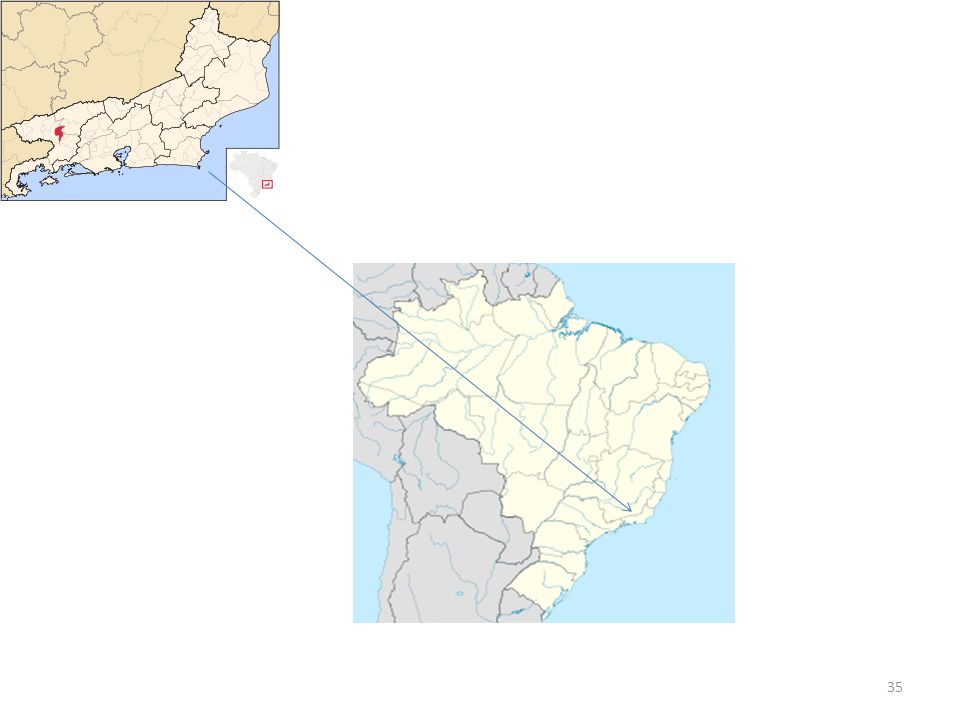
2.1. Problem definition and input data The case study is a valuation of residential properties carried out by real estate agents in the city of Volta Redonda, Brazil. Fifteen properties in different neighborhoods were analyzed as alternatives and a total of eight evaluation criteria were identified. A detailed description of the alternatives and criteria can be found in Gomes and Rangel (2009). The initial weights assigned to the criteria used to evaluate the properties were defined by decision makers (i.e., the real estate agents), assigning a number between 1 and 5 to each criterion where 1 would mean ‘least important’ and 5 would mean ‘most important’.
. The initial weights assigned to the criteria used to evaluate the properties were defined by decision makers (i.e., the real estate agents), assigning a number between 1 and 5 to each criterion where 1 would mean ‘least important’ and 5 would mean ‘most important’.")
36
Alternatives: A1 – A house in an average location, with 290 m2 of constructed area, a high standard of finishing, in a good state of conservation, with one garage space, 6 rooms, a swimming pool, barbecue and other attractions, without a security system. A2 – A house in a good location, with 180 m2 of constructed area, an average standard of finishing, in an average state of conservation, with one garage space, 4 rooms, a backyard and terrace without a security system. A3 – A house in an average location, with 347 m2 of constructed area, a low standard of finishing, in an average state of conservation, two garage spaces, 5 rooms, a large backyard, without a security system. A4 – A house in an average location, with 124 m2 of constructed area, an average standard of finishing, in a good state of conservation, two garage spaces, 5 rooms, a fruit orchard, a swimming pool and barbecue, without security system. A5 – A house in an excellent location, with 360 m2 of constructed area, a high standard of finishing, in a very good state of conservation, four garage spaces, 9 rooms, a backyard and manned security boxes in the neighborhood streets. A6 – A house located between the periphery and the city center (periphery/average location) with 89 m2 of constructed area, an average standard of finishing, in a good state of conservation, with one garage space, 5 rooms, a backyard, without a security system. A7 – An apartment located in the periphery, with 85 m2 of constructed area, a low standard of finishing, in a bad state of conservation, one garage space, 4 rooms, a manned entrance hall with security. A8 – An apartment in an excellent location, with 80 m2 of constructed area, average standard of finishing, good state of conservation, with one garage space, 6 rooms, manned entrance hall with security. A9 – An apartment located between the periphery and the city center (periphery/average location), with 121 m2 of constructed area, an average standard of finishing, in a good state of conservation, no garage space, 6 rooms, without a security system. A10 – A house located between the periphery and the city center (periphery/average location), with 120 m2 of constructed area, a low standard of finishing, in a good state of conservation, with one garage space, 5 rooms, a large backyard, without a security system. A11 – A house in a good location, with 280 m2 of constructed area, an average standard of finishing, in an average state of conservation, with two garage spaces, 7 rooms, with an additional security system. A12 – An apartment located in the periphery, with 90 m2 of constructed area, a low standard of finishing, in a bad state of conservation, one garage space, 5 rooms, without additional security. A13 – An apartment located in the periphery in an average location, with 160 m2 of constructed area, a high standard of finishing, in a good state of conservation, two garage spaces, 6 rooms, with additional security features. A14 – An apartment in a good location, with 320 m2 of constructed area, high standard of finishing, in a good state of conservation, 2 garage spaces, 8 rooms, with in addition a security system. A15 – A house in a good location, with 180 m2 of constructed area, an average standard of finishing, in a very good state of conservation, one garage space, 6 rooms, with in addition a security system.
 with 89 m2 of constructed area, an average standard of finishing, in a good state of conservation, with one garage space, 5 rooms, a backyard, without a security system. A7 – An apartment located in the periphery, with 85 m2 of constructed area, a low standard of finishing, in a bad state of conservation, one garage space, 4 rooms, a manned entrance hall with security. A8 – An apartment in an excellent location, with 80 m2 of constructed area, average standard of finishing, good state of conservation, with one garage space, 6 rooms, manned entrance hall with security. A9 – An apartment located between the periphery and the city center (periphery/average location), with 121 m2 of constructed area, an average standard of finishing, in a good state of conservation, no garage space, 6 rooms, without a security system. A10 – A house located between the periphery and the city center (periphery/average location), with 120 m2 of constructed area, a low standard of finishing, in a good state of conservation, with one garage space, 5 rooms, a large backyard, without a security system. A11 – A house in a good location, with 280 m2 of constructed area, an average standard of finishing, in an average state of conservation, with two garage spaces, 7 rooms, with an additional security system. A12 – An apartment located in the periphery, with 90 m2 of constructed area, a low standard of finishing, in a bad state of conservation, one garage space, 5 rooms, without additional security. A13 – An apartment located in the periphery in an average location, with 160 m2 of constructed area, a high standard of finishing, in a good state of conservation, two garage spaces, 6 rooms, with additional security features. A14 – An apartment in a good location, with 320 m2 of constructed area, high standard of finishing, in a good state of conservation, 2 garage spaces, 8 rooms, with in addition a security system. A15 – A house in a good location, with 180 m2 of constructed area, an average standard of finishing, in a very good state of conservation, one garage space, 6 rooms, with in addition a security system.")
37
Quality of construction 2 0.1 C4 State of conservation 4 0.2 C5
Criteria weights Criterion Description Assigned weights C1 Localization 5 0.25 C2 Construction area 3 0.15 C3 Quality of construction 2 0.1 C4 State of conservation 4 0.2 C5 Number of garage spaces 1 0.05 C6 Number of rooms C7 Attractions C8 Security

38
Evaluation matrix C1 C2 C3 C4 C5 C6 C7 C8 A1 3 290 1 6 4 A2 180 2 A3
Alternative C1 C2 C3 C4 C5 C6 C7 C8 A1 3 290 1 6 4 A2 180 2 A3 347 5 A4 124 A5 360 9 A6 89 A7 85 A8 80 A9 121 A10 120 A11 280 7 A12 90 A13 160 A14 320 8 A15

39
Normalized global performance value
2.2. Results from computations Final values and ranks Alternative Normalized global performance value TODIM-CPT TODIM-OPT A1 0.589 6 5 A2 0.366 10 A3 0.372 9 A4 0.477 8 7 A5 1.000 1 A6 0.225 11 A7 0.133 14 15 A8 0.586 A9 0.167 13 A10 0.198 12 A11 0.773 3 A12 0.000 A13 0.601 4 A14 0.821 2 A15 0.715

40
Overall rankings by fixing and making vary
Alternative = 2.25 = 0.76 = 0.82 = 0.88 = 0.94 = 1 A1 5 6 7 A2 10 A3 9 A4 8 A5 1 A6 11 A7 14 13 A8 A9 A10 12 A11 3 A12 15 A13 A14 2 A15 4

41
Overall rankings by fixing and making vary
Alternative = 0.88 = 1 = 2.25 = 3.5 A1 6 A2 10 9 A3 A4 8 A5 1 A6 11 A7 12 14 A8 5 7 A9 13 A10 A11 3 A12 15 A13 A14 2 A15 4

42
2.3. Conclusions It can be verified that alternatives A1, A8 and A13 are ranked in either the 5th, the 6th and the 7th positions as the and α parameters vary. Alternative A1 rises to the fifth position in the overall ranking and alternative A13 falls from 5th to 6th position as the alpha decreases. We can say that A13 is a more balanced alternative than A1 as the evaluation is lower intermediate over most of criteria. On the other hand, A1 is more unbalanced than A13. This presentation has shown that the multicriteria analysis with the TODIM method naturally evolves from OPT to CPT as its bases. This has been accomplished through a numerical application example by using the original version of the TODIM method (that is, TODIM-OPT) and the new, extended version of that method (i.e., TODIM-CPT).
 and the new, extended version of that method (i.e., TODIM-CPT).")
43
3. Suggestions for future research
Using both the Choquet and Sugeno integrals for reducing the data needed and also for learning more from actual uses of TODIM. Tackling situations where input data on preferences are either entirely unavailable or only partially available and the decision analyst still wants to use TODIM for providing a framework on which an analysis can be based. This case can then be treated as in inverse problem and therefore approached by Monte Carlo simulation. This will lead to a SMAA-P method following Lahdelma and Salminen (2009). Extending the TODIM method to situations when input data are not only crisp, but also liable to be described by interval or by fuzzy numbers.
. Extending the TODIM method to situations when input data are not only crisp, but also liable to be described by interval or by fuzzy numbers.")
44
Other references: Choquet, G. Theory of capacities. Annales de l’ Institut Fourier, 5, 1953, Edwards, W. The Theory of Decision Making. Psychological Bulletin, 41, 1954, Eisenführ, F.; Weber, M.; and Langer, T. Rational Decision Making. 2010, Berlin: Springer-Verlag. Grabisch, M.; Labreuche, C. A decade of application of the Choquet and Sugeno integrals in multi-criteria decision aid. Annals of Operations Research 175, 1, 2010, Kahneman, D. and Tversky, A. Prospect theory: an analysis of decision under risk, Econometrica 47 (1979) Korhonen, P.; Moskowitz, H.; and Wallenius, J. Choice Behavior in Interactive Multiple Criteria Decision-Making. Annals of Operations Research 23, 1990, Korhonen, P.; Wallenius, J. Letter to the editor Behavioral issues in MCDM: neglected research questions. Journal of Multi-Criteria Decision Analysis, Vol. 5, 1996, Lahdelma, R. and Salminen, P. Prospect Theory and Stochastic Multicriteria Acceptability Analysis (SMAA). Omega 37, 2009, Oliveira, Jr, H.A.; Caldeira, A.; Machado, M.A.S; Souza, R.C. and Tanscheit, R. Computation Intelligence Applied to Management, Economics and Engineering in Matlab. São Paulo: Thomson Learning, 2007. Phillips, L.D. and von Winterfeldt, D. Reflections on the Contributions of Ward Edwards to Decision Analysis and Behavioral Research. In: Edwards, W.; Miles, Jr., R.; and von Winterfeldt, D. (eds) Advances in Decision Analysis From Foundations to Applications, , Cambridge: Cambridge University Press. Salminen, P. Descriptive and Prescriptive Modelling of Preferences within a Discrete Alternative Multiple Criteria Decision Framework. Jyväskylä Studies in Computer Science, Economics and Statistics 19, 1992, University of Jyväskylä. Sugeno, M. (1974) Theory of fuzzy integrals and its applications. PhD thesis. Tokyo Institute of Technology. Tversky, A. and Kahneman, D. Advances in Prospect Theory, Cumulative Representation of Uncertainty. Journal of Risk and Uncertainty 5, 1992,
 Korhonen, P.; Moskowitz, H.; and Wallenius, J. Choice Behavior in Interactive Multiple Criteria Decision-Making. Annals of Operations Research 23, 1990, Korhonen, P.; Wallenius, J. Letter to the editor Behavioral issues in MCDM: neglected research questions. Journal of Multi-Criteria Decision Analysis, Vol. 5, 1996, Lahdelma, R. and Salminen, P. Prospect Theory and Stochastic Multicriteria Acceptability Analysis (SMAA). Omega 37, 2009, Oliveira, Jr, H.A.; Caldeira, A.; Machado, M.A.S; Souza, R.C. and Tanscheit, R. Computation Intelligence Applied to Management, Economics and Engineering in Matlab. São Paulo: Thomson Learning, Phillips, L.D. and von Winterfeldt, D. Reflections on the Contributions of Ward Edwards to Decision Analysis and Behavioral Research. In: Edwards, W.; Miles, Jr., R.; and von Winterfeldt, D. (eds) Advances in Decision Analysis From Foundations to Applications, , Cambridge: Cambridge University Press. Salminen, P. Descriptive and Prescriptive Modelling of Preferences within a Discrete Alternative Multiple Criteria Decision Framework. Jyväskylä Studies in Computer Science, Economics and Statistics 19, 1992, University of Jyväskylä. Sugeno, M. (1974) Theory of fuzzy integrals and its applications. PhD thesis. Tokyo Institute of Technology. Tversky, A. and Kahneman, D. Advances in Prospect Theory, Cumulative Representation of Uncertainty. Journal of Risk and Uncertainty 5, 1992,")
45
Muchas gracias! Acknowledgements Preparing this presentation was partially supported by the National Council for Scientific and Technological Development (CNPq) of Brazil through Process No /
 of Brazil through Process No /")
Similar presentations
: GOMES, L.F.A.M.;MACHADO, M.A.S.; COSTA, F.F. &>")


 address: Telephone: (27) 2233 Dont hesitate to get in touch.>")
 Chapter 17 Decision Making.>")


 by Simplex method for bounded variables.>")

 Motion Controller Design for A Class of Second-order Systems Center for Self-Organizing Intelligent.>")

