Download presentation
Presentation is loading. Please wait.

2
Executive Summary This study is based on data compiled
from 1,134 cases of occupational fraud that were investigated between January 2004 and January 2006. Information from each case was reported by a Certified Fraud Examiner who investigated the case.

3
Executive Summary Occupational fraud and abuse imposes enormous costs on organizations. The median loss caused by the occupational frauds in this study was $159,000. Nearly one-quarter of the cases caused at least $1 million in losses and nine cases caused losses of $1 billion or more. Participants in our study estimate U.S. organizations lose 5% of their annual revenues to fraud. Applied to the estimated 2006 United States Gross Domestic Product, this 5% figure would translate to approximately $652 billion in fraud losses. In 2004, participants estimated 6% of revenue was lost to fraud. Occupational fraud schemes can be very difficult to detect. The median length of the schemes in our study was 18 months from the time the fraud began until the time it was detected.

4
Executive Summary Our data supports the use of confidential hotlines and other reporting mechanisms as a fraud detection tool. Occupational frauds are more likely to be detected by a tip than by other means such as internal audits, external audits or internal controls. The importance of encouraging tips is evident in cases involving losses of $1 million or more. Forty-four percent of the million-dollar frauds in this study were detected by tips. This is more than twice the rate of detection by internal audits and three times the rate of detection by external audits. Certain anti-fraud controls can have a measurable impact on an organization’s exposure to fraud. In the cases we reviewed, organizations that had anonymous fraud hotlines suffered a median loss of $100,000, whereas organizations without hotlines had a median loss of $200,000. We found similar reductions in fraud losses for organizations that had internal audit departments, that regularly performed surprise audits, and that conducted anti-fraud training for their employees and managers.

5
Executive Summary This Report includes organizations representing a wide range of industries. The industries with the highest median losses per scheme were wholesale trade ($1 million), construction ($500,000) and manufacturing ($413,000). Government organizations ($82,000) and retail organizations ($80,000) were among those with the lowest median losses. Small businesses continue to suffer disproportionate fraud losses. The median loss suffered by organizations with fewer than 100 employees was $190,000 per scheme. This was higher than the median loss in even the largest organizations. The most common occupational frauds in small businesses involve employees fraudulently writing company checks, skimming revenues, and processing fraudulent invoices.
, construction ($500,000) and manufacturing ($413,000). Government organizations ($82,000) and retail organizations ($80,000) were among those with the lowest median losses. Small businesses continue to suffer disproportionate fraud losses. The median loss suffered by organizations with fewer than 100 employees was $190,000 per scheme. This was higher than the median loss in even the largest organizations. The most common occupational frauds in small businesses involve employees fraudulently writing company checks, skimming revenues, and processing fraudulent invoices.")
6
Executive Summary One reason small businesses suffer such high fraud losses is that they generally do a poor job of proactively detecting fraud. Less than 10% of small businesses had anonymous fraud reporting systems, and less than 20% had internal audit departments, conducted surprise audits, or conducted fraud training for their employees and managers. This helps explain why more small business frauds were detected by accident than by any other means. The size of the loss caused by occupational fraud is strongly related to the position of the perpetrator. Frauds committed by owners or executives caused a median loss of $1 million. This is nearly five times more than the median loss caused by managers, and almost 13 times as large as the median loss caused by employees.

7
Executive Summary Most of the occupational fraud schemes in our study involved either the accounting department or upper management. Just over 30% of the occupational frauds were committed by employees in the accounting department, and slightly more than 20% were committed by upper management or executive-level employees. The next-most-commonly cited department was sales, which accounted for 14% of the cases in our study. Nearly two-thirds of the victim organizations in our study routinely conducted background checks on new employees. However, less than 8% of the perpetrators had convictions prior to committing their frauds. Although background checks on new employees can be a valuable anti-fraud tool, our data suggests that other measures such as fraud training, surprise audits and anonymous reporting mechanisms can have a more significant impact in detecting fraud.

8
Introduction The term “occupational fraud” may be defined as:
The use of one’s occupation for personal enrichment through the deliberate misuse or misapplication of the employing organization’s resources or assets.”

9
Introduction This definition is very broad, encompassing a wide range of misconduct by employees, managers, and executives. Occupational fraud schemes can be as simple as pilferage of company supplies or as complex as sophisticated financial statement frauds. All occupational fraud schemes have four key elements in common. The activity: Is clandestine; Violates the perpetrator’s fiduciary duties to the victim organization; Is committed for the purpose of direct or indirect financial benefit to the perpetrator; and Costs the employing organization assets, revenue or reserves.

10
Introduction In 1996, the ACFE released the first Report to the Nation on Occupational Fraud and Abuse, which shed light on the immense and largely undefined costs that occupational fraud imposes on organizations. The stated goals of the first Report were to: Summarize the opinions of experts on the percentage and amount of organizational revenue lost to all forms of occupational fraud and abuse; Examine the characteristics of the employees who commit occupational fraud and abuse; Determine what kinds of organizations are victims of occupational fraud and abuse; and Categorize the ways in which serious fraud and abuse occurs.

11
Introduction All of the enumerated goals of the first Report fell under one larger and more all- encompassing mission: to better educate the public and anti-fraud professionals about the threat of occupational fraud. Since that time, with each subsequent edition of the Report to the Nation, that has remained our primary goal. At the time the 1996 Report was released – five years before the string of financial statement frauds highlighted by Enron and WorldCom — there was surprisingly little research available on how occupational fraud impacted companies and government agencies; this despite the fact that practical experience and anecdotal evidence clearly indicated that the problem was one of enormous severity. After we released the 1996 Report, we received a tremendous response from anti- fraud professionals, many of whom for the first time had hard data to support what they already knew or suspected — that occupational fraud was a significant threat to their organizations.

12
Introduction We released updated editions of the Report in 2002 and Like the first study, each subsequent edition was based on detailed case information about specific frauds provided by the CFEs who investigated those cases. Each Report has been structured along the same lines, focusing on the methods used by employees, managers, and executives to defraud their organizations; the losses caused by those frauds; and the characteristics of both the perpetrators and the victims of these crimes. The current edition of the Report is based on 1,134 actual cases of occupational fraud — more than twice the number that made up the data set in our 2004 Report. The increased number of cases has allowed us to analyze the data in a more detailed and thorough manner than in any previous edition of the Report to the Nation. For the first time, we are able to provide detailed data about how specific methods of fraud affect various industries and also how those methods are related to particular departments or job types within organizations.

13
Introduction We also made a significant change in our methodology that should be noted. In past editions of the Report, we asked respondents to provide a detailed report on any one case they had investigated within the relevant time frame. In our 2006 survey, we asked respondents to report on the largest case they had investigated in the past two years. We included this criterion because we believe that in studying how fraud affects organizations, where a limited number of cases can be analyzed, it makes sense to focus on the cases that cause the most harm.

14
Introduction Because of the change in survey methodology, we are not including any data in this Report comparing fraud losses to those from previous studies. A complete statement of our methodology in this study is contained at the end of this Report. We believe the current Report will prove to be the most illuminating and useful edition to date. It is our hope that the information contained herein will provide valuable insights to any person or organization concerned with detecting, deterring, or preventing occupational fraud and abuse.

15
Measuring the Cost of Occupational Fraud
At the outset, it should be clear to anyone who has spent time dealing with the subject of occupational fraud that attempts to accurately measure the frequency or cost associated with occupational fraud in the United States will be, at best, incomplete.

16
Measuring the Cost of Occupational Fraud
Regardless of what the exact cost of fraud is, we know it is enormous. We examined over 1,100 cases of occupational fraud that were investigated over the last two years. The median dollar loss caused by these schemes was $159,000. As the following chart illustrates, nearly one-fourth of the cases in our study (24.4%) caused losses of $1 million or more. Although not shown in the chart as a separate category, there were nine cases with reported losses of at least $1 billion.
 caused losses of $1 million or more. Although not shown in the chart as a separate category, there were nine cases with reported losses of at least $1 billion.")
18
How Occupational Fraud is Committed
As was first stated in the 1996 Report to the Nation, all occupational frauds fall into one of three major categories: Asset misappropriation Corruption Fraudulent statements

19
How Occupational Fraud is Committed
Asset misappropriations were by far the most common type of occupational fraud in our study, occurring in over 90% of all cases. Meanwhile, cases involving financial statement fraud were the least common, but had the largest impact when they did occur. The median loss of $2 million in schemes involving financial statement frauds was 13 times greater than the median loss for schemes involving asset misappropriations and nearly four times greater than the median loss in cases that involved corruption.2 2For cases that involved more than one major category of occupational fraud, we were unable to subdivide the losses to determine exactly how much was attributable to each of the component schemes.

20
3The sum of percentages in this table exceeds 100% because several cases involved schemes that fell into more than one category.

21
How Occupational Fraud is Committed
While the three major categories are distinct in the sense that they each involve a specific aspect of fraud, it is important to note that within a given occupational fraud scheme, the perpetrator or perpetrators will often engage in several different forms of illegal conduct. Thus, a single occupational fraud scheme might involve elements of each of the three major categories. The following table illustrates the distribution of cases based on the categories of fraud that were committed.

23
How Occupational Fraud is Committed
Overall, approximately one-third of the cases in our study involved more than one category of fraud. The most notable correlation between two categories was the strong tie between corruption and asset misappropriation schemes. As we see in the corruption column of the table above, 89.4% of the corruption cases also involved an asset misappropriation of some sort. (75.4% of cases were classified as corruption and asset misappropriation, plus 14% of cases involved all three categories.) A typical example is a case in which an employee accepts kickbacks or other bribes from a vendor in order to process invoices for fictitious goods or services. This type of fraud clearly involves an element of corruption (the acceptance of a bribe), but also involves an element of asset misappropriation as well (causing the victim organization to issue payment for nonexistent goods or services).
 A typical example is a case in which an employee accepts kickbacks or other bribes from a vendor in order to process invoices for fictitious goods or services. This type of fraud clearly involves an element of corruption (the acceptance of a bribe), but also involves an element of asset misappropriation as well (causing the victim organization to issue payment for nonexistent goods or services).")
24
How Occupational Fraud is Committed
As the data on the previous page show, asset misappropriations are by far the most common form of occupational fraud. Over 90% of the cases we reviewed involved some form of asset misappropriation, which is consistent with data from our studies in 2004 and 2002. As one would expect, the asset that fraudsters target most often is cash (the term cash includes not only currency, but also checks and money orders). There were 1,038 cases of asset misappropriation in our study, and 910 of those (87.7%) involved the misappropriation of cash. A little less than one-fourth of the cases we reviewed involved the misappropriation of non-cash assets such as inventory, equipment or proprietary information. The median loss in schemes targeting non-cash assets was $200,000, which was slightly higher than the median loss in frauds involving cash misappropriation.
. There were 1,038 cases of asset misappropriation in our study, and 910 of those (87.7%) involved the misappropriation of cash. A little less than one-fourth of the cases we reviewed involved the misappropriation of non-cash assets such as inventory, equipment or proprietary information. The median loss in schemes targeting non-cash assets was $200,000, which was slightly higher than the median loss in frauds involving cash misappropriation.")
25
4The sum of percentages in this chart exceeds 100% because a number of cases involved the misappropriation of both cash and non-cash assets. In those cases, we were unable to subdivide the losses to determine exactly how much was attributable to cash vs. non-cash schemes.

26
How Occupational Fraud is Committed
How Cash is Misappropriated Cash Receipts and Cash on Hand Based on past studies and research, we identified eight common methods by which fraudsters steal cash from their employers. Two schemes — cash larceny and skimming — target incoming receipts or cash on hand. The following table provides a summary of each scheme along with its relative frequency and median loss. Skimming was slightly more common than cash larceny; approximately 19% of the asset misappropriation cases in our study involved skimming. Skimming also had a slightly higher median loss at $76,000 as opposed to $73,000 for cash larceny.

27
How Occupational Fraud is Committed
Fraudulent Disbursements The remaining six cash schemes target outgoing disbursements of cash. They are: billing schemes, payroll schemes, expense reimbursements, check tampering, wire transfers and register disbursements. Billing schemes were the most common form of fraudulent disbursement, occurring in over one-quarter of all the asset misappropriation cases in our study. The median loss attributed to billing schemes was $130,000, making them the second most expensive form of fraudulent disbursement behind wire transfers, which had a median loss of $500,000. Expense reimbursements ranked second in terms of frequency, but they had the lowest median loss at $25,000.

29
How Occupational Fraud is Committed
How Non-Cash Assets are Misappropriated There were 243 cases that involved the theft or misappropriation of non-cash assets. The majority of these schemes involved the theft of inventory or other physical assets such as equipment and supplies. A smaller proportion targeted proprietary information or securities, but these schemes had higher median losses. For instance, although there were only 16 cases in our study involving the theft of securities, the median loss in these cases was $1.85 million.

31
How Occupational Fraud is Committed
How Financial Statements Are Falsified Financial statement fraud was much less common than asset misappropriations. There were 120 reported cases of financial statement fraud, accounting for just over 10% of all cases. This proportion is consistent with our earlier studies. While financial statement fraud is not nearly as common as asset misappropriations, its consequences tend to be much more severe. As was stated above, the median loss among financial statement fraud cases in our study was $2,000,000. Generally speaking, financial statements are be manipulated through one of five methods: (1) reporting fictitious or overstated revenues; (2) concealing or understating liabilities or expenses; (3) timing differences — recording revenues or expenses in the wrong period; (4) improperly valuing assets; or (5) failing to disclose significant information such as contingent liabilities or related-party transactions.
 reporting fictitious or overstated revenues; (2) concealing or understating liabilities or expenses; (3) timing differences — recording revenues or expenses in the wrong period; (4) improperly valuing assets; or (5) failing to disclose significant information such as contingent liabilities or related-party transactions.")
32
6The sum of percentages in this table exceeds 100% because a number of cases involved the more than one method of falsifying financial statements.

33
How Occupational Fraud is Committed
In cases where financial statement fraud was reported, we asked respondents to identify which of these five methods were utilized. The preceeding table shows the number of cases in which each particular method was reported. There was a fairly even distribution among the various methods; concealed liabilities were reported most often (54 cases), while timing differences were the least-cited method (34 cases). In 55% of the cases we reviewed, fraudsters used more than one method of financial statement fraud.
, while timing differences were the least-cited method (34 cases). In 55% of the cases we reviewed, fraudsters used more than one method of financial statement fraud.")
34
How Occupational Fraud is Committed
How Corruption Occurs In 349 cases, the respondent identified corruption as having occurred. The median loss in these frauds was $538,000. We asked the CFEs who investigated these cases to specify which of the following four corrupt practices were present in the frauds: conflicts of interest; bribery; illegal gratuities; or extortion. The following table shows the relative frequency with which the various forms of corruption were committed. Conflicts of interest were most frequently cited (215 cases) while extortion was reported least often (59 cases).
 while extortion was reported least often (59 cases).")
35
7The sum of percentages in this table exceeds 100% because a number of cases involved more than one form of corruption.

36
Victims of Occupational Fraud & Abuse
Our survey was targeted to CFEs in the United States and was not designed to measure the frequency of fraud in various industries or types of organizations. Therefore, the data below is not intended and should not be read as indicating whether certain types of organizations are more susceptible to fraud than others.

37
Victims of Occupational Fraud & Abuse
To a large extent, the data in this Report is based on the types of organizations that retain Certified Fraud Examiners. Nevertheless, it is instructional to know what types of victim organizations are represented in this Report so that we can measure differences in how various types of organizations encountered and responded to fraud. Industries Affected in the Study The frauds in our study were spread over a wide range of industries, as illustrated by the accompanying table. The most common were banking and financial services (148 cases); government and public administration (119 cases) and manufacturing (101 cases).
; government and public administration (119 cases) and manufacturing (101 cases).")
38
Excluding mining, which only had one case (costing $17 million), the highest losses occurred in the wholesale trade industry, which had a median loss of $1 million among 30 cases. Next highest were construction, with a median loss of $500,000 among 35 cases, and manufacturing, with a median loss of $413,000 among 101 cases. Among the industries that showed the lowest median losses were retail (median loss of $80,000 among 75 cases) and government and public administration (median loss of $82,000 among 110 cases).
 and government and public administration (median loss of $82,000 among 110 cases).")
39
Victims of Occupational Fraud & Abuse
Methods of Fraud Based on Industry In the first table in this section, we saw how all the frauds were distributed, based on the industry of the victim organization. Our next step was to analyze the cases within each industry to determine what forms of fraud were most common. We limited this analysis to industries in which at least 50 cases were reported so that we would have a sufficient sample to draw upon. Because 90% of all cases involve asset misappropriations, we excluded corruption and financial statement fraud cases from this analysis. In the next section, we have provided a breakdown of industries with the most corruption and financial fraud statement cases, respectively. The following tables show the most commonly reported asset misappropriation schemes in each industry for which at least 50 cases were reported.

41
Banking & Financial Services
Not surprisingly, two of the three most common schemes in the banking and financial services industry were cash larceny and skimming. These schemes generally involve the physical theft of incoming cash and cash on hand (for example, in a vault). Among the 23 non-cash cases in this industry, the most common type of scheme involved the theft of proprietary information about bank customers.
. Among the 23 non-cash cases in this industry, the most common type of scheme involved the theft of proprietary information about bank customers.")
42
Government and Public Administration
Billing schemes (procurement fraud) and non-cash theft were the most commonly reported forms of asset misappropriation in the government and public administration sector, each occurring in 26 of the 119 cases.
 and non-cash theft were the most commonly reported forms of asset misappropriation in the government and public administration sector, each occurring in 26 of the 119 cases.")
43
Manufacturing Approximately one-third of the cases reported from the manufacturing industry involved fraudulent billing. Expense reimbursements and non-cash schemes each also occurred in more than one-fourth of the cases in this industry.

44
Health Care Fraudulent billings were also the most common type of fraud reported among the 89 cases we received from the health care industry. False billings occurred in approximately one-fourth of health care cases, and involved a wide variety of schemes, including submitting false health care claims and purchasing personal items with company funds.

45
Insurance Fraudulent billings occurred in nearly 30% of the insurance industry cases we reviewed. These cases were nearly twice as common as the next-most-frequently reported scheme, which was check tampering.

46
Retail Non-cash theft was the most commonly reported type of fraud in the retail industry. These schemes typically involved the theft of merchandise from warehouses and sales floors. Skimming and cash larceny — both of which frequently involve the theft of cash at the point of sale — were both cited in over 20% of the retail cases as well.

47
Education Billing fraud was the most common type of asset misappropriation identified in the 73 cases we received from the education industry, followed by non-cash theft, expense reimbursement fraud, and skimming.

48
Service (general) Skimming was the most commonly reported form of asset misappropriation in the service industry cases we reviewed. Skimming involves the theft of unrecorded sales and is very common in service businesses such as restaurants and bars where a large number of cash sales are processed and where it is difficult to precisely match inventory to sales.

49
Service (professional, scientific or technical)
In the professional, scientific and technical service industry, we received 58 cases. Billing fraud, check tampering, expense reimbursement fraud, and payroll fraud were each identified in over 20% of the cases from this industry.

51
Industries with the Most Corruption Cases
There were 349 cases that involved some form of corruption, and in 320 of those, the respondent identified the industry of the victim organization. The following table shows the number of corruption cases in each industry, as well as the percent of corruption cases in the industry.

52
Industries with the Most Financial Statement Fraud Cases
As reported earlier, 120 cases involved financial statement fraud. The following table shows the industries in which those financial statement fraud cases occurred, and the percent of financial statement fraud within each industry.

53
Victims of Occupational Fraud & Abuse
Types of Organizations In addition to measuring the industries of the affected organizations, we also gathered data on the organization types of the victims: were they privately held companies, publicly traded corporations, not-for-profit organizations, or government agencies? Our Report represents a good cross-section of organization types. Private companies were most heavily represented at 36.8%, while not-for-profit organizations had the lowest representation at 13.9%.

54
The following chart shows the distribution of cases among the four organization types, and also illustrates the median loss for cases in each group. As we can see, privately held and publicly traded companies were not only the most heavily represented organization types, they also suffered the largest losses, at $210,000 and $200,000 respectively.

55
Methods of Fraud in Not-for-Profit Organizations
There is a great deal of anecdotal evidence suggesting that non-profit organizations are uniquely susceptible to fraud, and we frequently receive requests for information concerning the methods by which fraud occurs in not-for-profit organizations. The following table lists the most commonly reported schemes among the 147 not-for-profit cases in our study. Corruption, billing fraud and expense reimbursement fraud were all cited in over 25% of the not-for-profit cases we reviewed. 8The sum of percentages in this table exceeds 100% because several cases involved multiple methods of fraud.

56
Victims of Occupational Fraud & Abuse
Size of the Victim Organization Number of Employees Small businesses (those with fewer than 100 employees) can face challenges in deterring and detecting fraud that differ significantly from larger organizations. Our data show that these small organizations tend to suffer disproportionately large fraud losses, which is similar to the findings in our 2002 and Reports. The median loss for fraud cases attacking small organizations in our study was $190,000; this exceeded the median loss for cases in any other group. Small organizations were also the most heavily represented group, making up 36% of all frauds in the study.
 can face challenges in deterring and detecting fraud that differ significantly from larger organizations. Our data show that these small organizations tend to suffer disproportionately large fraud losses, which is similar to the findings in our 2002 and 2004 Reports. The median loss for fraud cases attacking small organizations in our study was $190,000; this exceeded the median loss for cases in any other group. Small organizations were also the most heavily represented group, making up 36% of all frauds in the study.")
58
Victims of Occupational Fraud & Abuse
Methods of Fraud in Small Businesses Because of persistent evidence suggesting that fraud operates on small businesses differently than on larger organizations, we felt it was important to identify the most common schemes in small organizations. This may provide some guidance to small business owners on where to focus anti-fraud efforts. For example, the most common small business scheme in our study was check tampering, which frequently occurs when one individual has access to the company’s checkbook and also has responsibility for recording payments and/or reconciling the company bank statement. This is a situation that is often common in small businesses where limited personnel can make it difficult to segregate duties.

59
A small business owner concerned with check tampering might take certain basic steps such as insisting on signing all checks personally or having an unopened copy of the company’s bank statement sent to the owner’s residence so that it can be reviewed independently and compared to the company’s books and records. 9The sum of percentages in this table exceeds 100% because several cases involved multiple methods of fraud.

60
Victims of Occupational Fraud & Abuse
Annual Revenues Another way to measure the size of an organization is based on its annual revenues (or, in the case of government organizations, its budget). The following table illustrates the median losses and frequency of cases based on the annual revenues of the victim organizations. The largest frauds (median loss of $275,000) were committed in organizations with between $10 million and $50 million in annual sales.
. The following table illustrates the median losses and frequency of cases based on the annual revenues of the victim organizations. The largest frauds (median loss of $275,000) were committed in organizations with between $10 million and $50 million in annual sales.")
62
Detecting Occupational Fraud
How is fraud first discovered? The following chart shows how occupational frauds were first Detected by the victim organizations. The most common method of detection was by a tip, which was also true in 2004.

63
Detecting Occupational Fraud
We believe this indicates that anonymous reporting mechanisms are a key component of effective anti-fraud programs. Unfortunately, the majority of victim organizations in our study did not have established reporting structures at the time they were defrauded (see pg. 35 ). It is important to remember that establishing hotlines is not the only way to encourage tips. Several other factors play into an effective reporting structure.
. It is important to remember that establishing hotlines is not the only way to encourage tips. Several other factors play into an effective reporting structure.")
64
Detecting Occupational Fraud
Organizations should conduct anti-fraud training to educate their employees on how to recognize and report illegal conduct, and to impress upon those employees the fact that such conduct is counterproductive and will not be tolerated. Furthermore, organizations should generally seek to foster open channels of communication among employees and all levels of management so that questionable conduct can be brought to light before it develops into outright illegal activity. Regarding the means by which frauds were first discovered, we found it discouraging to note that accidental discovery was more commonly reported than internal audit, internal controls or external audit. This suggests that organizations still need to do a better job of proactively designing controls and audits to identify fraud.

65
10The sum of percentages in this chart exceeds 100% because in some cases respondents identified more than one detection method. The same is true for all charts in this Report showing how occupational frauds were detected.

66
Detecting Occupational Fraud
Sources of Tips Tips were the most common means by which occupational fraud was detected in the cases we reviewed and the majority of tips — nearly two out of three — were received from employees. It is important to remember, though, that a significant number of tips came from outside sources such as customers and vendors. As we stated in our 2004 Report, an effective reporting system should be designed to reach out not only to employees, but also to these third-party sources.

67
Detecting Occupational Fraud
Detecting Fraud by Owners and Executives Detection of frauds by owners and executives can present special problems because these individuals have high levels of authority within their organizations and are typically in a position to override controls to avoid detection. Thus, it is harder for these schemes to be detected through traditional audits and anti-fraud controls. Our data show that nearly half of owner/executive cases were detected through a tip, which far exceeded the rate for all cases. Conversely, only 8.8% of owner/executive cases were detected through the operation of internal controls and only 16.2% were detected through internal audits, both of which were lower than the rates for all cases.

68
This data is important because losses associated with owner/exec schemes tend to be larger than for any other group, yet these schemes are much less likely to be detected through normal audits or control functions. This highlights the importance of establishing anonymous reporting mechanisms, conducting anti-fraud training and fostering open channels of communication as discussed earlier.

69
Detecting Occupational Fraud
Detecting the Largest Frauds We also measured the detection methods for schemes that caused losses of $1 million or more. To some extent, this data will overlap with the owner/executive data shown on the previous page. However, there is some distinction; not all $1 million schemes were committed by owner/executives, and conversely, not all owner/executive schemes cost over $1 million. The purpose of analyzing the detection of owner/executive frauds was to help us understand how to detect frauds committed by those in the best position to conceal it.

70
Detecting Occupational Fraud
Conversely, the purpose of analyzing the detection of the cases with the largest losses is simply to help us understand how best to catch the catastrophic fraud as early as possible. Despite the differing goals of these two analyses, the results are similar: we again see that tips are the most common form of detection. We also found that the largest frauds were less likely to be detected by internal audits or internal controls.

72
Detecting Occupational Fraud
Detecting Fraud in Small Businesses Frauds in small businesses (those with fewer than 100 employees) were less likely to be detected by a tip than occupational frauds in general. They were also less likely to be detected by internal audit or internal controls, which may be because many small organizations often lack strong internal control structures or any type of internal audit department. For example, only 73 of the 381 small businesses in our study had internal audit departments, yet in 34 cases, small business frauds were detected by internal audit.
 were less likely to be detected by a tip than occupational frauds in general. They were also less likely to be detected by internal audit or internal controls, which may be because many small organizations often lack strong internal control structures or any type of internal audit department. For example, only 73 of the 381 small businesses in our study had internal audit departments, yet in 34 cases, small business frauds were detected by internal audit.")
73
Detecting Occupational Fraud
This translates to an adjusted rate of detection by internal audit of 46.6%, which suggests that internal audit departments can be effective in detecting fraud when they are utilized by small businesses. We also found that frauds in small businesses were much more likely to be detected by accident, suggesting that these organizations do not do a good job of proactively detecting fraud.

75
Detecting Fraud in Not-for-Profit Organizations
The data for detection of fraud in not-for-profit organizations was largely consistent with the data resulting from all cases. Tips were again the most common detection method, followed by accidents.

76
Detecting Fraud in Government Agencies
Generally speaking, government agencies were much less likely to rely on accidental detection of fraud, whereas their rates of detection through tips, external audits and notification by law enforcement each exceeded the rates for all cases.

77
Detecting Occupational Fraud
Detecting Fraud in Privately Held Companies Privately held companies had the lowest rate of detection through tips of any organization type in our study. Less than 25% of cases in private companies were detected through tips, whereas nearly 35% were detected by accident. Rates of detection by internal audit and internal controls also lagged behind the overall rate, whereas private companies were more likely to detect frauds through external audits.

79
Detecting Occupational Fraud
Detecting Fraud in Publicly Traded Companies Publicly traded companies had a higher rate of detection through tips, internal audits and internal controls than was found overall. This may be due to the impact of Sarbanes-Oxley, which mandates that publicly traded companies establish anonymous reporting mechanisms and places a strong emphasis on enhanced internal controls to detect fraud. However, the data in this respect are inconclusive, as the rates of cases detected by tips and through internal controls in public companies are both lower in the present study than they were in our 2004 Report.

81
Limiting Fraud Losses We asked each respondent to
provide information on the anti fraud measures that were in place in the victim organizations at the time the frauds occurred. Our goal was to identify which mechanisms were most commonly used and to measure each anti-fraud measure’s relative effectiveness.

82
Limiting Fraud Losses We tested for five anti-fraud measures:
Did the victim have a fraud hotline or anonymous reporting mechanism? Did the victim provide fraud awareness or ethics training for employees and managers? Did the victim have an internal audit or fraud examination department? Did the victim perform surprise audits on a regular basis? Was the victim audited by external auditors?

83
Limiting Fraud Losses Most Common Anti-Fraud Measures
The most common anti-fraud measure among the victim organizations in our study was the use of external audits, which were utilized by 75% of the victim organizations. Next most common was internal audits, at 59%. Fraud training and fraud hotlines were both utilized by just under half of the organizations we studied, while surprise audits were only reported in 29% of victim organizations.

84
Limiting Fraud Losses It is interesting to note the discrepancy between the frequency of certain anti- fraud measures here and the data we gathered on detection of occupational fraud. For example, we found that the most common means of detecting fraud was through tips, yet as the following chart shows, hotlines ranked fourth among anti-fraud measures in terms of use, and were utilized by less than half of the organizations in our study. Given the relative effectiveness of tips as a detection method, we would hope to see more organizations utilizing anonymous reporting mechanisms such as hotlines in order to encourage and facilitate the reporting of illegal conduct.

85
Limiting Fraud Losses On the other hand, external audits were by far the most commonly reported anti-fraud measure, yet external audits ranked fifth in terms of detecting occupational fraud. Although there are a number of factors that determine what kinds of anti-fraud measures will be used by an organization (external audits, for instance, are legally required for certain types of organizations), there nevertheless seems to be a certain level of disconnect between the anti-fraud measures organizations employ and the effectiveness of those measures in detecting occupational fraud.11 11The effectiveness of these measures in deterring or preventing occupational fraud is certainly a key factor in determining whether they should be employed, but the deterrent capability of these mechanisms is outside the scope of our inquiry.
, there nevertheless seems to be a certain level of disconnect between the anti-fraud measures organizations employ and the effectiveness of those measures in detecting occupational fraud The effectiveness of these measures in deterring or preventing occupational fraud is certainly a key factor in determining. whether they should be employed, but the deterrent capability of these mechanisms is outside the scope of our inquiry.")
86
Limiting Fraud Losses Effectiveness of Anti-Fraud Measures
In an effort to test the effectiveness of each anti-fraud control, we measured the median loss in cases where the anti-fraud measure was present, then compared it to the median loss in cases where the anti-fraud measure was absent. We also measured the length of time it took to discover the fraud, based on whether each of these factors was present or not. These are obviously not precise indicators of the value of each respective control — there are several factors that determine the size and duration of a fraud — but it helps us get some sense of the impact the respective anti-fraud measures had on fraud losses.

88
Limiting Fraud Losses Anonymous Fraud Hotlines
There were 479 organizations that had fraud hotlines or other anonymous reporting mechanisms at the time the frauds occurred, compared to 581 that did not. As the following companion charts illustrate, organizations with hotlines had a median loss of $100,000 per scheme and detected their frauds within 15 months of inception. By contrast, organizations without hotlines suffered twice the median loss — $200,000 — and took 24 months to detect their frauds.

90
Limiting Fraud Losses Internal Audits
Internal audits also had a positive correlation with both time to detection and median loss. Fifty-nine percent of victim organizations we reviewed had an internal audit or fraud examination department at the time of the fraud. Those organizations had median losses of $120,000, as opposed to $218,000 for organizations without an internal audit function. Similarly, organizations with internal audit departments detected their frauds in 18 months, as opposed to 24 months for those without internal audit departments.

92
Limiting Fraud Losses External Audits
The data from our study on the effectiveness of external audits was counter- intuitive. Although external audits were the most common anti-fraud control among the organizations in our study, we found organizations that utilized external audits had higher fraud losses than those that did not. Similarly, we found no connection between the use of external audits and the length of the scheme. Organizations that had external audits saw fraud schemes with a median length of 23 months, while those with no external audits experienced schemes with a median length of 18 months.

93
Limiting Fraud Losses Of course, there are other reasons why external audits can be valuable to organizations, and with the increased focus on fraud in external audits that is mandated by SAS 99, we would hope to see these numbers trend up in future reports, but in our current study we did not find data to indicate that external audits were particularly effective at detecting fraud.12 12As we stated earlier, external audits ranked fifth out of six detection methods and were credited with identifying only 12% of the cases in our study.

95
Limiting Fraud Losses Surprise Audits
Surprise audits are frequently cited as an effective method for both fraud prevention and fraud detection. We found that surprise audits were the least commonly utilized anti-fraud control among those we tested for. Only 29.2% of the victim organizations regularly conducted surprise audits, yet those organizations had median losses of $100,000, as opposed to a median loss of $200,000 for organizations that did not conduct them. Organizations that used surprise audits also had fraud schemes with a median length of 15 months; nine months less than in organizations where surprise audits were not conducted.

97
Limiting Fraud Losses Fraud Awareness/Ethics Training
Among the victim organizations in this Report, 45.9% employed a fraud awareness or ethics training program for their managers and employees. The goal of such training is to make staff aware of how fraud is committed and to emphasize the importance of being watchful and reporting fraudulent conduct when it is observed or suspected. The median loss in organizations with fraud training in our study was $100,000 — half that of the loss for those organizations with no training. These organizations also experienced fraud schemes of a significantly shorter length.

99
Limiting Fraud Losses Anti-Fraud Measures by Industry
In addition to measuring the general frequency and effectiveness of anti-fraud measures, we also looked at the frequency with which each anti-fraud measure was employed in various industries. This inquiry was limited to industries with at least 50 cases.

100
Banking and Financial Services
Not surprisingly, the Banking and Financial Services Industry had high rates of both external and internal audits. Over 90% of Banking and Financial Services organizations were audited by external auditors, and nearly three-fourths had internal audit departments. Although our data show that fraud hotlines can be very useful in detecting fraud, less than half of the banking and financial services organizations utilized them.

101
Government and Public Administration
External audits and internal audits were the two most common anti-fraud measures reported among organizations in the government and public administration sector. Fraud training, anonymous reporting hotlines and the use of surprise audits were all reported in less than half of the government organizations in our survey.

102
Manufacturing Three-fourths of organizations from the manufacturing industry utilized external audits, while 60% had internal audits and approximately half had fraud hotlines. Only about 16% used regular surprise audits as a fraud detection tool.

103
Healthcare Both hotlines and fraud training were utilized by over 50% of the healthcare organizations in our study. These figures were relatively high compared to other industries.

104
Insurance Overall, insurance organizations scored well in terms of having established anti- fraud measures in place. Nearly 70% of the organizations in the insurance industry conducted fraud training for their employees and managers — a higher rate than for any other industry we tested. Insurance organizations were also more likely to have hotlines than organizations from any other industry. Finally, we found that internal audit departments and external audits were both present in 80% of the insurance companies in our study.

105
Retail Generally speaking, retail industries tended to have fewer anti-fraud measures than other organizations. The most commonly cited controls — internal audit departments and external audits — were each present in only a little more than half of the retail organizations from our survey. Fraud training, however, was more common in the retail industry than in most others.

106
Education Over 80% of education organizations had external audits, and two-thirds of these organizations had internal audit departments. Perhaps the most interesting information in the following table is the fact that less than a third of education organizations utilized fraud training. One would have hoped educational organizations would have seen more benefit to educating their employees about fraud.

107
Service (general) Overall, there was a low rate of anti-fraud measures employed by the general service organizations in our survey. External audits were utilized by 63% of service organizations, but no other anti-fraud control was reported in even half of the cases from this industry.

108
Service (professional, scientific or technical)
Professional service organizations were even less likely than general service organizations to have established anti-fraud measures. Less than 40% of these organizations had external audits (the lowest rate for any industry) and each of the other control mechanisms was cited in less than one-third of our cases.
 and each of the other control mechanisms was cited in less than one-third of our cases.")
109
Anti-Fraud Measures in Small Businesses
One of the reasons small businesses tend to suffer disproportionately large fraud losses may be because they tend not to have many established anti- fraud measures. A little less than half of small businesses we examined had external audits and no other anti-fraud measure was cited in even 20% of small business cases. This may help explain why more small business frauds are detected by accident than by any other means.

110
Anti-Fraud Measures in Not-for-Profit Organizations
Tips were the most common means by which frauds were detected in not-for- profit organizations, yet less than one- third of the not-for-profits in our study had an established anonymous reporting mechanism. Fraud training and the use of surprise audits were also ignored by the majority of not-for-profits.

111
The Perpetrators The perpetrators of occupational
fraud are the people who use their positions within an organization for personal enrichment throughthe deliberate misuse ormisapplication of the organization’s resources or assets.

112
The Perpetrators In our survey, we asked respondents to provide detailed information about the perpetrators of the crimes they had investigated.13 This data helps us see how certain factors related to the perpetrator affect the nature of fraud and the size of losses inflicted upon victim organizations. 13In cases where there was more than one perpetrator, respondents were asked to provide data on the “Principal Perpetrator,” which was defined as the person who worked for the victim organization and who was the primary culprit.

113
The Perpetrators Effect of the Perpetrator’s Position
Our past studies have indicated — and our current study confirms — that the level of authority a person holds within an organization will tend to have the most significant impact on the size of the loss in a fraud scheme. The more authority an individual has, the greater that individual’s access to organizational resources, and the more ability that person has to override controls in order to conceal the fraud.

114
The Perpetrators We asked respondents to classify the principal perpetrator in each scheme in one of three categories: Employee Manager Owner/Executive As the following charts illustrate, most of the perpetrators were either employees (41.2%) or managers (39.5%). Owner/executives made up less than one-fifth of the perpetrators, but they accounted for the largest losses by far. The median loss in a scheme committed by an owner or executive was $1 million. This was nearly five times more than the median loss in a scheme committed by a manager and almost 13 times as large as the median loss caused by employees.
 or managers (39.5%). Owner/executives made up less than one-fifth of the perpetrators, but they accounted for the largest losses by far. The median loss in a scheme committed by an owner or executive was $1 million. This was nearly five times more than the median loss in a scheme committed by a manager and almost 13 times as large as the median loss caused by employees.")
117
The Perpetrators The Perpetrator’s Annual Income
Just as fraud losses tended to rise based on the perpetrator’s level of authority within an organization, we also found that there was a positive correlation between the perpetrators’ annual income and the size of fraud losses. As incomes rose, so did fraud losses. The median loss for employees in the lowest classification was $75,000, whereas the median loss for the employees with the highest yearly incomes — $500,000 or more — was $8 million. This data correlates with our previous findings on how a fraudster’s position within the victim organization influences loss. We would expect that the employees with the highest levels of authority would generally be the highest paid as well. Thus, we believe annual income is only a secondary factor influencing loss.

119
The Perpetrators The Effect of Tenure
We also found a direct correlation between the length of time an employee had been employed by a victim organization and the size of the loss in the case. Employees who had been with the victim for 10 years or more caused median losses of $263,000, whereas employees who had been with their employers for one year or less caused median losses of $45,000. To some extent, this data may also be linked to the position data shown earlier. The longer an employee works for an organization, the more likely it is that the employee will advance to increasing levels of authority. However, we believe the critical factors most directly influenced by tenure are trust and opportunity.

120
The Perpetrators It is axiomatic that the more trust an organization places in an employee in the forms of autonomy and authority, the greater that employee’s opportunity to commit fraud. Employees with long tenure will, by and large, tend to engender more trust from their employers. They will also become more familiar with the organization’s operations and controls — including gaps in those controls — which can provide a greater understanding of how to misappropriate funds without getting caught. This is not to imply that all long-term trusted employees will commit fraud; however, in general those employees will be better equipped to commit fraud then their counterparts with less experience. When long-term employees decide to commit fraud, they will tend to be more successful.

122
The Perpetrators The Effect of Gender
In each edition of the Report to the Nation, we have found that median losses committed by men tend to be much higher than those committed by women. That fact was apparent again in our current study. The median loss in frauds committed by males was $250,000, more than twice as high as the median loss in frauds committed by women. Men also accounted for 61% of the cases. We speculate that the disparity in losses based on gender is a result of men tending to hold more management and executive-level positions in many organizations.

124
The Perpetrators The Effect of Age
The frauds in our study were committed by persons ranging in age from 16 to 80. We found a strong correlation between the age of the perpetrator and the size of the median loss, which was consistent with our findings from previous Reports. Although there were very few cases committed by employees over the age of 60 (2.8%), the median loss in those schemes was $713,000. By comparison, the median loss in frauds committed by those 25 or younger was $25,000.
, the median loss in those schemes was $713,000. By comparison, the median loss in frauds committed by those 25 or younger was $25,000.")
125
The Perpetrators As with income and gender, we believe age is most likely a secondary factor in predicting the loss associated with an occupational fraud, generally reflecting the perpetrator’s position and tenure within an organization. While frauds committed by those in the highest age groups were the most costly on average, over two-thirds of the frauds reported were committed by employees in the age group. The median age among perpetrators was 42.

127
The Perpetrators The Effect of Education
As employees’ education levels rose, so did the losses from their frauds. The median loss in schemes committed by those with only a high school education was $100,000, whereas the median loss caused by employees with a postgraduate education was $425,000. This trend was to be expected given that those with higher education levels will tend to occupy positions with higher levels of authority.

129
The Perpetrators The Perpetrator’s Department
In addition to classifying perpetrators based on broad demographic factors such as their age, income or general level of authority within an organization, we also grouped them based on the departments in which they worked. When combined with information on the types of schemes committed, this will hopefully provide organizations with valuable information about the relative level of risk for specific types of fraud in different departments.

130
The Perpetrators Survey respondents were provided with a list of 15 common departments or job-type classifications, and were asked to select the one that best described the principal perpetrator in their case. We received 823 usable responses. The following table shows the number of cases based on the perpetrator’s department. The most heavily represented department was accounting, with over 30% of fraudsters. The next most common category was executive or upper management (20.9%), followed by sales (14%) and customer service (11.2%).
, followed by sales (14%) and customer service (11.2%).")
132
The Perpetrators In addition to examining the frequency of frauds based on their department of origin, we also looked at the losses associated with frauds from various departments. The following table shows the median loss for fraud schemes based on the department in which the principal perpetrator worked. The largest losses occurred in purchasing, which had median losses of $1 million for 25 cases. Frauds by executives and upper management were the next highest category at $900,000. Schemes committed by employees in sales, human resources and customer service tended to be among the least costly.

134
The Perpetrators Most Common Asset Misappropriation Schemes by
Department We further analyzed the cases in our survey to determine what types of fraud were most commonly associated with each department. This analysis was limited to the four departments in which at least 50 cases were reported. This data should provide useful information to organizations on how to assess risks and structure controls within these departments. Because over 90% of all cases involved asset misappropriations, we limited this analysis to asset misappropriation schemes. Data on departments most commonly associated with corruption and financial statement fraud is presented in the following section.

135
The Perpetrators Accounting
When accounting employees committed occupational fraud, the most common schemes were check tampering and billing fraud. Check tampering, which was cited in nearly 30% of all cases committed by accounting employees, occurs when individuals forge or alter company checks, or steal outgoing checks that were issued to a third party.

136
Accounting personnel with access to company check stock would obviously be in a good position to commit this kind of fraud. Billing schemes typically involve the processing of fraudulent invoices and it would therefore be expected that these schemes might involve employees in accounts payable.

137
Executive/Upper Management
Over 20% of the frauds in this Report were committed by executive or upper management personnel, and these schemes had a very high median loss of $900,000. Billing fraud, expense reimbursement fraud, and non-cash misappropriation were all cited in more than one-fourth of the executive/upper management cases we reviewed.

138
Sales The most common type of asset misappropriation committed by sales personnel was non-cash misappropriation, such as when an employee steals inventory or merchandise from a sales floor. Skimming was the next most common scheme. This type of fraud generally involves the off-book sale of goods or services by an employee. The sale is never recorded and the employee pockets the money.

139
Customer Service Eleven percent of the cases in our study were committed by employees in customer service-related positions. There was a wide distribution of scheme types in this group of cases. Non-cash thefts were cited 25% of the time. After that, cash larceny, skimming, billing fraud and payroll fraud were all reported in between 10 and 13% of customer service cases.

140
The Perpetrators Categories of Fraud Based on Department
For each case in this Report, we compared the type of scheme committed with the department in which the perpetrator worked. The goal was to provide data that could be useful to organizations in structuring their anti-fraud controls by identifying the departments most commonly associated with certain types of occupational fraud.

141
Financial Statement Fraud
Financial statement fraud was the most costly form of fraud. The median loss in financial statement fraud cases was $2 million. Not surprisingly, half of the financial statement frauds in our study were committed by executive or upper management personnel. Another 17% were committed by accounting employees.

142
Corruption Corruption schemes can be a particularly insidious form of occupational fraud. They generally involve collusion between an employee and an outside party, and this conspiracy serves to undermine the victim’s controls. The median loss among cases involving corruption was $538,000 — more than three times the median loss associated with asset misappropriations. Like financial statement fraud, corruption schemes were most likely to be committed by executive or upper management employees. Nearly 30% of corruption cases came from this group. Accounting and sales departments together accounted for another 30% of corruption cases.

143
Billing Schemes Among the fraudulent disbursements, billing schemes were the most common and were associated with the largest losses. Over half of all billing schemes in our study were committed by accounting personnel or executive/upper management.

144
Expense Reimbursement Schemes
Executives were also the most likely to commit expense reimbursement fraud, followed by employees in accounting and sales. Presumably, sales employees would be most likely to file fraudulent expense reports, whereas accounting staff, who are less likely to travel on company business, would tend to be involved on the other end of these schemes by processing knowingly false expense reports for payment.

145
Payroll Schemes Not surprisingly, accounting personnel (which includes the payroll accounting department) were most often involved in payroll fraud schemes. Approximately half of all payroll frauds were attributed to accounting. However, payroll frauds were also committed by employees in a number of other departments who claimed false overtime, conjured up ghost employees, falsified leave reports, or otherwise attempted to bilk their organizations’ payroll systems.
 were most often involved in payroll fraud schemes. Approximately half of all payroll frauds were attributed to accounting. However, payroll frauds were also committed by employees in a number of other departments who claimed false overtime, conjured up ghost employees, falsified leave reports, or otherwise attempted to bilk their organizations’ payroll systems.")
146
Check Tampering As we stated earlier, the most common type of fraud committed by accounting employees was check tampering, in which company checks are forged or altered, or outgoing checks are stolen and deposited in the perpetrator’s bank account. Over one-fourth of check tampering cases were committed by executives. In many cases, these schemes involved executives with signatory authority who wrote company checks to pay personal expenses.

147
Wire Transfer Schemes Wire transfer schemes were also most likely to be committed either by executives (who would have the authority to approve a wire transfer of funds) or accounting personnel (who would be responsible for processing those transfers.)
 or accounting personnel (who would be responsible for processing those transfers.)")
148
Cash Larceny One of the most common ways for cash larceny to occur is for an employee to steal part or all of an organization’s daily receipts before they are deposited in the bank. Since accounting personnel are generally responsible for preparing the bank deposit, it is not surprising that these employees would be the most likely to commit cash larceny. Another common way for cash larceny to occur is for an employee to steal cash receipts at the point of sale. As we see below, nearly 20% of cash larceny schemes were committed by sales department employees, and another 11% were committed by those with customer service responsibilities.

149
Skimming Skimming – the theft of unrecorded sales – was also most likely to be committed by employees in the accounting department. Over 40% of skimming cases were committed by accounting employees. We also found that approximately 27% of skimming cases were committed by sales and customer service employees (who would be in the best position to make unrecorded sales of goods or services). We had not expected such a large percentage of skimming cases to be traced to the executive suite.
. We had not expected such a large percentage of skimming cases to be traced to the executive suite.")
150
Non-Cash Misappropriations
Our data on non-cash misappropriations was somewhat surprising. We had expected that employees in the warehousing, inventory and manufacturing departments would account for the majority of these frauds, but in reality less than 10% of the non- cash frauds we reviewed were traced to each of these departments. Instead, executive level employees accounted for approximately one-fourth of these cases, and sales departments accounted for another 17%.

151
The Perpetrators The Effect of Collusion
While the preceding data has illustrated how schemes worked based on factors related to the principal perpetrator of each fraud, it is important to remember that many frauds involve collusion among one or more persons. Nearly 40% of all cases in this Report involved some form of collusion — either several employees within the victim organization, or employees of the victim conspiring with one or more outsiders. Our data show that frauds involving multiple perpetrators tend to be much more costly than those committed by a single individual.

153
The Perpetrators The Perpetrators’ Criminal Histories
Nearly two-thirds of the victim organizations routinely conducted background checks on new employees at the time their frauds occurred. Background checks were a more common practice within these organizations than internal audits, fraud hotlines, anti-fraud training or surprise audits. While background checks can be a valuable anti-fraud tool and should be conducted on new hires who will have access to organizational assets, the vast majority of occupational fraudsters in our study had never been charged or convicted of any fraud-related offense before committing their crimes. This finding is consistent with other research suggesting that most occupational fraudsters are not career criminals.

154
The Perpetrators Our data suggest that organizations should not rely too heavily on background checks as a preventative measure for occupational fraud. While background checks may weed out the predatory employee, who seeks out employment with the goal of defrauding his or her employer, they will not catch the typical occupational fraudster who has no prior criminal record. Furthermore, when organizations do conduct background checks, our findings suggest that those checks should not be limited to criminal history checks. Other factors such as credit history and past job performance may be more predictive of whether an employee is likely to engage in occupational fraud.

156
Case Results Participants were asked to provide information on how
each victim organization responded to the perpetrators after the frauds had been detected.

157
Case Results We sought to measure whether victim organizations took legal action against the perpetrators, and if so, what their level of success was. If no legal action was taken, we wanted to determine why that decision was made. We also sought to determine how successful organizations were in recovering losses caused by occupational fraud.

158
Case Results Criminal Prosecutions
In 70.6% of the cases we reviewed the victim organization referred the case to law enforcement authorities. The median loss in those cases was $200,000, whereas the median loss was only half as large in cases that were not referred. For cases that were referred to law enforcement authorities, we asked respondents to provide detail on the outcome of those criminal cases. A large number of those cases were still pending at the time of the survey, but we received 351 responses where the outcome was known. Within that group, approximately 15% of the perpetrators were convicted at trial and another 73.5% pled guilty or no contest to their crimes. There was only one case in which the perpetrator was acquitted.

160
Case Results Prosecution Rates Based on Industry
The following table shows the percentage of cases in each industry in which frauds were referred for prosecution. Excluding the mining industry, which had only one case, we see that wholesale trade, banking and financial services, and general service industries were most likely to prosecute. Over 80% of the cases in each industry were referred to law enforcement authorities. On the other end of the spectrum, less than half of the 101 cases in the manufacturing industry were referred for prosecution.

162
Case Results Why do Organizations Decide Not to Prosecute?
There were 315 cases in which the victim organization decided not to refer the case to law enforcement. We provided our respondents with a list of possible reasons why an organization might decline to seek prosecution of an occupational fraud; each respondent was asked to select any of the options that applied in their case. The following chart illustrates the most common reasons why organizations declined to prosecute. The most commonly cited reason was fear of bad publicity. The fact that a private settlement was reached, and the fact that the organization considered its internal discipline to be sufficient were also both cited in over 30% of the non-referred cases.

163
14The sum of percentages in this chart exceeds 100% because some respondents cited more than one reason why victim organizations declined to prosecute.

164
Case Results Civil Lawsuits
Generally speaking, organizations are more likely to pursue criminal action against a fraudster than they are to file a civil lawsuit. Civil suits were only filed in 23.5% of all cases, and those tended to be the most costly frauds, with a median loss of $1.2 million. When victim organizations did file civil lawsuits, they received a judgment in their favor in nearly 60% of those cases, while 38.5% of the cases ended in a settlement. Judgments were only rendered in favor of the perpetrator in 2% of the civil suits reported.

166
Case Results Recovering Losses Caused by Fraud
After organizations detect a fraud scheme, they are not likely to make a full recovery of their losses. We asked respondents to tell us what percentage of the victim organization’s losses were recovered through all methods (insurance claims, restitution agreements, civil judgments, etc.). We received 853 responses in which the CFE was able to tell us how successful the victim was at recovering its losses. In 42.1% of those cases, the victim was not able to recover any of its losses, and in another 23.4% the victim recovered less than one-fourth of what had been stolen. In approximately one-sixth of the cases the victim made a complete recovery, but those cases tended to be small. The median loss in schemes where a full recovery was obtained was only $50,000. By contrast, the median loss in schemes where there was no recovery was over three times as large, at $170,000.
. We received 853 responses in which the CFE was able to tell us how successful the victim was at recovering its losses. In 42.1% of those cases, the victim was not able to recover any of its losses, and in another 23.4% the victim recovered less than one-fourth of what had been stolen. In approximately one-sixth of the cases the victim made a complete recovery, but those cases tended to be small. The median loss in schemes where a full recovery was obtained was only $50,000. By contrast, the median loss in schemes where there was no recovery was over three times as large, at $170,000.")
168
Methodology This Report is based on data gathered from
an online survey of Certified Fraud Examiners in the United States. The survey, which consisted of 77 questions contained in five sections, was distributed to 11,112 CFEs. We received 1,134 responses which were usable for our study. All of the occupational fraud data presented in this Report was compiled solely from the information provided in those 1,134 survey forms.

169
Methodology Each participant was asked to answer a detailed set of questions about the largest case of occupational fraud that he or she had investigated between January 2004 and January 2006. Section A of the survey focused on the method of fraud committed. Respondents were asked to provide a brief narrative of the scheme, then answer a set of questions about how the fraud was committed; what assets, if any, were misappropriated; and how the scheme was detected. Section B of the survey contained questions about the victim organization: its size, annual sales, industry, the anti-fraud controls it had in place, and other basic demographic information.

170
Methodology In Section C, we asked participants to provide details about the perpetrator such as his or her level of authority, age, gender, tenure with the victim, annual income, education level and the department in which he or she worked. In Section D, we sought information about the legal outcome of the case: if it was referred for prosecution or led to a civil suit, and if so, the outcome of those legal proceedings. We also asked for information on why some organizations chose not to refer their cases to law enforcement authorities. Finally, in Section E of the survey, we asked for information about our respondents: their occupations, where they worked, their years of experience, and their general opinions on certain key issues relating to occupational fraud.

171
Methodology As we stated in the introduction to this Report, our methodology differed slightly from previous editions of the Report to the Nation. The most significant change was that we required that respondents provide data on the largest fraud case each had investigated in the last two years. In previous studies, we had only asked respondents to answer questions about any one case they had investigated within the relevant time frame.

172
Methodology In addition to changing the criteria for the cases that could be reported, we also added a number of questions to our survey that were not present in previous editions of the Report. Most significantly, we asked each respondent to identify the industry of the victim organization based on a list of NAICS industry codes. Gathering this information allowed us to make much more detailed analyses of how fraud affected various industries and types of organizations than was possible in previous editions.

173
Methodology We also added a question asking respondents to select the department the principal perpetrator worked in from a general list of common business departments. This enabled us to study how various methods of fraud affect different parts of organizations and to try to determine with more specificity than was possible in past editions where certain fraud schemes are most likely to originate. In addition, where there were multiple methods of fraud utilized in a single scheme, we asked respondents to specify the amount of loss attributable to each particular method, rather than just providing an overall loss amount. This change enabled us to develop more accurate data than in the past concerning the losses associated with specific types of fraud.

174
Methodology As the Report to the Nation evolves from one edition to the next, there are always a number of minor corrections or clarifications in our survey form in addition to the more significant changes described above. Like the fight against fraud, the task of gathering meaningful information about fraud is a difficult and ever-changing process. It is our goal that each successive edition of the Report to the Nation should provide better, more useful information than its predecessor. We believe that readers of the current Report will find it to be the most informative edition to date.

175
About the ACFE The ACFE is the world’s premier provider of anti-fraud training and education. A leader in the community, the ACFE has more than 40,000 members, sponsors more than 125 local chapters worldwide and provides anti-fraud educational materials to more than 300 universities. Certified Fraud Examiners (CFEs) on six continents have investigated more than two million suspected cases of fraud. The ACFE would like to thank all of the Certified Fraud Examiners who made the Report to the Nation the most comprehensive fraud research available. Your support and dedication in the fight against fraud and your efforts to establish prevention, deterrence and detection measures will help build integrity in your organization. Although fraud is widespread today, its potential impact on your organization can be reduced through appropriate anti-fraud programs.
 on six continents have investigated more than two million suspected cases of fraud. The ACFE would like to thank all of the Certified Fraud Examiners who made the 2006 Report to the Nation the most comprehensive fraud research available. Your support and dedication in the fight against fraud and your efforts to establish prevention, deterrence and detection measures will help build integrity in your organization. Although fraud is widespread today, its potential impact on your organization can be reduced through appropriate anti-fraud programs.")
176
Additional copies of this report are available from:
Association of Certified Fraud Examiners World Headquarters The Gregor Building 716 West Avenue Austin, TX USA (800) (USA & Canada) (0800) (United Kingdom) +1 (512) Fax: +1 (512)
 (USA & Canada) (0800) (United Kingdom) +1 (512) Fax: +1 (512)")
Similar presentations


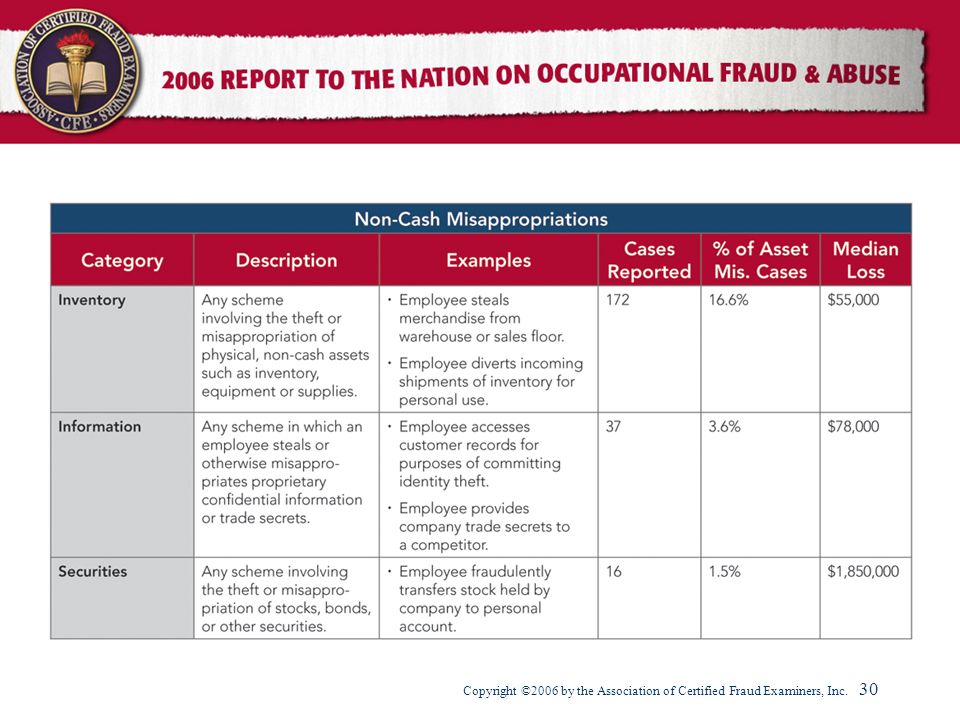


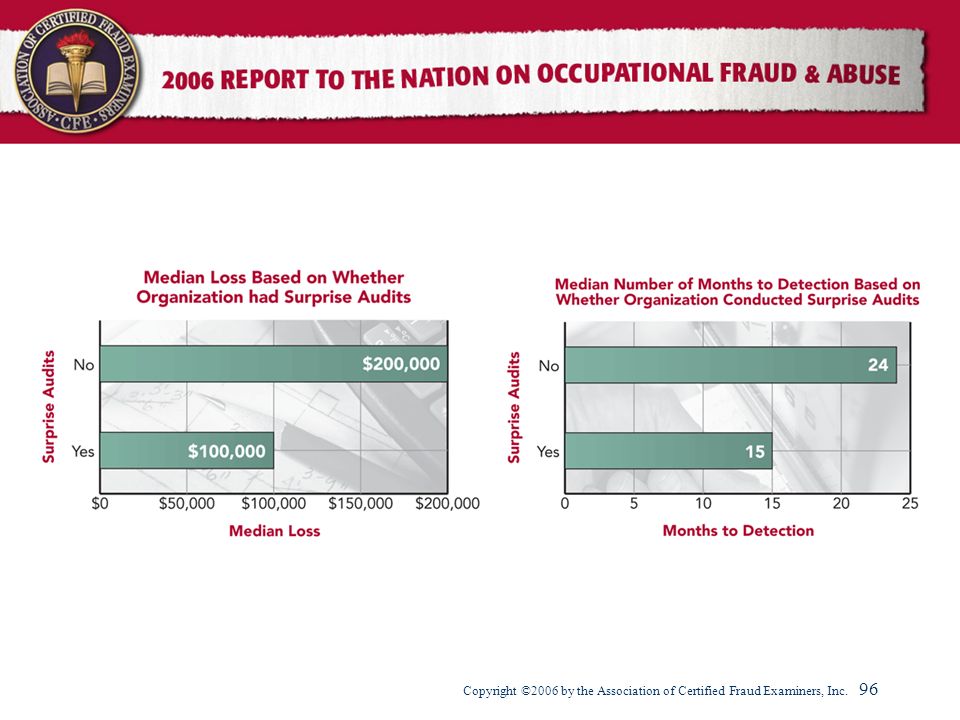


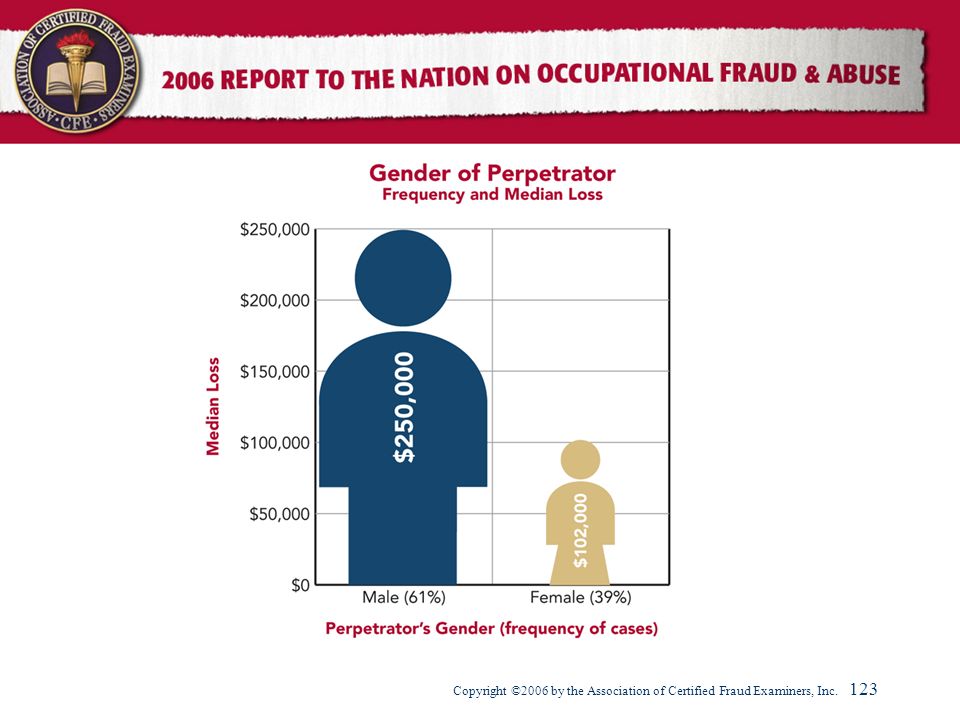


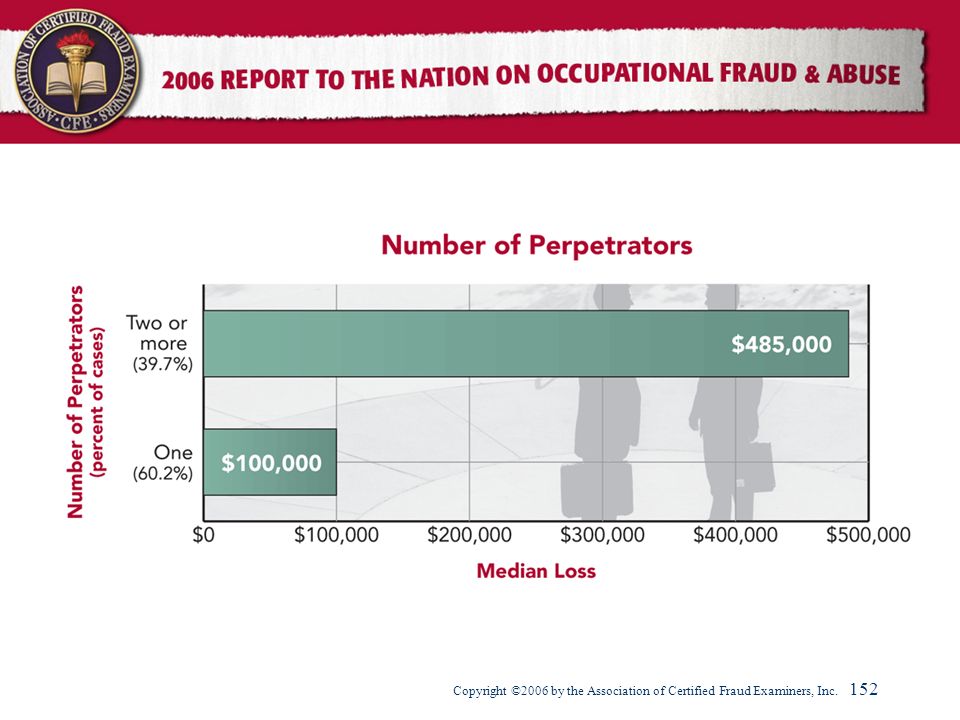
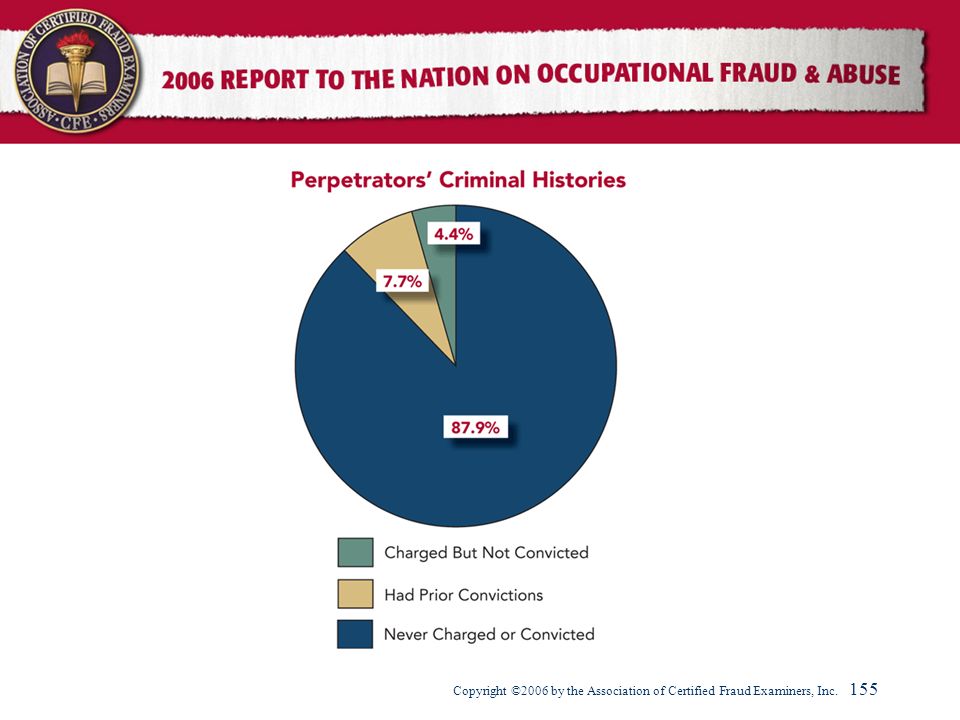

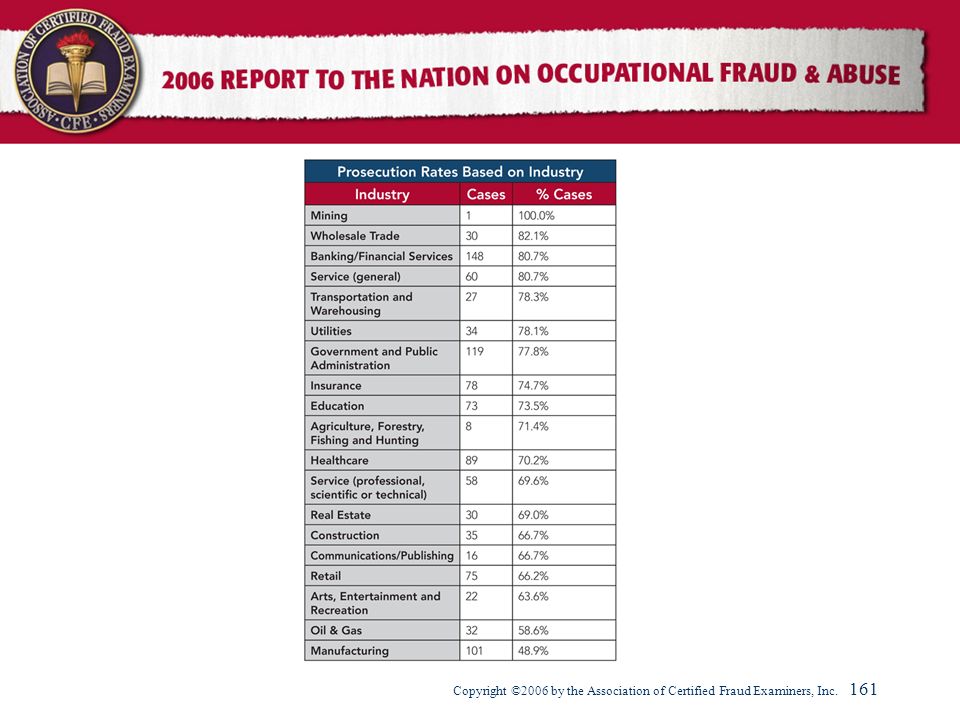


 Grants Chapter 6.>")

 Geometry (29%)>")