Download presentation
Presentation is loading. Please wait.

2
Optimizing Supportive Care in Cancer
Investigations • Innovation • Clinical Application New Frontiers and Paradigm Changes in Optimizing Supportive Care in Cancer Focus on Thrombosis Prevention, CINV, and Hematologic Complications of Malignancy Program Chairman Gary H. Lyman, MD, MPH, FRCP (Edin) Editor-In-Chief, Cancer Investigation Professor of Medicine and Director Health Services, Effectiveness and Outcomes Research Division of Medical Oncology, Department of Medicine Duke University School of Medicine and the Duke Comprehensive Cancer Center Senior Fellow, Duke Center for Clinical Health Policy Research
 Editor-In-Chief, Cancer Investigation. Professor of Medicine and Director. Health Services, Effectiveness and Outcomes Research. Division of Medical Oncology, Department of Medicine. Duke University School of Medicine and the Duke Comprehensive Cancer Center. Senior Fellow, Duke Center for Clinical Health Policy Research.")
3
Program Faculty PROGRAM CHAIRMAN GARY H. LYMAN, MD, MPH, FRCP (Edin)
Editor-In-Chief, Cancer Investigation Professor of Medicine and Director Health Services, Effectiveness and Outcomes Research Division of Medical Oncology, Department of Medicine Duke University School of Medicine and the Duke Comprehensive Cancer Center Senior Fellow, Duke Center for Clinical Health Policy Research Lee S. Schwartzberg, MD, FACP Supportive Oncology Services, Memphis Accelerated Community Oncology Research Network Clinical Professor of Medicine University of Tennessee Medical Center Memphis, Tennessee Jeffrey Crawford, MD George Barth Geller Professor for Research In Cancer Chief of Division of Medical Oncology Department of Medicine Duke University Medical Center Editor-in-Chief, Supportive Care Oncology Durham, North Carolina Alok A. Khorana, MD, FACP Vice-Chief, Division of Hematology/Oncology Associate Professor of Medicine and James P. Wilmot Cancer Center University of Rochester Rochester, New York

4
An Evidence-Based Overview to Critical Issues in Supportive Care
Investigations • Innovation • Clinical Application An Evidence-Based Overview to Critical Issues in Supportive Care Overview Program Chairman Gary H. Lyman, MD, MPH, FRCP (Edin) Editor-In-Chief, Cancer Investigation Professor of Medicine and Director Health Services, Effectiveness and Outcomes Research Division of Medical Oncology, Department of Medicine Duke University School of Medicine and the Duke Comprehensive Cancer Center Senior Fellow, Duke Center for Clinical Health Policy Research
 Editor-In-Chief, Cancer Investigation. Professor of Medicine and Director. Health Services, Effectiveness and Outcomes Research. Division of Medical Oncology, Department of Medicine. Duke University School of Medicine and the Duke Comprehensive Cancer Center. Senior Fellow, Duke Center for Clinical Health Policy Research.")
5
Complications of Cancer Chemotherapy
Title Slide 5 Subtitle Complications of Cancer Chemotherapy Myelosuppressive chemotherapy Neutropenia Febrile neutropenia (FN) Chemotherapy dose delays and dose reductions Complicated life-threatening infection and prolonged hospitalization Decreased relative dose intensity (RDI) Reduced survival Kuderer NM et al. Cancer 2006;106:2258–2266 Chirivella I et al. J Clin Oncol 2006;24;abstract 668 Bosly A et al. Ann Hematol 2007, advance access published 20 October 2007; doi: /s y
 Chemotherapy dose delays and dose reductions. Complicated life-threatening infection and prolonged hospitalization. Decreased relative dose intensity (RDI) Reduced survival. Kuderer NM et al. Cancer 2006;106:2258–2266. Chirivella I et al. J Clin Oncol 2006;24;abstract 668. Bosly A et al. Ann Hematol 2007, advance access published 20 October 2007; doi: /s y.")
6
Meta-analysis of Randomized Controlled Trials Relative risk of FN
Febrile Neutropeonia (n = 3182) RR 95% CI p 0.61 0.53–0.72 <.001 Combined filgrastim (n=9) 0.62 0.44–0.88 0.007 Combined lenograstim (n=5) 0.08 0.03–0.18 <.001 Combined pegfilgrastim (n=1) This meta-analysis of 17 RCTs also compared the efficacy of different G-CSF formulations on the incidence of FN. The Forest plot shows that no difference in G-CSF efficacy was observed between the studies with filgrastim (RR = 0.61; 95% CI ) compared with lenograstim (RR = 0.62; 95% CI ). Pegfilgrastim demonstrated significantly greater efficacy for FN reduction (RR = 0.08; 95% CI ) compared with filgrastim and lenograstim (p < ). This finding suggests that pegfilgrastim may be more efficacious than daily G-CSF, however it is should be interpreted with caution as only one study included in this meta-analysis used pegfilgrastim. Background study information These conclusions were drawn from a systematic review of RCTs, comparing G-CSF primary prophylaxis with placebo or untreated controls in adult solid tumour and malignant lymphoma patients. FN incidence was the primary outcome of this study, and was reported in 15 trials incorporating 3,182 patients. Reference Kuderer NM, Dale DC, Crawford J, et al. Impact of primary prophylaxis with granulocyte colony-stimulating factor on febrile neutropenia in adult cancer patients receiving chemotherapy: a systematic review. J Clin Oncol 2007;25: 0.54 0.43–0.67 <.001 All G-CSF (n=15) 0.1 0.2 0.5 1.0 2.0 5.0 10 Favours G-CSF Favours no G-CSF Kuderer et al. J Clin Oncol 2007;25:3158–3167
 RR. 95% CI. p –0.72. <.001. Combined filgrastim (n=9) – Combined lenograstim (n=5) –0.18. <.001. Combined pegfilgrastim (n=1) This meta-analysis of 17 RCTs also compared the efficacy of different G-CSF formulations on the incidence of FN. The Forest plot shows that no difference in G-CSF efficacy was observed between the studies with filgrastim (RR = 0.61; 95% CI ) compared with lenograstim (RR = 0.62; 95% CI ). Pegfilgrastim demonstrated significantly greater efficacy for FN reduction (RR = 0.08; 95% CI ) compared with filgrastim and lenograstim (p < ). This finding suggests that pegfilgrastim may be more efficacious than daily G-CSF, however it is should be interpreted with caution as only one study included in this meta-analysis used pegfilgrastim. Background study information. These conclusions were drawn from a systematic review of RCTs, comparing G-CSF primary prophylaxis with placebo or untreated controls in adult solid tumour and malignant lymphoma patients. FN incidence was the primary outcome of this study, and was reported in 15 trials incorporating 3,182 patients. Reference. Kuderer NM, Dale DC, Crawford J, et al. Impact of primary prophylaxis with granulocyte colony-stimulating factor on febrile neutropenia in adult cancer patients receiving chemotherapy: a systematic review. J Clin Oncol 2007;25: –0.67. <.001. All G-CSF (n=15) Favours G-CSF. Favours no G-CSF. Kuderer et al. J Clin Oncol 2007;25:3158–3167.")
7
Primary Prophylactic CSF Administration
Title Slide 7 Subtitle Primary Prophylactic CSF Administration Required and recommended for “dose dense” regimens Recommended for the prevention of FN in patients who have a high risk of FN based on: Age Medical history Disease characteristics Myelotoxicity of the chemotherapy regimen Clinical trial data support the use of CSF when the risk of FN is in the range of 20% or higher In making the decision to use prophylactic CSF or not, oncologists should consider not only the optimal chemotherapy regimen but also the individual patient risk factors and the intention of treatment, that is, curative, prolongation of life, or symptom control and palliation. Examples of appropriate use in the curative setting include adjuvant treatment of early-stage breast cancer with more intensive regimens such as TAC or FEC100 or the use of CHOP or CHOP-like regimens in aggressive non-Hodgkin’s lymphoma.

8
Primary Prophylactic CSF Administration: Special Circumstances
Title Slide 8 Subtitle Primary Prophylactic CSF Administration: Special Circumstances When the following clinical factors are present, primary prophylaxis with CSF is often appropriate even with regimens with FN rates of <20% : Age >65 years Poor performance status Previous FN Poor nutritional status Open wounds or active infections More advanced cancer Extensive prior treatment, including large XRT ports Administration of combined chemoradiotherapy Cytopenias due to bone marrow involvement by tumor Other serious comorbidities Please note that the 2000 update recommended the use of CSF when the risk of FN was 40% or higher. The ASCO CSF Panel does not recommend for or against any specific chemotherapy regimen. When available, alternative regimens offering equivalent efficacy but not requiring CSF support should be utilized. However, when regimens are used that have a FN incidence of about 20%, CSF have been proven to be effective and are recommended. Certain clinical factors or special circumstances can predispose a patient to experience complications from prolonged neutropenia. Though most commonly used regimens have risks of FN that are less than the required 20% needed to recommend CSF, when special circumstances are present it is often appropriate to use CSF even with regimens with FN rates of less than 20%.

9
Evidence-based G-CSF Guidelines Key Recommendations
Summary of Recommendations EORTC1 ASCO2 NCCN3 G-CSF primary prophylaxis with ≥20% overall FN risk FN risk associated with chemotherapy Consider patient risk factors for overall FN risk G-CSF primary prophylaxis to maintain chemotherapy RDI Dose-dense chemotherapy regimens G-CSF for ongoing FN episode G-CSF formulation and dosing Secondary prophylaxis with G-CSF From ‘Understanding and implementing the new G-CSF guidelines’ deck The current guidelines of EORTC,1 ASCO2 and NCCN3 contain broadly similar recommendations on the central issues in the use of G-CSF prophylaxis to reduce FN. The main recommendations of EORTC, ASCO and NCCN include The degree of FN risk associated with myelotoxic chemotherapy Patient-related risk factors for FN The use of G-CSF to maintain chemotherapy relative dose intensity (RDI), when reductions in RDI are associated with a poor prognosis The use of dose-dense chemotherapy regimens The risk threshold above which G-CSF prophylaxis has clinical benefits The therapeutic use of G-CSF for existing FN G-CSF formulation and dosing Secondary prophylaxis with G-CSF following an episode of FN in a previous cycle of chemotherapy Although the EORTC guidelines do not cover secondary prophylaxis, a previous episode of FN is considered a risk factor for FN in the current cycle of chemotherapy. The guidelines also place a strong emphasis on the assessment of overall FN risk, which should be individually assessed for each patient prior to each cycle of chemotherapy.3 G-CSF prophylaxis is recommended for all patients at ≥ 20% risk of FN. References Aapro MS, et al. Eur J Cancer In press. Smith TJ, et al. J Clin Oncol. 2006;24: NCCN. Myeloid growth factors V Available at: Last accessed 9 Feb, 2009. 1. Aapro et al. Eur J Cancer 2006;42:2433–2453; 2. Smith et al. J Clin Oncol 2006;24:3187–3205; NCCN. Myeloid growth factors V
, when reductions in RDI are associated with a poor prognosis. The use of dose-dense chemotherapy regimens. The risk threshold above which G-CSF prophylaxis has clinical benefits. The therapeutic use of G-CSF for existing FN. G-CSF formulation and dosing. Secondary prophylaxis with G-CSF following an episode of FN in a previous cycle of chemotherapy. Although the EORTC guidelines do not cover secondary prophylaxis, a previous episode of FN is considered a risk factor for FN in the current cycle of chemotherapy. The guidelines also place a strong emphasis on the assessment of overall FN risk, which should be individually assessed for each patient prior to each cycle of chemotherapy.3. G-CSF prophylaxis is recommended for all patients at ≥ 20% risk of FN. References. Aapro MS, et al. Eur J Cancer In press. Smith TJ, et al. J Clin Oncol. 2006;24: NCCN. Myeloid growth factors V Available at: Last accessed 9 Feb, Aapro et al. Eur J Cancer 2006;42:2433–2453; 2. Smith et al. J Clin Oncol 2006;24:3187–3205; 3. NCCN. Myeloid growth factors V")
10
Chemotherapy-Induced Acute Emesis Classes of Antiemetic
Highest therapeutic index antiemetic agents 5-HT3 Serotonin Receptor Antagonists Corticosteroids (Dexamethasone) NK1 Receptor Antagonists (Aprepitant) These classes of antiemetic agents Highly effective Few significant side effects (when used appropriately) Safe in combination Emetic Risk of IV Administered Antineoplastic Agents High (>90%) Moderate (30% to 90%) Low (10% to 30%) Minimal (<10%) Carmustine Cisplatin Cyclophosphamide > 1500 mg/m 2 Dacarbazine Dactinomycin Mechlorethamine Streptozotocin Carboplatin Cyclophosphamide<1500 mg/m Cytarabine >1 gm/m Daunorubicin Doxorubicin Epirubicin Idarubicin Ifosfamide Irinotecan Oxaliplatin 5 - Fluorouracil Bortezomib Cetuximab Cytarabine < 1000 Docetaxel Etoposide Gemcitabine Methotrexate Mitomycin Mitoxantrone Paclitaxel Pemetrexed Topotecan Trastuzumab Chlorodeoxyadenosine Bevacizumab Bleomycin Busulfan Fludarabine Rituximab Vinblastine Vincristine Vinorelbine
 NK1 Receptor Antagonists (Aprepitant) These classes of antiemetic agents. Highly effective. Few significant side effects (when used appropriately) Safe in combination. Emetic Risk of IV Administered Antineoplastic Agents. High (>90%) Moderate (30% to 90%) Low (10% to 30%) Minimal (<10%) Carmustine. Cisplatin. Cyclophosphamide. > mg/m. 2. Dacarbazine. Dactinomycin. Mechlorethamine. Streptozotocin. Carboplatin. Cyclophosphamide<1500 mg/m. Cytarabine >1 gm/m. Daunorubicin. Doxorubicin. Epirubicin. Idarubicin. Ifosfamide. Irinotecan. Oxaliplatin Fluorouracil. Bortezomib. Cetuximab. Cytarabine. < Docetaxel. Etoposide. Gemcitabine. Methotrexate. Mitomycin. Mitoxantrone. Paclitaxel. Pemetrexed. Topotecan. Trastuzumab. Chlorodeoxyadenosine. Bevacizumab. Bleomycin. Busulfan. Fludarabine. Rituximab. Vinblastine. Vincristine. Vinorelbine.")
11
Chemotherapy-Induced Acute Emesis Antiemetic Agents
Combinations of Antiemetics 5-HT3 Serotonin Receptor Antagonists Dexamethasone Aprepitant Yields greatest antiemetic protection in randomized-multicenter studies Chemotherapy of high emetic risk Anthracycline + Cyclophosphamide 5-HT3 Serotonin Receptor Antagonists Dexamethasone Indicated for patients receiving agents of moderate emetic risk other than anthracycline + cyclophosphamide Kris M et al, JCO 2006:24:

12
Antiemetic Regimens Based on Emetic Risk ASCO Guidelines
High (> 90%) Moderate (30-90%) Low (10-30%) 5-HT3 SRA: day 1 Dexamethasone: days 1-4 Aprepitant: days 1-3 5HT3 SRA: day 1 Dexamethasone: day 1 (2,3)* (may omit days 2,3 s/p aprepitant) (Aprepitant: days 1-3 for AC) (AC- anthracycline + cyclophosphamide) Dexamethasone: day 1 Kris M et al, JCO 2006:24:
 Moderate (30-90%) Low (10-30%) 5-HT3 SRA: day 1. Dexamethasone: days 1-4. Aprepitant: days HT3 SRA: day 1. Dexamethasone: day 1 (2,3)* (may omit days 2,3 s/p aprepitant) (Aprepitant: days 1-3 for AC) (AC- anthracycline + cyclophosphamide) Dexamethasone: day 1. Kris M et al, JCO 2006:24:")
14
Investigations • Innovation • Clinical Application
Optimizing Management of Cancer Patients at Risk for Venous Thromboembolism Program Chairman Gary H. Lyman, MD, MPH, FRCP (Edin) Editor-In-Chief, Cancer Investigation Professor of Medicine and Director Health Services, Effectiveness and Outcomes Research Division of Medical Oncology, Department of Medicine Duke University School of Medicine and the Duke Comprehensive Cancer Center Senior Fellow, Duke Center for Clinical Health Policy Research
 Editor-In-Chief, Cancer Investigation. Professor of Medicine and Director. Health Services, Effectiveness and Outcomes Research. Division of Medical Oncology, Department of Medicine. Duke University School of Medicine and the Duke Comprehensive Cancer Center. Senior Fellow, Duke Center for Clinical Health Policy Research.")
15
Tumor Cells Hemostatic System Growth Invasion Metastases Angiogenesis
Procoagulant Activity Tumor cells 1. release procoagulants activating coagulation system and blood cells; 2. stimulate release of cytokines and growth factors activating angiogenesis; 3. inhibit fibrinolytic system Hemostatic system: TF/FVIIa, FXa. Thrombin stimulate tumor growth, invasiveness, metastases, angiogenesis Cytokines Growth Factors Fibrinolytic Activity Kuderer NM et al J Clin Oncol 2009; 27:

16
VTE Inpatient Risk and Mortality Hospitalized Cancer Patients*
133 U.S. academic medical centers, 1995 – 2003 7.0 6.5 20 6.0 VTE- patients on chemo 18 VTE 5.5 16 5.0 4.5 14 4.0 Rate of VTE (%) VTE-all patients 12 3.5 10 3.0 Inpatient Mortality (%) 2.5 DVT-all patients 8 No VTE 2.0 P<0.0001 6 1.5 Consistent with prior reports, we found that the increased diagnosis of VTE continued to be strongly associated with adverse consequences for patients. Mortality was significantly and consistently greater among patients who developed VTE as compared to patients who did not over the duration of study (16.3% versus 6.3%, P<0.0001). Overall, however, the risk of in-hospital mortality declined from 1995 to 2003 both for patients who did and did not develop VTE (P< for trend for each). 4 P<0.0001 1.0 PE-all patients 2 0.5 0.0 1995 1996 1997 1998 1999 2000 2001 2002 2003 1995 1996 1997 1998 1999 2000 2001 2002 2003 * n = 1,015,598 Khorana et al. Cancer 2007; 110: 16
 VTE-all patients Inpatient Mortality (%) 2.5. DVT-all patients. 8. No VTE P< Consistent with prior reports, we found that the increased diagnosis of VTE continued to be strongly associated with adverse consequences for patients. Mortality was significantly and consistently greater among patients who developed VTE as compared to patients who did not over the duration of study (16.3% versus 6.3%, P<0.0001). Overall, however, the risk of in-hospital mortality declined from 1995 to 2003 both for patients who did and did not develop VTE (P< for trend for each). 4. P< PE-all patients * n = 1,015,598. Khorana et al. Cancer 2007; 110:")
17
Cancer and Venous Thromboembolism Risk of VTE Varies Over Natural History of Cancer
8 7 6 5 4 3 2 1 Hospitalization End of life Chemotherapy Metastasis Diagnosis Relative Risk Risk in cancer population Remission Risk in general population Time Rao MV, et al. In: Khorana and Francis, eds. Cancer-Associated Thrombosis; 2007

18
Risk Factors for VTE in Patients with Cancer
Patient-related factors Older age Race Higher in AA Lower in Asians Major comorbidities History of VTE Treatment-related factors Major surgery Hospitalization Chemotherapy Central venous catheters Hormonal therapy Antiangiogenic agents ESAs ?Transfusions Cancer-related factors Site of cancer Advanced stage Rao MV, et al. In: Khorana and Francis, eds. Cancer-Associated Thrombosis; 2007

19
Important Consequences of
VTE in Cancer Patients Increased morbidity Hospitalization Anticoagulation Postphlebitic syndrome Increased mortality Increased risk of recurrent VTE Bleeding complications Cancer treatment delays Increased healthcare costs

20
Ambulatory Cancer Patients Receiving Chemotherapy
Prospective Study at 115 Randomly Selected US Practice Sites March 2002 – February 2006 [N = 4,458] Cumulative Incidence of VTE HR = 4.90 [ ], P<.0001 All Cause Early Mortality Kuderer NM et al; J Clin Oncol 2008

21
ASCO Clinical Practice Guidelines
Recommendations for Venous Thromboembolism Prophylaxis and Treatment in Patients with Cancer ASCO Clinical Practice Guidelines Lyman GH et al: J Clin Oncol 2007; 25:

22
Clinical Questions Should patients with cancer receive anticoagulation for VTE prophylaxis while hospitalized? √ Should ambulatory patients with cancer receive anticoagulation for VTE prophylaxis during systemic chemotherapy? √ Should patients with cancer undergoing surgery receive perioperative VTE prophylaxis? What is the best method for treatment of patients with cancer with established VTE to prevent recurrence? √ Should patients with cancer receive anticoagulants in the absence of established VTE to improve survival? √ Lyman GH et al: J Clin Oncol 2007; 25: 22

23
ASCO Recommendations for VTE Prophylaxis in Patients with Cancer
Hospitalized patients with cancer should be considered candidates for VTE prophylaxis in the absence of bleeding or other contraindications to anticoagulation. Lyman GH et al: J Clin Oncol 2007; 25: 23

24
Anticoagulant Prophylaxis to Prevent Screen-Detected VTE
High Risk Hospitalized Medical Patients 3 large, randomized, placebo-controlled, double-blind trials in medical patients at high risk including cancer MEDENOX (enoxaparin)1 ~ 15% PREVENT (dalteparin)2 ~5% ARTEMIS (fondaparinux)3 ~15% Screening for asymptomatic DVT with venography or ultrasound 1Samama MM, et al. N Engl J Med. 1999;341: Leizorovicz A, et al. Circulation. 2004;110:874-9 3Cohen AT, et al. BMJ 2006; 332:
1 ~ 15% PREVENT (dalteparin)2 ~5% ARTEMIS (fondaparinux)3 ~15% Screening for asymptomatic DVT with venography or ultrasound. 1Samama MM, et al. N Engl J Med. 1999;341: Leizorovicz A, et al. Circulation. 2004;110: Cohen AT, et al. BMJ 2006; 332:")
25
Anticoagulant Prophylaxis to Prevent Screen-Detected VTE
High Risk Hospitalized Medical Patients: VTE RRR 63% 45% 47% Study RRR Thromboprophylaxis Patients with VTE (%) MEDENOX1 Placebo 14.9 P < 0.001 Enoxaparin 40 mg 5.5 PREVENT2 Placebo 5.0 P = Dalteparin 5,000 units 2.8 Data NOT specific to cancer patients Placebo 10.5 ARTEMIS3 Fondaparinux 2.5 mg 5.6 1Samama MM, et al. N Engl J Med. 1999;341: Leizorovicz A, et al. Circulation. 2004;110:874-9 3Cohen AT, et al. BMJ 2006; 332: 25
 MEDENOX1. Placebo P < Enoxaparin 40 mg PREVENT2. Placebo P = Dalteparin 5,000 units Data NOT specific to cancer patients. Placebo ARTEMIS3. Fondaparinux 2.5 mg Samama MM, et al. N Engl J Med. 1999;341: Leizorovicz A, et al. Circulation. 2004;110: Cohen AT, et al. BMJ 2006; 332:")
26
Anticoagulant Prophylaxis to Prevent Screen-Detected VTE
High Risk Hospitalized Medical Patients: Major Bleeding 1.7% 1.1% Incidence of Major Bleeding (%) 0.49% Data NOT specific to cancer patients 0.16% 0.2% Study Samama MM, et al. N Engl J Med. 1999;341: Leizorovicz A, et al. Circulation. 2004;110:874-9 Cohen AT, et al. BMJ 2006; 332: 26
 0.49% Data NOT specific to cancer patients. 0.16% 0.2% Study. Samama MM, et al. N Engl J Med. 1999;341: Leizorovicz A, et al. Circulation. 2004;110: Cohen AT, et al. BMJ 2006; 332:")
27
ASCO Recommendations for VTE Prophylaxis in Patients with Cancer
Ambulatory Cancer Patients Routine prophylaxis with an antithrombotic agent in the ambulatory setting is not recommended. NOTE: Patients receiving thalidomide or lenalidomide with chemotherapy or dexamethasone are at high risk for thrombosis and warrant prophylaxis. LMWH or adjusted dose warfarin (INR~1.5) is recommended.* * This recommendation is based on extrapolation from studies of prophylaxis in other high risk cancer settings. Lyman GH et al: J Clin Oncol 2007; 25: 27
 is recommended.* * This recommendation is based on extrapolation from studies of prophylaxis in other high risk cancer settings. Lyman GH et al: J Clin Oncol 2007; 25:")
28
Characteristics of Prophylaxis Studies VTE – Prophylaxis with LMWH
Title Slide 28 Subtitle Title Slide 28 Subtitle Title Slide 28 Subtitle Trial Year Stage N LMWH / Dose Control Arm Duration Type of Pub Specific Chemo FAMOUS Solid Tumors 2004 III/IV 385 Dalteparin Placebo 12 months Manuscript No TOPIC-I Breast Cancer 2005 353 Certoparin 6 months Abstract+ TOPIC-2 NSCLC 547 PRODIGE Glioma 2007 Any 186 6-12 months Abstract SIDERAS 2006 IV 141 Non-Placebo Indefinitely PROTECHT 2008 1166 Nadroparin 2:1 Placebo < 4 months with chemo CONKO-04 Pancreatic Cancer 2009 Advanced 312 Enoxaparin 3 months (to prog) Yes* FRAGEM Pancreatic Cancer 123 Dalteparin# => [Studies]: A total of 8 RCTs were identified. [Tumor type]: Most studies included a mix of solid tumors. 2 studies were performed in pancreatic CA pts. => [Stage]:All but 1 study were limited to advance solid tumors. => [size]: Study sizes varied mostly from small to moderate. => [Dose]: Most trials utilized prophylactic LMWH dosing, except the 2 pancreatic CA studies, Which used higher doses. => [placebo]: Most studies were placebo-controlled. => [Duration]: The duration of LMWH varied, but more recent studies focused on 3-4 months, with the CONKO-study also collecting longer-term data. => [manuscript]: Surprisingly, only 3 studies are currently published in manuscript format. => [chemo]: Only the 2 pancreatic CA studies specified chemotherapy, both gemcitabine-based. ________________________________________ No significant heterogeneity was observed across trials (except for VTE ARD outcome). including 60/1,745 receiving LMWH and 101/1,338 controls. *Gemcitabine-based chemotherapy (1000 mg/m2) # Higher dose than standard prophylactic dose
 Yes* FRAGEM Pancreatic Cancer Dalteparin# => [Studies]: A total of 8 RCTs were identified. [Tumor type]: Most studies included a mix of solid tumors. 2 studies were performed in pancreatic CA pts. => [Stage]:All but 1 study were limited to advance solid tumors. => [size]: Study sizes varied mostly from small to moderate. => [Dose]: Most trials utilized prophylactic LMWH dosing, except the 2 pancreatic CA studies, Which used higher doses. => [placebo]: Most studies were placebo-controlled. => [Duration]: The duration of LMWH varied, but more recent studies focused on 3-4 months, with the CONKO-study also collecting longer-term data. => [manuscript]: Surprisingly, only 3 studies are currently published in manuscript format. => [chemo]: Only the 2 pancreatic CA studies specified chemotherapy, both gemcitabine-based. ________________________________________. No significant heterogeneity was observed across trials (except for VTE ARD outcome). including 60/1,745 receiving LMWH and 101/1,338 controls. *Gemcitabine-based chemotherapy (1000 mg/m2) # Higher dose than standard prophylactic dose.")
29
Systematic Review of LMWH Prophylaxis in Cancer Patients
VTE Versus Major Bleeding: Absolute Risk Cancer Type Benefit Harm Venous Thromboembolism Major Bleeding Overall 3.1% 0.9% Pancreatic 13.0% 0.8% Non-Pancreatic 1.4% Kuderer NM et al. ASH Oral Presentation 2009

30
Risk Factors Risk score
Clinical Risk Model for Chemotherapy-associated VTE Risk Score Based on Pretreatment Risk Factors Title Slide 30 Subtitle Risk Factors Risk score 1. Site of cancer a) Very high risk cancer (stomach, pancreas) 2 b) High risk (lung, lymphoma, gynecologic, bladder, testicular) 1 2. Platelet count >350,000/mm3 3. Hemoglobin level < 10 g/dL or use of Red cell growth factors 4. Leukocyte count >11,000 /mm3 5. BMI > 35 kg/m2 We have recently developed and validated a clinical risk model for chemotherapy-associated venous thrombosis. This model includes the following risk factors: The site of cancer: with a very high risk cancer category (including stomach and pancreatic CA), and a high risk cancer group (lung, lymphoma, gynecologic, bladder, testicular cancer). 2. Prechemotherapy platelet count >350 x 109/L 3. Hemoglobin level < 10 g/dL or use of Red cell growth factors 4. Prechemotherapy leukocyte count >11,000/mm3 5. BMI > 35 kg/m2 Khorana AA et al. Blood. 2008; 111:
 Very high risk cancer (stomach, pancreas) 2 b) High risk (lung, lymphoma, gynecologic, bladder, testicular) 1 2. Platelet count >350,000/mm3. 3. Hemoglobin level < 10 g/dL or use of. Red cell growth factors 4. Leukocyte count >11,000 /mm3. 5. BMI > 35 kg/m2. We have recently developed and validated a clinical risk model for chemotherapy-associated venous thrombosis. This model includes the following risk factors: The site of cancer: with a very high risk cancer category (including stomach and pancreatic CA), and a high risk cancer group (lung, lymphoma, gynecologic, bladder, testicular cancer). 2. Prechemotherapy platelet count >350 x 109/L. 3. Hemoglobin level < 10 g/dL or use of. Red cell growth factors 4. Prechemotherapy leukocyte count >11,000/mm3. 5. BMI > 35 kg/m2. Khorana AA et al. Blood. 2008; 111:")
31
VTE Prediction Risk Score Chemotherapy – Associated Thrombosis
Title Slide 31 Subtitle 8% 8% 7.1% 7% 7% 6.7% 6.7% Development cohort 6% 6% Validation cohort 5% 5% Rate of VTE (%) 4% 4% 3% 3% We have recently confirmed, that based on our VT risk score we can categorize patients into three major VT risk groups Utilizing only readily available clinical parameters However, improved identification of at-risk patients remains a clinically need. 2.0% 2.0% 1.8% 2% 2% 0.8% 1% 1% 0.3% 0.3% 0% 0% n=374 n=374 n=734 n=734 n=1,627 n=1,627 n=842 n=842 n=340 n=340 n=149 n=149 RISK SCORE: Low (0) Intermediate (1-2) High (>3) Khorana AA et al. Blood. 2008; 111:
 4% 4% 3% 3% We have recently confirmed, that based on our VT risk score. we can categorize patients into three major VT risk groups. Utilizing only readily available clinical parameters. However, improved identification of at-risk patients remains a clinically need. 2.0% 2.0% 1.8% 2% 2% 0.8% 1% 1% 0.3% 0.3% 0% 0% n=374. n=374. n=734. n=734. n=1,627. n=1,627. n=842. n=842. n=340. n=340. n=149. n=149. RISK SCORE: Low (0) Intermediate (1-2) High (>3) Khorana AA et al. Blood. 2008; 111:")
32
Mortality and Progression-Free Survival By VTE Risk Score
Outcomes Low Risk N=1,206 Intermediate Risk N=2,709 High Risk N=543 All N=4,458 Mortality Risk (%) 1.2% 5.9% 12.7% 5.6% HR [+/- CI] 1.0 3.6 [ ] 6.9 [ ] - Progression-free survival 93% 82% 72% 84% 2.8 [2-3.9] 4.3 [ ] Kuderer NM et al. ASH 2008
 1.2% 5.9% 12.7% 5.6% HR [+/- CI] [ ] 6.9 [ ] - Progression-free survival. 93% 82% 72% 84% 2.8 [2-3.9] 4.3 [ ] Kuderer NM et al. ASH")
33
ASCO Recommendations for VTE Prophylaxis in Patients with Cancer
Preventing Recurrence in Cancer Patients with Established VTE LMWH is the preferred approach for the initial 5 to 10 days of anticoagulant treatment of the patient with cancer with established VTE. LMWH for at least 6 months is also preferred for long-term anticoagulant therapy. After 6 months, indefinite anticoagulant therapy should be considered for patients with active cancer. NOTE: Vena cava filters are only indicated for patients with contraindications to anticoagulant therapy and in those with recurrent VTE despite adequate long-term therapy with LMWH. Lyman GH et al: J Clin Oncol 2007; 25: 33

34
Recurrent VTE and Bleeding During Anticoagulant Treatment
Patients with cancer and venous thrombosis 30 30 Hazard ratio 3.2 [ ] Hazard ratio 2.2 [ ] Cancer 21% 20 20 Cancer 12% Recurrent VTE, % Major Bleeding, % 10 10 No Cancer 7% No Cancer 5% 1 2 3 4 5 6 7 8 9 10 11 12 1 2 3 4 5 6 7 8 9 10 11 12 Time (months) Time (months) Prandoni P et al. Blood 2002; 100:
 Time (months) Prandoni P et al. Blood 2002; 100:")
35
RCTs of Long-term Treatment in Cancer Patients with VTE
RCTs of LMWH vs. Vitamin K Antagonists in Cancer Study No. Long-Term Treatment Recurrent VTE, % Major Bleed, % Death, % Meyer1 2002 71 Warfarin 21.1* 22.7 67 Enoxaparin 1.5 mg/kg 10.5* 11.3 Lee2 2003 336 17* 4 41 Dalteparin 200/150 IU/kg 9* 6 39 Deitcher3 2006 30 10 2.9 8.8 29 Enoxaparin 1.0 mg/kg 6.9 6.5 32 6.3 11.1 19.4 Hull4 100 10* 7 19 Tinzaparin 175 IU/kg 6* 20 * P < .05 1. Meyer G, et al. Arch Intern Med. 2002;162: Lee AY, et al. N Engl J Med. 2003;349: Deitcher SR, et al. Clin Appl Thromb Hemost. 2006;12: Hull RD, et al. Am J Med. 2006;119:

36
The CLOT Trial Study Schema
Control Group Dalteparin 200 IU/kg OD Vitamin K antagonist (INR 2.0 to 3.0) x 6 mo Randomization Experimental Group Source: Protocol Dalteparin 200 IU/kg OD x 1 mo then ~150 IU/kg OD x 5 mo 5 to 7 days 1 month 6 months Lee AY, et al. N Engl J Med. 2003;349: Slide #6
 x 6 mo. Randomization. Experimental Group. Source: Protocol. Dalteparin 200 IU/kg OD x 1 mo then ~150 IU/kg OD x 5 mo. 5 to 7 days. 1 month. 6 months. Lee AY, et al. N Engl J Med. 2003;349: Slide #6.")
37
Results: Symptomatic Recurrent VTE
The CLOT Trial: Results: Symptomatic Recurrent VTE 5 10 15 20 25 Days Post Randomization 30 60 90 120 150 180 210 Probability of Recurrent VTE, % dalteparin, 9% VKA, 17% risk reduction = 52% HR 0.48 (95% CI 0.30, 0.77) log-rank p = 0.002 Lee AY, et al. N Engl J Med. 2003;349:
 log-rank p = Lee AY, et al. N Engl J Med. 2003;349:")
38
ASCO Recommendations for VTE Prophylaxis in Patients with Cancer
Improving survival in absence of established VTE Anticoagulants are not recommended at this time as treatment to improve survival in patients with cancer without VTE. Participation in clinical trials designed to evaluate anticoagulant therapy as an adjunct to standard anticancer therapies is encouraged. Lyman GH et al: J Clin Oncol 2007; 25: 38

39
Systematic Review of Anticoagulants
as Cancer Treatment Impact on All Cause Mortality Kuderer, N. M. et al. J Clin Oncol; 27: Kuderer NM, et al. Cancer. 2007;110:

40
Systematic Review of Anticoagulants
as Cancer Treatment Impact on Major Bleeding Kuderer, N. M. et al. J Clin Oncol; 27: Kuderer NM, et al. Cancer. 2007;110:

41
ASCO Recommendations for VTE Prophylaxis in Patients with Cancer
Summary Patient Group Recommended Not Recommended Hospitalized patients with cancer VTE prophylaxis with anticoagulants If bleeding or contraindication to anticoagulation Ambulatory patients with cancer receiving chemotherapy Myeloma patients receiving thalidomide or lenalidomide + chemotherapy/ dexamethasone. LMWH or adjusted dose warfarin. Otherwise, no routine prophylaxis Patients with cancer undergoing surgery Prophylaxis with low-dose UFH or LMWH Prophylaxis with mechanical methods for patients with contraindications to pharmacologic methods Consider mechanical methods when contraindications to anticoagulation. Patients with cancer with established VTE Anticoagulation for at least 6 months. Consider continued anticoagulation beyond 6 months in those with active cancer. - To improve survival Not recommended Lyman GH et al: J Clin Oncol 2007; 25: 41

42
Recommendations for Primary Prevention of VTE in Patients With Cancer
Comparisons of Guideline Panels Modified from Khorana AA et al J Clin Oncol 2009; 27:

43
Unanswered Questions A Call to Action for Future Research
Prevention of VTE in the ambulatory patient with cancer: A role for targeted prophylaxis? Prevention of VTE in the hospitalized patient with cancer: a need for cancer-specific studies? Optimal treatment of recurrent VTE Management of incidental or screen-detected VTE Impact of anticoagulation on survival of patients with cancer Khorana AA et al J Clin Oncol 2009; 27:

44
Cancer and Venous Thromboembolism Conclusions
Title Slide 44 Subtitle VTE is a common complication of cancer and cancer treatment and is associated with considerable morbidity, mortality and costs. Hospitalized medical and surgical cancer patients are at increased risk for VTE and should be considered for pharmacologic prophylaxis if no contraindication to anticoagulation exists. Cancer patients treated for documented VTE should be considered for continued anticoagulation, preferably with LMWH, for up to 6 months or longer in patients with active malignancy. Routine thromboprophylaxis of ambulatory cancer patients is not currently recommended. While cancer patients experienced a significant reduction in VTE with LMWH None of the trials by themselves showed statistical significant results for VTE outcome Questions remain, especially regarding: bleeding risk, patient monitoring requirements, safety with different cancer therapies, timing or length of prophylaxis Further studies are required, before routine VTE prophylaxis in ambulatory cancer patients can be recommended. Clinical VTE prediction models are promising: Further, improved risk stratification is required for optimal risk-benefit ration for VTE prophylaxis Novel strategies may aid in the targeting of prophylactic strategies Both, VTE itself and the venous thrombosis risk score are: Independent predictors for early mortality Further potential evidence between the link of VTE and more aggressive or less treatment responsive tumors Understanding the ‘biologic VTE phenotype’ may shed further light on our understanding of tumor biology

45
Cancer and Venous Thromboembolism Conclusions
Title Slide 45 Subtitle Prophylaxis may be considered in selective high risk settings such as multiple myeloma patients receiving thalidomide/lenalidomide . Consideration of prophylactic anticoagulation in cancer patients must always balance the risk of VTE with the increased risk of bleeding and other complications. Improved methods for the identification of cancer patients at high risk for VTE and candidates for targeted thromboprophylaxis are needed and under active investigation. While cancer patients experienced a significant reduction in VTE with LMWH None of the trials by themselves showed statistical significant results for VTE outcome Questions remain, especially regarding: bleeding risk, patient monitoring requirements, safety with different cancer therapies, timing or length of prophylaxis Further studies are required, before routine VTE prophylaxis in ambulatory cancer patients can be recommended. Clinical VTE prediction models are promising: Further, improved risk stratification is required for optimal risk-benefit ration for VTE prophylaxis Novel strategies may aid in the targeting of prophylactic strategies Both, VTE itself and the venous thrombosis risk score are: Independent predictors for early mortality Further potential evidence between the link of VTE and more aggressive or less treatment responsive tumors Understanding the ‘biologic VTE phenotype’ may shed further light on our understanding of tumor biology

46
Chemotherapy-Induced Nausea and Vomiting (CINV)
Investigations • Innovation • Clinical Application Chemotherapy-Induced Nausea and Vomiting (CINV) Optimizing Clinical Management Lee S. Schwartzberg, MD, FACP Supportive Oncology Services, Memphis Accelerated Community Oncology Research Network Clinical Professor of Medicine University of Tennessee Medical Center Memphis, Tennessee
 Optimizing Clinical Management. Lee S. Schwartzberg, MD, FACP. Supportive Oncology Services, Memphis. Accelerated Community Oncology Research Network. Clinical Professor of Medicine. University of Tennessee Medical Center. Memphis, Tennessee.")
47
Chemotherapy Experienced Patients Rank Severe CINV Near Death
Moderate Delayed Nausea Poorly Controlled Acute & Delayed CINV Median VAS Scores Complete Control Death Preliminary preference (utility) data from nausea and vomiting health states from 3 studies involving ovarian cancer patients, clinicians, and healthy female controls were evaluated. Preferences were assessed using the visual analog scale (VAS), with scores ranging from 0.0 (worst) to 1.0 (best). Definitions of CINV were: CINV 1 - Days 1-5 = little to no nausea or vomiting. CINV 2 - Day 1 = complete control; Days 2-5 = moderate nausea, no vomiting. CINV 3 - Day 1 = complete control; Days 2-5 = moderate nausea, severe vomiting. CINV 4 - Day 1 = nausea and vomiting; Days 2-5 = moderate nausea. CINV 5 - Day 1 = nausea and vomiting; Days 2-5 = moderate nausea, severe vomiting. CINV 6 - Day 1 = complete control; Days 2-5 = severe nausea. Patients rated significant CINV (CINV 3-6) comparable to the score for death. 1. Sun C, Bodurka D, Donato M et al. Nausea and vomiting side-effects of cancer therapies: preference assessments from patients, health care providers and healthy women. Support Care Cancer. 2002:10:378. Abstract #93. Mucositis Remission Perfect Health CINV 1 Current Health Alopecia Taste Change Depression Ototoxicity Weight Gain Sexual Dysfunction Memory loss Constipation Leg pain Fatigue Flu Peripheral Neuropathy CINV 2 Febrile Neutropenia Thrombocytopenia Diarrhea Mucositis Dysuria CINV 3 CINV 4 CINV 6 CINV 5 Death Sun C et al. Support Care Cancer. 2005
 data from nausea and vomiting health states from 3 studies involving ovarian cancer patients, clinicians, and healthy female controls were evaluated. Preferences were assessed using the visual analog scale (VAS), with scores ranging from 0.0 (worst) to 1.0 (best). Definitions of CINV were: CINV 1 - Days 1-5 = little to no nausea or vomiting. CINV 2 - Day 1 = complete control; Days 2-5 = moderate nausea, no vomiting. CINV 3 - Day 1 = complete control; Days 2-5 = moderate nausea, severe vomiting. CINV 4 - Day 1 = nausea and vomiting; Days 2-5 = moderate nausea. CINV 5 - Day 1 = nausea and vomiting; Days 2-5 = moderate nausea, severe vomiting. CINV 6 - Day 1 = complete control; Days 2-5 = severe nausea. Patients rated significant CINV (CINV 3-6) comparable to the score for death. 1. Sun C, Bodurka D, Donato M et al. Nausea and vomiting side-effects of cancer therapies: preference assessments from patients, health care providers and healthy women. Support Care Cancer. 2002:10:378. Abstract #93. Mucositis. Remission. Perfect Health. CINV 1. Current Health. Alopecia. Taste Change. Depression. Ototoxicity. Weight Gain. Sexual Dysfunction. Memory loss. Constipation. Leg pain. Fatigue. Flu. Peripheral Neuropathy. CINV 2. Febrile Neutropenia. Thrombocytopenia. Diarrhea. Mucositis. Dysuria. CINV 3. CINV 4. CINV 6. CINV 5. Death. Sun C et al. Support Care Cancer")
48
Types of CINV: Definitions
Acute (posttreatment) Occurs within first 24 hours after administration of cancer chemotherapy Delayed CINV that begins after first 24 hours May last for 120 hours Anticipatory Learned or conditioned response from poorly controlled nausea and vomiting associated with previous chemotherapy Breakthrough CINV that occurs despite prophylaxis and requires rescue Chemotherapy-induced nausea and vomiting (CINV) falls into 3 distinct phases. Familiarity with these is useful for planning prophylactic treatment. Acute CINV is defined as nausea and/or vomiting that occurs within 24 hours of the administration of cancer chemotherapy. Delayed CINV is defined as nausea and vomiting that occurs after the first 24 hours. It may last for as long as 120 hours after administration of cancer chemotherapy. Anticipatory CINV is nausea and vomiting that occurs as a learned response or conditioning. It generally occurs during subsequent cycles of chemotherapeutic treatment when CINV has been poorly managed following previous cycles of chemotherapy. Anticipatory CINV occurs before, during, or after chemotherapy, but usually earlier than an episode of acute CINV would be expected to occur. Anticipatory CINV does not respond to antiemetic agents or other pharmacologic interventions, but has been shown to respond to behavioral modifications or nonpharmacologic approaches. It is preferable to preempt anticipatory CINV by ensuring adequate control of CINV with the first course of emesis-producing chemotherapy. American Society of Health-System Pharmacists. ASHP therapeutic guidelines on the pharmacologic management of nausea and vomiting in adult and pediatric patients receiving chemotherapy or radiation therapy or undergoing surgery. Am J Health Syst Pharm. 1999;56:
 Occurs within first 24 hours after administration of cancer chemotherapy. Delayed. CINV that begins after first 24 hours. May last for 120 hours. Anticipatory. Learned or conditioned response from poorly controlled nausea and vomiting associated with previous chemotherapy. Breakthrough. CINV that occurs despite prophylaxis and requires rescue. Chemotherapy-induced nausea and vomiting (CINV) falls into 3 distinct phases. Familiarity with these is useful for planning prophylactic treatment. Acute CINV is defined as nausea and/or vomiting that occurs within 24 hours of the administration of cancer chemotherapy. Delayed CINV is defined as nausea and vomiting that occurs after the first 24 hours. It may last for as long as 120 hours after administration of cancer chemotherapy. Anticipatory CINV is nausea and vomiting that occurs as a learned response or conditioning. It generally occurs during subsequent cycles of chemotherapeutic treatment when CINV has been poorly managed following previous cycles of chemotherapy. Anticipatory CINV occurs before, during, or after chemotherapy, but usually earlier than an episode of acute CINV would be expected to occur. Anticipatory CINV does not respond to antiemetic agents or other pharmacologic interventions, but has been shown to respond to behavioral modifications or nonpharmacologic approaches. It is preferable to preempt anticipatory CINV by ensuring adequate control of CINV with the first course of emesis-producing chemotherapy. American Society of Health-System Pharmacists. ASHP therapeutic guidelines on the pharmacologic management of nausea and vomiting in adult and pediatric patients receiving chemotherapy or radiation therapy or undergoing surgery. Am J Health Syst Pharm. 1999;56:")
49
Emetogenic Potential of Single Antineoplastic Agents
HIGH Risk in nearly all patients (> 90%) MODERATE Risk in 30% to 90% of patients LOW Risk in 10% to 30% of patients MINIMAL Fewer than 10% at risk Emetogenic Potential of Single Antineoplastic Agents Shown are agents of moderate to high emetic risk. Low emetic risk (Level 2; 10-30% frequency of emesis) and minimal emetic risk (Level 1; <10% frequency of emesis) agents are also detailed in NCCN guidelines v but not shown here. Frequency of emesis shown are proportions of patients who experience emesis in the absence of effective antiemetic prophylaxis. 1NCCN guidelines v Available at
 MODERATE. Risk in 30% to 90% of patients. LOW. Risk in 10% to 30% of patients. MINIMAL. Fewer than 10% at risk. Emetogenic Potential of Single Antineoplastic Agents. Shown are agents of moderate to high emetic risk. Low emetic risk (Level 2; 10-30% frequency of emesis) and minimal emetic risk (Level 1; <10% frequency of emesis) agents are also detailed in NCCN guidelines v but not shown here. Frequency of emesis shown are proportions of patients who experience emesis in the absence of effective antiemetic prophylaxis. 1NCCN guidelines v Available at")
51
Patient-Specific Risk Factors for CINV
Age <50 years Women > men History of light alcohol use History of vomiting with prior exposure to chemotherapeutic agents Other risks History of motion sickness History of nausea or vomiting during pregnancy History of anxiety Individuals bring to chemotherapy a unique set of characteristics that moderate their responses—positive and negative—to treatment. Patient risk factors that increase the likelihood of developing CINV are listed on the slide. Age <50 years Women more likely than men to develop CINV History of light alcohol use; people who drink more heavily are less likely to develop CINV History of nausea or vomiting associated with pregnancy or motion sickness History of CINV associated with prior exposure to chemotherapeutic agents Patients who have a tendency to be anxious are at increased risk ASHP. Am J Health Syst Pharm. 1999:56: ; Balfour and Goa. Drugs. 1997:54: American Society of Health-System Pharmacists. ASHP therapeutic guidelines on the pharmacologic management of nausea and vomiting in adult and pediatric patients receiving chemotherapy or radiation therapy or undergoing surgery. Am J Health Syst Pharm. 1999;56: Balfour JA, Goa KL. Dolasetron: a review of its pharmacology and therapeutic potential in the management of nausea and vomiting induced by chemotherapy, radiotherapy or surgery. Drugs. 1997;54:

52
Other Causes of Nausea and Vomiting in Cancer patients
Brain metastases Electrolyte disturbances Gastoparesis Concurrent medications Bowel obstruction Vestibular dysfunction

53
Pathophysiology of Chemotherapy-Induced Emesis
Two sites in the brainstem—the vomiting center and the chemoreceptor trigger zone—are important to emesis control. The vomiting center consists of an intertwined neural network in the nucleus tractus solitarius that controls patterns of motor activity. The chemoreceptor trigger zone, located in the area postrema, is the entry point for emetogenic stimuli. Enterochromaffin cells in the gastrointestinal tract respond to chemotherapy by releasing serotonin. Serotonin binds to 5-HT3 receptors, which are located not only in the gastrointestinal tract, but also on vagal afferent neurons and in the nucleus tractus solitarius and the area postrema. The activated 5-HT3 receptors signal the chemoreceptor trigger zone via pathways that may include the afferent fibers of the vagus nerve. Serotonin also may bind with 5-HT3 receptors in the brainstem. Other neurotransmitters, including dopamine and substance P, also influence the chemoreceptor trigger zone. Afferent impulses from the chemoreceptor trigger zone stimulate the vomiting center, which initiates emesis.1 1. Grunberg SM, Hesketh PJ. Control of chemotherapy-induced emesis. N Engl J Med. 1993;329:

54
Pharmacologic Agents for Prevention of CINV
Corticosteroids Dopamine antagonists Serotonin (5-HT3) antagonists NK-1 receptor antagonists Four classes of drugs are commonly used to treat CINV: corticosteroids, dopamine antagonists, serotonin antagonists, and NK-1 receptor antagonists. Corticosteroids and 5-HT3 receptor antagonists, alone or in combination, are recommended for treatment of acute CINV. The newest class of drugs approved to treat CINV is the NK-1 receptor antagonist. American Society of Health-System Pharmacists. ASHP therapeutic guidelines on the pharmacologic management of nausea and vomiting in adult and pediatric patients receiving chemotherapy or radiation therapy or undergoing surgery. Am J Health Syst Pharm. 1999;56: Hesketh PJ, Van Belle S, Aapro M, et al. Differential involvement of neurotransmitters through the time course of cisplatin-induced emesis as revealed by therapy with specific receptor antagonists. Eur J Cancer. 2003;39:
 antagonists. NK-1 receptor antagonists. Four classes of drugs are commonly used to treat CINV: corticosteroids, dopamine antagonists, serotonin antagonists, and NK-1 receptor antagonists. Corticosteroids and 5-HT3 receptor antagonists, alone or in combination, are recommended for treatment of acute CINV. The newest class of drugs approved to treat CINV is the NK-1 receptor antagonist. American Society of Health-System Pharmacists. ASHP therapeutic guidelines on the pharmacologic management of nausea and vomiting in adult and pediatric patients receiving chemotherapy or radiation therapy or undergoing surgery. Am J Health Syst Pharm. 1999;56: Hesketh PJ, Van Belle S, Aapro M, et al. Differential involvement of neurotransmitters through the time course of cisplatin-induced emesis as revealed by therapy with specific receptor antagonists. Eur J Cancer. 2003;39:")
55
Key Milestones in Antiemetic Treatment
1960 1970 1980 1990 2000 2002 2004 Phenothiazines: first agents to demonstrate antiemetic effect High-dose metoclopramide shown to enhance antiemetic effect Combination therapy: addition of a corticosteroid shown to improve antiemetic response First clinical studies of 5-HT3 antagonists Introduction of 5-HT3 antagonists into clinical practice for CINV New class of drug: NK-1 antagonists in clinical development for CINV Aprepitant: March 2003 Palonosetron: July 2003 Viale PH. Integrating Aprepitant and Palonosetron Into Clinical Practice: A Role for the New Antiemetics. Clin J Onc Nurs. 2005;9(1):77-84. Hesketh PJ. Potential role of the NK1 receptor antagonists in chemotherapy-induced nausea and vomiting. Support Care Cancer. 2001;9:350-4. Grunberg SM, Hesketh PJ. Control of Chemotherapy-Induced Emesis. New Engl J Med. 1993;329(24): Hesketh PJ. New Treatment Options for Chemotherapy-Induced Nausea and Vomiting. Support Care Cancer. 2004;12:550-4. Viale PH. Clin J Onc Nurs. 2005;9(1):77-84 Hesketh PJ. Support Care Cancer. 2001;9:350-4 Grunberg SM, Hesketh PJ. New Engl J Med. 1993;329(24):1790-6 Hesketh PJ. Support Care Cancer. 2004;12:550-4 55
: Hesketh PJ. Potential role of the NK1 receptor antagonists in chemotherapy-induced nausea and vomiting. Support Care Cancer. 2001;9: Grunberg SM, Hesketh PJ. Control of Chemotherapy-Induced Emesis. New Engl J Med. 1993;329(24): Hesketh PJ. New Treatment Options for Chemotherapy-Induced Nausea and Vomiting. Support Care Cancer. 2004;12: Viale PH. Clin J Onc Nurs. 2005;9(1): Hesketh PJ. Support Care Cancer. 2001;9: Grunberg SM, Hesketh PJ. New Engl J Med. 1993;329(24): Hesketh PJ. Support Care Cancer. 2004;12:")
56
Controlling Cisplatin-induced Emesis: Progress Over the Past 30 Years
Complete Response: (24 hour control) (120 hour control) 100% - 75% - 50% - 25% - 70% 60% 50% 0% 1978 1988 1998 2008 No Useful Rx HD-MCP/Dex HT3/Dex HT3/Dex/NK1
 (120 hour control) 100% - 75% - 50% - 25% - 70% 60% 50% 0% No Useful Rx HD-MCP/Dex 5-HT3/Dex 5-HT3/Dex/NK1.")
57
Patterns of Emesis Cisplatin vs Cyclophosphamide and Carboplatin
Cyclophosphamide/Carboplatin 1 2 3 4 5 Days Intensity of Emesis 1. Martin M. The severity and pattern of emesis following different cytotoxic agents. Oncology. 1996;53(suppl 1):26-31. Martin M. Oncology. 1996;53(suppl 1): 26-31 57
: Martin M. Oncology. 1996;53(suppl 1):")
58
1st Generation 5HT3 RAs are Therapeutically Equivalent
Highest Level Evidence MASCC 2009 NCCN 2010 ASCO 2006 1st Generation Agents are therapeutically equivalent Dolasetron Ondansetron Granisetron 1st Generation oral, IV & patch forms equally effective Pts receiving MEC* (N=1,085) Oral granisetron 2 mg IV ondansetron 32 mg 71.0 72.0 59.0 58.0 60.0 58.0 Complete Control (%) Total Nausea Emesis 80% of pts received prophylactic steroids *Cyclophosphamide mg/m2, carboplatin ≥300 mg/m2 Perez et al. J Clin Oncol 1998;16:754
 Oral granisetron 2 mg. IV ondansetron 32 mg Complete Control (%) Total. Nausea. Emesis. 80% of pts received prophylactic steroids. *Cyclophosphamide mg/m2, carboplatin ≥300 mg/m2. Perez et al. J Clin Oncol 1998;16:754.")
59
Palonosetron Second generation 5-HT3 antagonist
Pharmacologic differences from older 5-HT3 antagonists Prolonged half-life (~40 hours) Enhanced receptor binding affinity (30-fold) FDA approved IV formulation July 25, 2003 Oral formulation August 22, 2008 Regimens IV mg pre chemotherapy acute/delayed HEC/MEC PO 0.50 mg pre chemotherapy acute MEC
 Enhanced receptor binding affinity (30-fold) FDA approved. IV formulation July 25, Oral formulation August 22, Regimens. IV 0.25 mg pre chemotherapy. acute/delayed HEC/MEC. PO 0.50 mg pre chemotherapy. acute MEC.")
60
Complete Response (CR)
Palonosetron vs. 1st gen HT-3RA: Complete Response on Day of Chemo & Beyond Palonosetron 0.25 mg (n=378) Ondansetron/Dolasetron 32/100 mg (n=376) 100 * 80 72.0 * 64.0 * 60.6 57.7 60 Complete Response (CR) (% of Patients) 46.8 42.0 40 20 Pooled results from studies and (see individual study results) show that during the acute, delayed, and overall time intervals significantly more patients treated with palonosetron 0.25 mg had a CR compared with those treated with either ondansetron or dolasetron (p<0.025). Trials included palonosetron 0.25 mg and 0.75 mg dose (N=378) groups; shown are data for only the approved 0.25 mg dose. Rubenstein EB et al. Palonosetron (PALO) compared with ondansetron (OND) or dolasetron (DOL) for prevention of acute & delayed chemotherapy-induced nausea and vomiting (CINV): combined results of two phase III trials. Proc Am Soc Clin Oncol. 2003;22:729. Abstract 2932. 2. Gralla R et al. Palonosetron improves prevention of chemotherapy-induced nausea and vomiting following moderately emetogenic chemotherapy: results of a double-blind randomized phase III trial comparing single doses of palonosetron with ondansetron. Ann Oncol. 2003;14: 3. Eisenberg P et al. Improved prevention of moderate CINV with palonosetron, a pharmacologically novel 5-HT3 receptor antagonist: results of a phase III, single-dose trial vs dolasetron. Cancer. 2003;98: Acute: 0-24 (Day 1) Delayed: (Days 2-5) Overall: 0-120 (Days 1-5) Time (hr) CR = no emetic episodes or use of rescue medications *p<0.025 for pairwise difference (2-sided Fisher’s exact test) between palonosetron and ondansetron/dolasetron. Gralla R et al. Ann Oncol. 2003; Eisenberg P et al. Cancer. 2003 Rubenstein EB et al. Proc Am Soc Clin Oncol Abstract 2932
 Ondansetron/Dolasetron 32/100 mg (n=376) 100. * * * Complete Response (CR) (% of Patients) Pooled results from studies and (see individual study results) show that during the acute, delayed, and overall time intervals significantly more patients treated with palonosetron 0.25 mg had a CR compared with those treated with either ondansetron or dolasetron (p<0.025). Trials included palonosetron 0.25 mg and 0.75 mg dose (N=378) groups; shown are data for only the approved 0.25 mg dose. Rubenstein EB et al. Palonosetron (PALO) compared with ondansetron (OND) or dolasetron (DOL) for prevention of acute & delayed chemotherapy-induced nausea and vomiting (CINV): combined results of two phase III trials. Proc Am Soc Clin Oncol. 2003;22:729. Abstract Gralla R et al. Palonosetron improves prevention of chemotherapy-induced nausea and vomiting following moderately emetogenic chemotherapy: results of a double-blind randomized phase. III trial comparing single doses of palonosetron with ondansetron. Ann Oncol. 2003;14: Eisenberg P et al. Improved prevention of moderate CINV with palonosetron, a pharmacologically novel 5-HT3 receptor antagonist: results of a phase III, single-dose trial vs dolasetron. Cancer. 2003;98: Acute: (Day 1) Delayed: (Days 2-5) Overall: (Days 1-5) Time (hr) CR = no emetic episodes or use of rescue medications. *p<0.025 for pairwise difference (2-sided Fisher’s exact test) between palonosetron and ondansetron/dolasetron. Gralla R et al. Ann Oncol. 2003; Eisenberg P et al. Cancer Rubenstein EB et al. Proc Am Soc Clin Oncol Abstract")
61
Palonosetron vs Ondansetron
High Emetic Risk Chemotherapy Patients Also Receiving Dexamethasone N=447 (67%) * * Among the subset of patients receiving dexamethasone, the unadjusted response rates, not controlling for other risk factors, were higher for each dose regimen of palonosetron compared with ondansetron for both acute and delayed phases, and for the overall evaluation period from 0 to 120 hours after administration of highly emetic chemotherapy. Reference Aapro M, Bertoli L, Lordick P, et al. Palonosetron (PALO) is effective in preventing chemotherapy-induced nausea and vomiting (CINV) in patients receiving highly emetogenic chemotherapy (HEC): results of a phase III trial [abstract A-17]. Support Care Cancer. 2003:11:391. Aapro M Support Care Cancer 2003:11:391
 * * Among the subset of patients receiving dexamethasone, the unadjusted response rates, not controlling for other risk factors, were higher for each dose regimen of palonosetron compared with ondansetron for both acute and delayed phases, and for the overall evaluation period from 0 to 120 hours after administration of highly emetic chemotherapy. Reference. Aapro M, Bertoli L, Lordick P, et al. Palonosetron (PALO) is effective in preventing chemotherapy-induced nausea and vomiting (CINV) in patients receiving highly emetogenic chemotherapy (HEC): results of a phase III trial [abstract A-17]. Support Care Cancer. 2003:11:391. Aapro M Support Care Cancer 2003:11:391.")
62
Cisplatin (57%) or anthracycline/cyclophosphamide (43%)
Phase III Trial of IV Palonosetron vs. IV Granisetron with Cisplatin or AC-Based Chemotherapy 1114 patients Cisplatin (57%) or anthracycline/cyclophosphamide (43%) Single 0.75 mg dose of palo vs. single 40 μg/kg dose of granisetron Dexamethasone 16 mg d1; 4mg/d d 2-3 (AC/EC); 8mg/d d 2-3 CDDP Objective: demonstrate non-inferiority d1 and superiority d 2-5 of palonosetron Primary endpoint complete response (no emesis/no rescue) Saito M et al. Lancet Oncol. 2009;10(2):115-24
 or anthracycline/cyclophosphamide (43%) Single 0.75 mg dose of palo vs. single 40 μg/kg dose of granisetron. Dexamethasone 16 mg d1; 4mg/d d 2-3 (AC/EC); 8mg/d d 2-3 CDDP. Objective: demonstrate non-inferiority d1 and superiority d 2-5 of palonosetron. Primary endpoint complete response (no emesis/no rescue) Saito M et al. Lancet Oncol. 2009;10(2):")
63
Phase III Trial Palonosetron vs
Phase III Trial Palonosetron vs. Granisetron both with Dexamethasone in HEC Outcome Palo+ Dex (n=555) % Grani+ Dex (n=558) P Complete Response, Acute (0-24h) 73.7 72.1 ND CR, Delayed (24-120h) 53.0 42.4 0.0003 CR, Overall (0-120h) 47.9 38.1 0.0007 No Nausea: hours 32 25 0.01 No Emesis: hours 58 49 0.006 Saito M et al. Lancet Oncol. 2009;10(2):115-24
 % Grani+ Dex. (n=558) P. Complete Response, Acute (0-24h) ND. CR, Delayed (24-120h) CR, Overall (0-120h) No Nausea: hours No Emesis: hours Saito M et al. Lancet Oncol. 2009;10(2):")
64
Palonosetron + Dexamethasone vs Granisetron + Dexamethasone in Japanese Patients
Complete Response – AC/EC Subset 90 80 Palonosetron 0.75 mg IV (n=239) Granisetron 40 mcg/kg IV (n=236) 70 69.0 64.8 * 61.1 60 * 52.7 50.0 50 Complete Response (% of patients) 42.8 40 30 20 Saito M, Aogi K, Sekine I et al. Palonosetron plus dexamethasone versus granisetron plus dexamethasone for prevention of nausea and vomiting during chemotherapy: a double-blind, double-dummy, randomised, comparative phase III trial. Lancet Oncol. 2009;10(2): Data on file, Taiho/Helsinn 2008 10 Acute (0-24 hrs) Delayed ( hrs) Overall (0-120 hrs) * p = † p = 0.030 Please note that the EU approved dose is 0.25 mg * Fisher’s exact test indicates a difference between PALO and GRAN † Chi-square test indicates a difference between PALO and GRAN Data on file, Taiho/Helsinn 2008 Saito M, et al. Lancet Oncol 2009;10: 64
 Granisetron 40 mcg/kg IV (n=236) * * Complete Response. (% of patients) Saito M, Aogi K, Sekine I et al. Palonosetron plus dexamethasone versus granisetron plus dexamethasone for prevention of nausea and vomiting during chemotherapy: a double-blind, double-dummy, randomised, comparative phase III trial. Lancet Oncol. 2009;10(2): Data on file, Taiho/Helsinn Acute (0-24 hrs) Delayed ( hrs) Overall (0-120 hrs) * p = † p = Please note that the EU approved dose is 0.25 mg. * Fisher’s exact test indicates a difference between PALO and GRAN. † Chi-square test indicates a difference between PALO and GRAN. Data on file, Taiho/Helsinn Saito M, et al. Lancet Oncol 2009;10:")
65
5-HT3 Treatment-Related Adverse Reactions
Palonosetron 0.25 mg IV (n=187) Palonosetron 0.75 mg IV (n=188) Ondansetron 32 mg IV (n=187) n % Headache 9 4.8 10 5.3 Constipation 3 1.6 6 3.2 Dizziness 1 0.5 0.0 1. Gralla R et al. Palonosetron improves prevention of chemotherapy-induced nausea and vomiting following moderately emetogenic chemotherapy: results of a double-blind randomized phase III trial comparing single doses of palonosetron with ondansetron. Ann Oncol. 2003;14: Adverse reaction = adverse event judged by the investigator to have a definite, probable, possible or unknown relationship to study medication n = number of patients with the adverse reaction *Reported in 2% of patients in any treatment group Gralla R, et al. Ann Oncol. 2003;14: 65
 Palonosetron 0.75 mg IV (n=188) Ondansetron 32 mg IV (n=187) n. % Headache Constipation Dizziness Gralla R et al. Palonosetron improves prevention of chemotherapy-induced nausea and vomiting following moderately emetogenic chemotherapy: results of a double-blind randomized phase III trial comparing single doses of palonosetron with ondansetron. Ann Oncol. 2003;14: Adverse reaction = adverse event judged by the investigator to have a definite, probable, possible or unknown relationship to study medication. n = number of patients with the adverse reaction. *Reported in 2% of patients in any treatment group. Gralla R, et al. Ann Oncol. 2003;14:")
66
Palonosetron: 5-HT3 Antagonist of Choice?
Palonosetron is a 5-HT3 antagonist with strong receptor binding affinity and an extended half-life Comparable tolerability Ease of use and trends towards superiority in delayed CINV favor palonosetron as the preferred 5-HT3 antagonist Definitive proof of superiority to first generation 5-HT3 antagonists would require trials with control arms utilizing corticosteroids, NK1 antagonists and repetitive dosing of the first generation agents Slide 39 Compared with other 5-HT3 receptor antagonists, palonosetron demonstrates a strong receptor binding affinity and an extended half-life. Compared with dolasetron, palonosetron achieved a better CR rate in preventing acute emesis induced by moderately emetogenic chemotherapy. Efficacy of palonosetron persists throughout the period of major risk for delayed emesis, without repeated dosing.

67
Aprepitant Selective antagonist of the binding of Substance P to the neurokinin 1 (NK1) receptor FDA approved Oral formulation: March 26, 2003 IV formulation (fosaprepitant): January 31, 2008 Regimen 125 mg PO day 1, 80 mg PO days 2-3 acute/delayed HEC/MEC 115 mg IV day 1, 80 mg PO days 2-3 acute/delayed HEC/MEC
: January 31, Regimen. 125 mg PO day 1, 80 mg PO days 2-3 acute/delayed HEC/MEC. 115 mg IV day 1, 80 mg PO days 2-3 acute/delayed HEC/MEC.")
68
Aprepitant in Anthracycline/ Cyclophosphamide Chemotherapy
Complete Response (N=857) Aprepitant (n=433) 100 Standard (n=424) * 76 80 69 * 55 60 51 Complete Response (CR) (% of Patients) 49 42 40 20 Aprepitant in MEC – Response Rates In this study of patients receiving moderately emetogenic chemotherapy (99% A+C), the primary analysis was CR overall (0-120 hours), which was achieved by 51% of patients in the aprepitant group and 42% of patients in the standard group (p=0.015). In the acute interval, CR rates were 76% for the aprepitant group vs 69% for the standard group (p=0.034). Delayed CR rates were not statistically significantly different between groups, with 55% for aprepitant vs 49% for the standard group (NS, p=0.064). No vomiting and no nausea rates were also assessed. 1. Warr D, Eisenberg PJ, Hesketh PJ, et al. Effect of aprepitant for the prevention of nausea and vomiting after one cycle of moderately emetogenic chemotherapy: A randomized, double-blind, trial in 866 patients. Proc Am Soc Clin Oncol. 2004;23(July 15 suppl):19. Abstract 8007 and oral presentation. 2. Warr DG, Eisenberg PD, Hesketh PJ, Raftopolous H, Gralla RJ, Muss HB. Phase III, double-blind study to assess an aprepitant-containing regimen for the prevention of nausea and vomiting due to moderately emetogenic chemotherapy. Support Care Cancer 2004;12:374. Abstract A027 and poster. Acute: 0-24 (Day 1) Delayed: (Days 2-5) Overall: 0-120 (Days 1-5) Time (hr) *p<0.05 Complete response (CR): no emesis and no rescue medication. Warr DG et al. J Clin Oncol 2005; 23:
 Aprepitant (n=433) 100. Standard (n=424) * * Complete Response (CR) (% of Patients) Aprepitant in MEC – Response Rates. In this study of patients receiving moderately emetogenic chemotherapy (99% A+C), the primary analysis was CR overall (0-120 hours), which was achieved by 51% of patients in the aprepitant group and 42% of patients in the standard group (p=0.015). In the acute interval, CR rates were 76% for the aprepitant group vs 69% for the standard group (p=0.034). Delayed CR rates were not statistically significantly different between groups, with 55% for aprepitant vs 49% for the standard group (NS, p=0.064). No vomiting and no nausea rates were also assessed. 1. Warr D, Eisenberg PJ, Hesketh PJ, et al. Effect of aprepitant for the prevention of nausea and vomiting after one cycle of moderately emetogenic chemotherapy: A randomized, double-blind, trial in 866 patients. Proc Am Soc Clin Oncol. 2004;23(July 15 suppl):19. Abstract 8007 and oral presentation. 2. Warr DG, Eisenberg PD, Hesketh PJ, Raftopolous H, Gralla RJ, Muss HB. Phase III, double-blind study to assess an aprepitant-containing regimen for the prevention of nausea and vomiting due to moderately emetogenic chemotherapy. Support Care Cancer 2004;12:374. Abstract A027 and poster. Acute: (Day 1) Delayed: (Days 2-5) Overall: (Days 1-5) Time (hr) *p<0.05. Complete response (CR): no emesis and no rescue medication. Warr DG et al. J Clin Oncol 2005; 23:")
69
Aprepitant in Moderately Emetogenic Chemotherapy
Percent of Patients with No Emesis * 88 81 76 77 69 59 20 40 60 80 100 Acute: 0-24 (Day 1) Delayed: (Days 2-5) Overall: 0-120 (Days 1-5) Emesis-Free (% of Patients) Aprepitant (n=433) Standard (n=424) No Emesis Rates with Aprepitant in MEC No vomiting was achieved in 63% of the aprepitant treatment group compared with 43% of the standard group (p<0.001) during the overall period. In the acute phase, no vomiting rates were 88% for aprepitant and 77% for standard therapy (p<0.001). In the delayed phase, no vomiting rates were 81% for aprepitant and 69% for standard therapy (p<0.001). 1. Warr D et al. Effect of aprepitant for the prevention of nausea and vomiting after one cycle of moderately emetogenic chemotherapy: A randomized, double-blind, trial in 866 patients. Proc Am Soc Clin Oncol. 2004;23(July 15 suppl):19. Abstract 8007 and oral presentation. 2. Warr DG et al. Phase III, double-blind study to assess an aprepitant-containing regimen for the prevention of nausea and vomiting due to moderately emetogenic chemotherapy. Support Care Cancer 2004;12:374. Abstract A027 and poster. Time (hr) *p<0.001 Warr DG et al. J Clin Oncol 2005; 23:
 Delayed: (Days 2-5) Overall: (Days 1-5) Emesis-Free. (% of Patients) Aprepitant (n=433) Standard (n=424) No Emesis Rates with Aprepitant in MEC. No vomiting was achieved in 63% of the aprepitant treatment group compared with 43% of the standard group (p<0.001) during the overall period. In the acute phase, no vomiting rates were 88% for aprepitant and 77% for standard therapy (p<0.001). In the delayed phase, no vomiting rates were 81% for aprepitant and 69% for standard therapy (p<0.001). 1. Warr D et al. Effect of aprepitant for the prevention of nausea and vomiting after one cycle of moderately emetogenic chemotherapy: A randomized, double-blind, trial in 866 patients. Proc Am Soc Clin Oncol. 2004;23(July 15 suppl):19. Abstract 8007 and oral presentation. 2. Warr DG et al. Phase III, double-blind study to assess an aprepitant-containing regimen for the prevention of nausea and vomiting due to moderately emetogenic chemotherapy. Support Care Cancer 2004;12:374. Abstract A027 and poster. Time (hr) *p< Warr DG et al. J Clin Oncol 2005; 23:")
70
Aprepitant in Moderately Emetogenic Chemotherapy
Percent of Patients with No Nausea Aprepitant (n=430) 100 Standard (n=424) 80 61 59 60 Nausea-Free (% of Patients) 37 36 40 33 33 20 No Nausea Rates with Aprepitant in MEC Nausea was not statistically significantly different between the two groups. In the overall period, 33% of patients in both groups experienced no nausea (peak VAS on 0-100mm scale <5 mm). In the acute phase, no nausea rates were 61% for aprepitant and 59% for standard therapy. In the delayed phase, no nausea rates were 37% for aprepitant and 36% for standard therapy. 1. Warr D et al. Effect of aprepitant for the prevention of nausea and vomiting after one cycle of moderately emetogenic chemotherapy: A randomized, double-blind, trial in 866 patients. Proc Am Soc Clin Oncol. 2004;23(July 15 suppl):19. Abstract 8007 and oral presentation. 2. Warr DG et al. Phase III, double-blind study to assess an aprepitant-containing regimen for the prevention of nausea and vomiting due to moderately emetogenic chemotherapy. Support Care Cancer 2004;12:374. Abstract A027 and poster. . Acute: 0-24 (Day 1) Delayed: (Days 2-5) Overall: 0-120 (Days 1-5) Time (hr) No nausea: score <5 mm on mm VAS. Warr DG et al. J Clin Oncol 2005; 23: ; Warr DG et al. Support Care Cancer Abstract A027
 100. Standard (n=424) Nausea-Free. (% of Patients) No Nausea Rates with Aprepitant in MEC. Nausea was not statistically significantly different between the two groups. In the overall period, 33% of patients in both groups experienced no nausea (peak VAS on 0-100mm scale <5 mm). In the acute phase, no nausea rates were 61% for aprepitant and 59% for standard therapy. In the delayed phase, no nausea rates were 37% for aprepitant and 36% for standard therapy. 1. Warr D et al. Effect of aprepitant for the prevention of nausea and vomiting after one cycle of moderately emetogenic chemotherapy: A randomized, double-blind, trial in 866 patients. Proc Am Soc Clin Oncol. 2004;23(July 15 suppl):19. Abstract 8007 and oral presentation. 2. Warr DG et al. Phase III, double-blind study to assess an aprepitant-containing regimen for the prevention of nausea and vomiting due to moderately emetogenic chemotherapy. Support Care Cancer 2004;12:374. Abstract A027 and poster. . Acute: (Day 1) Delayed: (Days 2-5) Overall: (Days 1-5) Time (hr) No nausea: score <5 mm on mm VAS. Warr DG et al. J Clin Oncol 2005; 23: ; Warr DG et al. Support Care Cancer Abstract A027.")
71
Phase III Aprepitant Study (801): Multiple-day Ondansetron
Initial cycle cisplatin > 70 mg/m2 445 patients Group Day 1 Days 2-3 Day 4 O D A O D A O D 32 12 125 P 8 80 P 8 Aprepitant 32 20 P 16 16 P 16 16 Control O=ondansetron; D=dexamethasone; A=aprepitant; P=placebo Schmoll et al: Ann Oncol 17:1000-6, 2006

72
Phase III Aprepitant Study (801): Multiple-day Ondansetron
Identical design to Protocols 052 and 054 except ondansetron dosed days 1-4 Primary endpoint: complete response on days after cisplatin Aprepitant regimen superior to control regimen of protracted ondansetron and dexamethasone dosing, CR 72% vs. 61% respectively Schmoll et al: Ann Oncol 17:1000-6, 2006

73
Perception vs Reality: Emetogenic Chemotherapy
Highly Emetogenic Chemotherapy Moderately Emetogenic Chemotherapy In an international prospective observational study of 298 patients from 14 oncology practices performed in , 97% of patients received a 5-HT3 receptor antagonist, with 78% receiving a corticosteroid prior to receipt of moderately or highly emetogenic chemotherapy (78% received moderately emetogenic regimens). Physicians and nurses overestimated the efficacy of antiemetic treatment for the majority of patients. The greatest discrepancy between predicted and actual nausea and emesis occurred for the delayed period, with physicians and nurses underestimating the incidence of nausea/vomiting by nearly 30%. Of interest, even with treatment with antiemetics, 35% of patients experienced acute nausea and over 50% experienced delayed nausea.1 1. Grunberg SM, Hansen M, Deuson RR, Mavros P et al. Incidence of chemotherapy-induced nausea and emesis after modern antiemetics. Cancer. 2004;100: Grunberg S. Cancer. 2004;100:
. Physicians and nurses overestimated the efficacy of antiemetic treatment for the majority of patients. The greatest discrepancy between predicted and actual nausea and emesis occurred for the delayed period, with physicians and nurses underestimating the incidence of nausea/vomiting by nearly 30%. Of interest, even with treatment with antiemetics, 35% of patients experienced acute nausea and over 50% experienced delayed nausea Grunberg SM, Hansen M, Deuson RR, Mavros P et al. Incidence of chemotherapy-induced nausea and emesis after modern antiemetics. Cancer. 2004;100: Grunberg S. Cancer. 2004;100:")
74
Optimizing Supportive Care in Cancer
The best treatment of delayed CINV is to prevent it! In an international prospective observational study of 298 patients from 14 oncology practices performed in , 97% of patients received a 5-HT3 receptor antagonist, with 78% receiving a corticosteroid prior to receipt of moderately or highly emetogenic chemotherapy (78% received moderately emetogenic regimens). Physicians and nurses overestimated the efficacy of antiemetic treatment for the majority of patients. The greatest discrepancy between predicted and actual nausea and emesis occurred for the delayed period, with physicians and nurses underestimating the incidence of nausea/vomiting by nearly 30%. Of interest, even with treatment with antiemetics, 35% of patients experienced acute nausea and over 50% experienced delayed nausea.1 1. Grunberg SM, Hansen M, Deuson RR, Mavros P et al. Incidence of chemotherapy-induced nausea and emesis after modern antiemetics. Cancer. 2004;100:
. Physicians and nurses overestimated the efficacy of antiemetic treatment for the majority of patients. The greatest discrepancy between predicted and actual nausea and emesis occurred for the delayed period, with physicians and nurses underestimating the incidence of nausea/vomiting by nearly 30%. Of interest, even with treatment with antiemetics, 35% of patients experienced acute nausea and over 50% experienced delayed nausea Grunberg SM, Hansen M, Deuson RR, Mavros P et al. Incidence of chemotherapy-induced nausea and emesis after modern antiemetics. Cancer. 2004;100:")
75
Are Oral Followup 5-HT3 RAs Really Effective for Delayed CINV?
671 pts receiving doxorubicin-based chemotherapy All treated w/ 1st generation 5HT3 + Dex on Day 1 of CT Pts then randomized for days 2 and 3: Arm 1: Prochlorperazine 10 mg p.o. three times daily (q 8 h) Arm 2: Any oral 5-HT3 antiemetic, using standard dosing regimens Arm 3: Prochlorperazine 10 mg p.o. as needed for nausea Rescue medications for control of symptoms were allowed Hickock et al ASCO 2005 Final Results URCC-CCOP
 Arm 2: Any oral 5-HT3 antiemetic, using standard dosing regimens. Arm 3: Prochlorperazine 10 mg p.o. as needed for nausea. Rescue medications for control of symptoms were allowed. Hickock et al ASCO 2005 Final Results URCC-CCOP.")
76
Oral 5HT3 RAs: Majority of Patients Experience Nausea
10 20 30 40 50 60 70 80 90 100 Prochlorperazine q 8h* 5HT3* Prochlorperazine PRN* % Patients with Delayed Nausea 75 83 87 * p = (overall comparison); p = 0.06 (Prochlorperazine q 8 h vs 5-HT3 ); p = NS (Prochlorperazine prn vs 5-HT3 ) Patients randomized for days 2 and 3; rescue medications allowed Hickock et al ASCO 2005 Final Results URCC-CCOP
; p = 0.06 (Prochlorperazine q 8 h vs 5-HT3 ); p = NS (Prochlorperazine prn vs 5-HT3 ) Patients randomized for days 2 and 3; rescue medications allowed. Hickock et al ASCO 2005 Final Results URCC-CCOP.")
77
Oral 5HT3 RAs Not Effective for Delayed CINV
Vomiting Significantly more patients vomited at least once during the delayed period (34%) than on the day of treatment (19%) p <0.01 Nausea Nausea severity was significantly greater during the delayed period than on the day of treatment p < 0.01 More patients getting oral 5HT3 RAs required rescue medications (45%) than patients getting Compazine® (27-30%) p=0.002 Hickock et al ASCO 2005 Final Results URCC-CCOP
 than on the day of treatment (19%) p <0.01. Nausea. Nausea severity was significantly greater during the delayed period than on the day of treatment p < More patients getting oral 5HT3 RAs required rescue medications (45%) than patients getting Compazine® (27-30%) p= Hickock et al ASCO 2005 Final Results URCC-CCOP.")
78
Geling and Eichler, JCO 2005; 23:1289-1294
Meta-Analysis of Efficacy of 5-HT3RA in Prevention of Delayed Emesis from Chemotherapy Reviewed 5 studies, 1,716 pts comparing 5-HT3 RA to placebo, 5 studies, 2,240 pts comparing 5-HT3 RA + dexamethasone to dexamethasone alone 5-HT3 RA as monotherapy Absolute RR (95% CI) % ( ) NNT Number of doses per protected pt: 74.4 5-HT3 RA as adjunct to dexamethasone Absolute RR (95% CI) 2.6% ( ) NNT Number of doses per protected pt: 423 Geling and Eichler, JCO 2005; 23:
 8.2% ( ) NNT 12.2 Number of doses per protected pt: HT3 RA as adjunct to dexamethasone. Absolute RR (95% CI) 2.6% ( ) NNT 38.8 Number of doses per protected pt: 423. Geling and Eichler, JCO 2005; 23:")
79
Breakthrough Medications for CINV
Consider other classes, alone or in combination Antipsychotics Cannabinoids Benzodiazepines Phenothiazines Dopamine Receptor Antagonists

80
NCCN Antiemesis Guidelines v.2.2010: HEC Recommendations
Emetic risk group Risk (% of patients) Acute prevention Delayed prevention High and AC combinations >90% 5-HT3 RA + DEX + aprepitant lorazepam H2 blocker or proton pump inhibitor DEX + aprepitant lorazepam H2 blocker or proton pump inhibitor Saito M, Aogi K, Sekine I et al. Palonosetron plus dexamethasone versus granisetron plus dexamethasone for prevention of nausea and vomiting during chemotherapy: a double-blind, double-dummy, randomised, comparative phase III trial. Lancet Oncol. 2009;10(2): DEX, dexamethasone; AC, anthracycline-cyclophosphamide For more information see: 80
 Acute prevention. Delayed prevention. High and AC combinations. >90% 5-HT3 RA. + DEX + aprepitant. lorazepam H2 blocker or proton pump inhibitor. DEX + aprepitant. lorazepam H2 blocker or proton pump inhibitor. Saito M, Aogi K, Sekine I et al. Palonosetron plus dexamethasone versus granisetron plus dexamethasone for prevention of nausea and vomiting during chemotherapy: a double-blind, double-dummy, randomised, comparative phase III trial. Lancet Oncol. 2009;10(2): DEX, dexamethasone; AC, anthracycline-cyclophosphamide. For more information see:")
81
NCCN Antiemesis Guidelines v.2.2010: MEC Recommendations
Emetic risk group Risk (% of patients) Acute prevention Delayed prevention Moderate 30-90% 5-HT3 RA + DEX lorazepam H2 blocker or proton pump inhibitor 5-HT3 RA or DEX lorazepam H2 blocker or proton pump inhibitor Low 10-30% DEX, prochlorperazine, or metoclopramide No preventive measures Minimal <10% No routine prophylaxis DEX, dexamethasone For more information see: 81
 Acute prevention. Delayed prevention. Moderate % 5-HT3 RA + DEX. lorazepam H2 blocker or proton pump inhibitor. 5-HT3 RA or DEX. lorazepam H2 blocker or proton pump inhibitor. Low % DEX, prochlorperazine, or metoclopramide. No preventive measures. Minimal. <10% No routine prophylaxis. DEX, dexamethasone. For more information see:")
82
MASCC / ESMO Committees II-V Combined Statement #3 – Moderate*
Prevention of nausea and vomiting following chemotherapy of moderate emetic risk: To prevent acute and delayed vomiting and nausea following chemotherapy of moderate emetic risk, we recommend a regimen of palonosetron and multiday dexamethasone beginning before chemotherapy 1. (MASCC: Multinational Association of Supportive Care in Cancer) TO BE UPDATED WITH REFERENCE FOR UPDATED GUIDELINES WHEN AVAILABLE * Does not include “AC” given its higher risk of nausea and vomiting, in which an NK1 RA is added to Dex + 5HT3 RA June 2009 Multinational Association for Supportive Care in Cancer.
 TO BE UPDATED WITH REFERENCE FOR UPDATED GUIDELINES WHEN AVAILABLE. * Does not include AC given its higher risk of nausea and vomiting, in which an NK1 RA is added to Dex + 5HT3 RA. June Multinational Association for Supportive Care in Cancer.")
83
Summary 1st generation 5HT3 RA’s therapeutically equivalent & major advance in supportive care for control of acute emesis Newer agents include 2nd generation 5-HT3 RA palonosetron and NK-1 antagonist aprepitant Treatment guidelines have changed Degree of nausea incurred has been refined for many agents Delayed CINV recommendations are updated Prevention of CINV has improved, but challenges remain Improving detection of CINV, especially after 24 hours Educating patients and oncology healthcare givers The development and evaluation of clinically useful assessment tools Further development of regimens to treat delayed CINV

84
Investigations • Innovation • Clinical Application
Risk Stratification Tools to Identify Patients for Primary and Secondary Prevention of VTE in the Setting of Malignancy Screening and VTE Risk Assessment Across the Complex Spectrum of Malignant Disorders—What Works? What Doesn’t? Alok A. Khorana, MD, FACP Vice-Chief, Division of Hematology/Oncology Associate Professor of Medicine and Oncology James P. Wilmot Cancer Center University of Rochester Rochester, New York

85
Optimizing Supportive Care in Cancer
Risk Assessment for VTE In Cancer Patients Risk Factors for VTE Biomarkers Risk Assessment Models Implications for Study Design of Prophylaxis Trials Secondary Prophylaxis

86
Risk Factors for VTE Patient-related factors Treatment-related factors
Older age Race, gender Comorbidities Treatment-related factors Hospitalization Chemotherapy Anti-angiogenics Major surgery Erythropoiesis-stimulating agents Transfusions Cancer-related factors Site of cancer Advanced stage Initial period after diagnosis Rao et al., in Cancer-Associated Thrombosis. (Khorana and Francis, Eds) 2007
")
87
VTE and Site of Cancer Adjusted OR Type of cancer (95% CI) Hematologic
28 ( ) Lung 22.2 ( ) GI 20.3 (4.9-83) Breast 4.9 ( ) Prostate 2.2 ( ) Blom JW et al. JAMA 2005
 Lung ( ) GI (4.9-83) Breast. 4.9 ( ) Prostate. 2.2 ( ) Blom JW et al. JAMA")
88
VTE in the REAL-2 Study: Oxaliplatin vs Cisplatin
HR for cisplatin 0.51; 95% CI, 0.34 to 0.76; P = .001 Starling et al JCO 2009

89
VTE With Bevacizumab 13% 9.9% 6.2% 4.2% All-Grade VTE (6 studies)
RR=1.29 (95% CI, ) 13% 9.9% Rate of VTE (%) RR=1.38 (95% CI, ) 6.2% 4.2% Bevacizumab (n=1,196) Control (n=1,083) Bevacizumab (n=3,795) Control (n=3,167) All-Grade VTE (6 studies) High-Grade VTE (13 studies) Nalluri SR, et al. JAMA. 2008;300:
 13% 9.9% Rate of VTE (%) RR=1.38 (95% CI, ) 6.2% 4.2% Bevacizumab (n=1,196) Control (n=1,083) Bevacizumab (n=3,795) Control (n=3,167) All-Grade VTE (6 studies) High-Grade VTE (13 studies) Nalluri SR, et al. JAMA. 2008;300:")
90
VTE in Myeloma 0.2 MPT 0.1 Cumulative Percentage MPT and Enoxaparin
MPT Cumulative Percentage MPT and Enoxaparin RMP and Aspirin MP Months Palumbo et al. JTH 2006:

91
Candidate Biomarkers Blood counts Tissue factor Soluble P-selectin
Platelet count Leukocyte count Hemoglobin Tissue factor Soluble P-selectin D-dimer C-reactive protein Factor VIII

92
Incidence of VTE By Quartiles Of Pre-Chemotherapy Platelet Count
0% 1% 2% 3% 4% 5% 6% <250 >350 Pre-chemotherapy Platelet Counts (x1000) Incidence Of VTE Over 2.5 Months(%) P =0.005 This figure depicts the incidence of venous thromboembolism by quartiles of pre-chemotherapy platelet count. As can be seen, elevated platelet counts were associated with an increased risk of venous thromboembolism. Patients in the highest quartile of pre-chemotherapy platelet count with a count of > 337,000/ cu mm, had a 3.6% risk of VTE, and this was significantly greater than the 1.1 % risk observed with patients in the lowest quartile, with a pre-chemotherapy platelet count of < 217,000/ cu mm. The p value for trend was highly significant at 0.005, and the difference between the highest and lowest quartile was also significant at Khorana AA et al. Cancer 2005
 Incidence Of VTE Over 2.5 Months(%) P = This figure depicts the incidence of venous thromboembolism by quartiles of pre-chemotherapy platelet count. As can be seen, elevated platelet counts were associated with an increased risk of venous thromboembolism. Patients in the highest quartile of pre-chemotherapy platelet count with a count of > 337,000/ cu mm, had a 3.6% risk of VTE, and this was significantly greater than the 1.1 % risk observed with patients in the lowest quartile, with a pre-chemotherapy platelet count of < 217,000/ cu mm. The p value for trend was highly significant at 0.005, and the difference between the highest and lowest quartile was also significant at Khorana AA et al. Cancer")
93
Incidence of VTE by Pre-Chemotherapy Leukocyte Count
0% 1% 2% 3% 4% 5% 6% <4.5 (n=342) (n=3202) >11 (n=513) Pre-chemotherapy WBC Counts (x1000/mm 3 ) Incidence Of VTE Over 2.4 Months (%) P =0.0008 Khorana AA et al. Blood 2008
 (n=3202) >11 (n=513) Pre-chemotherapy WBC Counts (x1000/mm. 3. ) Incidence Of VTE Over 2.4 Months (%) P = Khorana AA et al. Blood")
94
Incidence of VTE by Type of Leukocyte
Absolute Neutrophil Count Absolute Monocyte P=0.0001 P<0.0001 Proportion with VTE This bar graph demonstrates that elevation of both absolute neutrophil count and absolute monocyte count prior to initiation of chemotherapy was associated with higher rates of VTE. Absolute lymphocytosis was not associated with increased risk of VTE. Connolly et al ISTH 2009 Abs 1573

95
Independent Effect of Platelet & Leukocyte Counts In A Multivariate Analysis
Variable Odds Ratio* (95% CI) P value Platelet count >350,000/mm3 1.8 ( ) 0.03 Leukocyte count >11,000/mm3 2.2 ( ) 0.008 In a multivariate logistic regression analysis, a pre-chemotherapy platelet count > 350,000 was significantly and independently associated with development of symptomatic venous thromboembolism, with an adjusted odds ration of 2.83, 95% CI ranging from , P= Other variables of significance included primary site of cancer (in particular upper gastrointestinal and lung), hemoglobin < 10g/dL or use of red cell and white cell growth factors. Stage of disease and type of chemotherapy regimen were not significant in uni- or multivariate analysis. *Adjusted for site of cancer, stage, hemoglobin < 10g/dl or use of ESAs and obesity Khorana AA et al. Blood 2008
 P value. Platelet count >350,000/mm ( ) Leukocyte count >11,000/mm ( ) In a multivariate logistic regression analysis, a pre-chemotherapy platelet count > 350,000 was significantly and independently associated with development of symptomatic venous thromboembolism, with an adjusted odds ration of 2.83, 95% CI ranging from , P= Other variables of significance included primary site of cancer (in particular upper gastrointestinal and lung), hemoglobin < 10g/dL or use of red cell and white cell growth factors. Stage of disease and type of chemotherapy regimen were not significant in uni- or multivariate analysis. *Adjusted for site of cancer, stage, hemoglobin < 10g/dl or use of ESAs and obesity. Khorana AA et al. Blood")
96
Effect of Leukocyte and Platelet Counts on VTE Risk
In the Vienna CATS registry, platelet count >443,000 was associated with VTE (HR3.5) Simanek et al, J Thromb Hemost 2009 In the RIETE registry, patients with leukocytosis had increased risk of recurrent VTE and death (OR 2.7) Trujillo-Santos et al, Thromb Hemost 2008 In the REAL-2 study of advanced GEJ/gastric cancers, leukocytosis was associated with VTE during chemotherapy (HR 2.0) Starling et al, J Clin Oncol 2009
 Simanek et al, J Thromb Hemost In the RIETE registry, patients with leukocytosis had increased risk of recurrent VTE and death (OR 2.7) Trujillo-Santos et al, Thromb Hemost In the REAL-2 study of advanced GEJ/gastric cancers, leukocytosis was associated with VTE during chemotherapy (HR 2.0) Starling et al, J Clin Oncol")
97
Mortality by Pre-chemotherapy Leukocyte Count
0.20 0.18 0.16 0.14 0.12 0.10 0.08 0.06 0.04 0.02 0.00 WBC>11x109/L 14.0% (8.9%-21.6%) Proportion Died WBC<11x109/L 4.4% (3.2%-6.1%) Pre-chemotherapy leukocytosis in this cohort was also associated with increased mortality as demonstarted by this survival curve. The mortality rate at 150 days after initiating chemotherapy as estimated by kaplan meier method is 14% in the group with baseline leukocytosis (depicted in red) and 4.4% in the group with normal baseline wbc (depicted in black). This difference was highly significant with p value of < A multivariate survival analysis presented by Dr. Kuderer at ASH in 2008 revealed that leukocytosis was independently predictive of increased mortality with HR 2 and p value of P <0.0001 Time (Days) MVA for early mortality: HR 2.0, p = 0.001 Kuderer et al ASH 2008 Connolly et al ISTH 2009
 Proportion Died. WBC<11x109/L. 4.4% (3.2%-6.1%) Pre-chemotherapy leukocytosis in this cohort was also associated with increased mortality as demonstarted by this survival curve. The mortality rate at 150 days after initiating chemotherapy as estimated by kaplan meier method is 14% in the group with baseline leukocytosis (depicted in red) and 4.4% in the group with normal baseline wbc (depicted in black). This difference was highly significant with p value of < A multivariate survival analysis presented by Dr. Kuderer at ASH in 2008 revealed that leukocytosis was independently predictive of increased mortality with HR 2 and p value of P < Time (Days) MVA for early mortality: HR 2.0, p = Kuderer et al ASH Connolly et al ISTH")
98
Tissue Factor in Cancer: Lack of Standardized Assays
Immunohistochemistry of tumor specimens TF ELISA TF MP procoagulant activity assay Impedance-based flow cytometry

99
Tissue Factor Expression and VTE
Rate of VTE (%) Khorana AA, et al. Clin Cancer Res. 2007;13:
 Khorana AA, et al. Clin Cancer Res. 2007;13:")
100
Circulating Tissue Factor and VTE
Plasma TF (pg/mL) DVT DVT Fatal PE P = .04 Khorana AA, et al. J Thromb Haemost. 2008;6:
 DVT. DVT. Fatal PE. P = .04. Khorana AA, et al. J Thromb Haemost. 2008;6:")
101
Cumulative Incidence of VTE for Cancer Patients According to TF–bearing Microparticles
0.6 0.5 0.4 0.3 0.2 0.1 0.0 Log Rank P=0.002 Cumulative Incidence of VTE Cumulative incidence of VTE for cancer patients initially without VTE according to the presence of tissue factor–bearing microparticles. Tissue factor–bearing microparticle–positive (dashed line; n = 16) and tissue factor–bearing microparticle–negative (solid line; n = 44) cancer patients were assessed for radiographic evidence of thromboembolic disease. In the year following enrollment, thromboembolic disease only developed in a subset of patients who had detectable tissue factor–bearing microparticles. Median follow up was 8.9 mo (range, mo), and 75% of the patients were followed for ≥5 mo. There were 11 deaths on record, at a median of 4 mo after study entry (range, 4 d to 23 mo). Dashed line, cancer patients with high levels of tissue factor bearing microparticles (TFMP+); solid line, those with undetectable levels (TFMP-). Months Zwicker J I et al. Clin Cancer Res 2009;15:
 and tissue factor–bearing microparticle–negative (solid line; n = 44) cancer patients were assessed for radiographic evidence of thromboembolic disease. In the year following enrollment, thromboembolic disease only developed in a subset of patients who had detectable tissue factor–bearing microparticles. Median follow up was 8.9 mo (range, mo), and 75% of the patients were followed for ≥5 mo. There were 11 deaths on record, at a median of 4 mo after study entry (range, 4 d to 23 mo). Dashed line, cancer patients with high levels of tissue factor bearing microparticles (TFMP+); solid line, those with undetectable levels (TFMP-) Months. Zwicker J I et al. Clin Cancer Res 2009;15:")
102
FRAGEM and TF Biomarker Data
Boxplot of the percentage change of tissue factor antigen in the sera of pancreatic cancer patients in both the control and dalteparin groups Control Dalteparin 250 200 150 100 50 -50 Maraveyas, et al. Blood Coagul Fibrinolysis 2010

103
TF and Survival In Pancreatic Cancer
Median Survival in pts with TF MP-PCA >2.5 and </=2.5pg/ml. 10 0.9 0.8 0.7 0.6 0.5 0.4 0.3 0.2 0.1 Median survival was 98.5 days for TF >2.5 pg/mL vs. 231 days for TF </= 2.5 pg/mL p=< N=117 patients with pancreaticobiliary cancers Proportion surviving Days on study TF (pg/mL) < >=2.5 Bharthuar et al ASCO GI 2010
 <2.5 >=2.5. Bharthuar et al ASCO GI")
104
Soluble P-Selectin and VTE in Cancer
0.25 0.20 0.15 0.10 0.05 0.00 687 cancer patients followed for median of days sP-Selectin independent predictor of VTE Cumulative 6-mo probability of VTE was 12% vs 4% for levels < 75th percentile > 75th percentile Cumulative probability of VTE (%) < 75th percentile Observation time (days) Originally published in Ay C, et al. Blood. 2008;112: Copyright © 2008 American Society of Hematology.
 < 75th percentile Observation time (days) Originally published in Ay C, et al. Blood. 2008;112: Copyright © 2008 American Society of Hematology.")
105
D-dimer, F1/2 and VTE in Cancer
Elevated D-d Elevated D-d+F1/2 Elevated F1/2 alone Nonelevated D-d and F1/2 Observation Time (Days) Cumulative Risk (probability) 0.25 0.20 0.15 0.10 0.05 Ay, C. et al. J Clin Oncol; 27:
 Cumulative Risk (probability) Ay, C. et al. J Clin Oncol; 27:")
106
Optimizing Supportive Care in Cancer
Risk Assessment for VTE In Cancer Patients Risk Factors Biomarkers Risk Assessment Models Implications for Study Design of Prophylaxis Trials

107
VTE in Cancer Outpatients
The overwhelming majority of cancer patients are treated in the outpatient/ambulatory setting Which patients are most at risk? Which patients will benefit most from prophylaxis? How do you define “high” risk? Level of risk for which prophylaxis is considered acceptable by both patients and oncologists

108
Patient Characteristic
Risk Model Patient Characteristic Score Site of Cancer Very high risk (stomach, pancreas) High risk (lung, lymphoma, gynecologic, GU excluding prostate) 2 1 Platelet count > 350,000/mm3 Hb < 10g/dL or use of ESA Leukocyte count > 11,000/mm3 BMI > 35 kg/m2 Based on the multivariate analysis, we developed a predictive risk model for identifying patients at high risk for development of VTE at time of initiation of chemotherapy. Risk scores were developed based on the beta-coefficient for each variable in the multivariate model shown on the prior slide, rounded to the nearest integer to make the model clinically usable. A patient with a very high risk site of cancer (such as stomach or pancreas) would be assigned a score of 2; patients with high risk sites of cancer (such as lung, lymphoma, gynecologic or GU cancers) as well as elevated pre-chemotherapy platelet count, anemia with a Hgb < 10 g/dL or use of erythropoiesis-stimulating agent, elevated leukocyte count or a BMI >=35 would all be assigned scores of 1. Khorana AA et al. Blood 2008
 High risk (lung, lymphoma, gynecologic, GU excluding prostate) Platelet count > 350,000/mm3. Hb < 10g/dL or use of ESA. Leukocyte count > 11,000/mm3. BMI > 35 kg/m2. Based on the multivariate analysis, we developed a predictive risk model for identifying patients at high risk for development of VTE at time of initiation of chemotherapy. Risk scores were developed based on the beta-coefficient for each variable in the multivariate model shown on the prior slide, rounded to the nearest integer to make the model clinically usable. A patient with a very high risk site of cancer (such as stomach or pancreas) would be assigned a score of 2; patients with high risk sites of cancer (such as lung, lymphoma, gynecologic or GU cancers) as well as elevated pre-chemotherapy platelet count, anemia with a Hgb < 10 g/dL or use of erythropoiesis-stimulating agent, elevated leukocyte count or a BMI >=35 would all be assigned scores of 1. Khorana AA et al. Blood")
109
Risk Model Validation Rate of VTE over 2.5 mos (%) 8% n=734 n=1627
0.8% 1.8% 7.1% Development cohort 7% 0.3% 2.0% 6.7% Validation cohort n=374 n=842 n=149 6% 5% 4% Rate of VTE over 2.5 mos (%) 3% 2% 1% 0% Risk Low (0) Intermediate(1-2) High(>3) Khorana AA et al. Blood 2008
 3% 2% 1% 0% Risk Low (0) Intermediate(1-2) High(>3) Khorana AA et al. Blood")
110
Vienna CATS Validation
Full data available in 839 patients Median observation time/follow-up: 643 days Score 0 Score 1 Score 2 Score ≥3 6 months 1.5% 3.8% 9.4% 17.7% Number of Patients Events n n (%) Score ≥3 96 16 (17%) Score 2 231 25 (11%) Score 1 233 14 (6%) Score 0 279 7 (3%) Ay et al ISTH 2009 Abs
 Score ≥ (17%) Score (11%) Score (6%) Score (3%) Ay et al ISTH 2009 Abs.")
111
Expanded Risk Score with D-Dimer and sP-selectin
30.3% 1.0% 6 months Number of Patients Events n n (%) Score ≥5 31 9 (29%) Score 4 52 10 (19%) Score 3 137 15 (11%) Score 2 226 11 (5%) Score 1 192 13 (7%) Score 0 201 4 (2%) Ay et al ISTH 2009 Abs
 Score ≥ (29%) Score (19%) Score (11%) Score (5%) Score (7%) Score (2%) Ay et al ISTH 2009 Abs.")
112
Risk Model Is Highly Predictive of Short-Term Overall Survival
By VTE Risk Score Categories Low Intermediate High P < Kuderer NM et al. ASH 2008

113
Progression-Free Survival and Overall Survival by VTE Risk Category
Outcomes (at 4 months) Low Risk N=1,206 Intermediat e Risk N=2,709 High Risk N=543 All Patients N=4,458 Mortality Risk (%) 1.2% 5.9% 12.7% 5.6% HR [+/- CI] 1.0 3.56 [ ] 6.89 [ ] - PFS 93% 82% 72% 84% 2.77 [ ] 4.27 [ ] Kuderer NM et al. ASH 2008
 Low Risk. N=1,206. Intermediat e Risk. N=2,709. High Risk. N=543. All Patients. N=4,458. Mortality. Risk (%) 1.2% 5.9% 12.7% 5.6% HR [+/- CI] [ ] 6.89 [ ] - PFS. 93% 82% 72% 84% 2.77 [ ] 4.27 [ ] Kuderer NM et al. ASH")
114
Optimizing Supportive Care in Cancer
Risk Assessment for VTE In Cancer Patients Risk Factors Biomarkers Risk Assessment Models Implications for Study Design of Prophylaxis Trials

115
Rates of VTE in Recent Prophylaxis Studies
Agnelli et al Lancet Onc 2009 Palumbo et al ASH 2009 Riess et al ISTH 2009 Maraveyas et al ESMO 2009

116
VTE in Lung Cancer: PROTECHT and TOPIC studies
sVTE LMWH sVTE Placebo All VTE LMWH All VTE Placebo PROTECHT 3.5% 5% 4% 6.2% TOPIC-2 3% 5.7% 4.5% 8.3% All 3.2% 5.5% 4.3% 7.8% Major Bleeding LMWH Major Bleeding Placebo PROTECHT 1% 0% TOPIC-2 3.7% 2.2% All 2.5% 1.7% NNT=50 (sVTE) NNT=28 (allVTE) RRR=46% NNH=125 Verso et al. JTH 2010 online
 NNT=28 (allVTE) RRR=46% NNH=125. Verso et al. JTH 2010 online.")
117
International Myeloma Working Group Thromboprophylaxis Recommendations
Individual risk factors: obesity (BMI ≥ 30), prior VTE, central venous catheter Comorbid risk factors: cardiac disease, chronic renal disease, diabetes, acute infection, immobilization Surgery risk factors: trauma, general surgery or any anesthesia Medications: erythropoietin Myeloma-related risk factors: diagnosis, hyperviscosity Myeloma therapy risk factors: multiagent chemotherapy, doxorubicin, high-dose steroids Patients with ≤ 1 VTE risk factor: Aspirin ( mg daily) Patients with ≥ 2 VTE risk factors: LMWH (enoxaparin 40 mg/d) or full-dose warfarin, although less existing supporting data for the latter Patients receiving thalidomide/lenalidomide concurrently with high-dose dexamethasone or doxorubicin should receive LMWH thromboprophylaxis Anticoagulant treatment can continue for 4 to 6 months or longer if additional risk factors are present Palumbo A, Rajkumar SV, Dimopoulos MA, et al. Prevention of thalidomide- and lenalidomide associated thrombosis in myeloma. Leukemia Feb;22(2):
, prior VTE, central venous catheter. Comorbid risk factors: cardiac disease, chronic renal disease, diabetes, acute infection, immobilization. Surgery risk factors: trauma, general surgery or any anesthesia. Medications: erythropoietin. Myeloma-related risk factors: diagnosis, hyperviscosity. Myeloma therapy risk factors: multiagent chemotherapy, doxorubicin, high-dose steroids. Patients with ≤ 1 VTE risk factor: Aspirin ( mg daily) Patients with ≥ 2 VTE risk factors: LMWH (enoxaparin 40 mg/d) or full-dose warfarin, although less existing supporting data for the latter. Patients receiving thalidomide/lenalidomide concurrently with high-dose dexamethasone or doxorubicin should receive LMWH thromboprophylaxis. Anticoagulant treatment can continue for 4 to 6 months or longer if additional risk factors are present. Palumbo A, Rajkumar SV, Dimopoulos MA, et al. Prevention of thalidomide- and lenalidomide associated thrombosis in myeloma. Leukemia Feb;22(2):")
118
PHACS : Prophylaxis in High-risk Ambulatory Cancer Patients Study
Dalteparin prophylaxis x 12 weeks with 4-weekly screening US and start/end CT chest Patients deemed high-risk for VTE starting chemotherapy R Observe x 12 weeks with 4-weekly screening US and start/end CT chest R01 HL , 9/2008

119
Ongoing Clinical Trials
Study (Agent) Criteria for inclusion* N Endpoints PHACS (dalteparin x 12 wks) -Risk score >=3 404 Asymptomatic and symptomatic VTE SAVE-ONCO (semuloparin up to 4 mos) -Lung, bladder, GI, ovary -Metastatic or locally advanced 3200 DVT, PE, VTE-related death MicroTEC (enoxaparin x 6 mos) -Lung, colon, pancreas -Metastatic or unresectable -Elevated TF MPs 227 VTE * All studies enroll patients initiating a new chemotherapy regimen
 Criteria for inclusion* N. Endpoints. PHACS. (dalteparin x 12 wks) -Risk score >= Asymptomatic and symptomatic VTE. SAVE-ONCO (semuloparin up. to 4 mos) -Lung, bladder, GI, ovary. -Metastatic or locally advanced DVT, PE, VTE-related death. MicroTEC (enoxaparin x 6 mos) -Lung, colon, pancreas. -Metastatic or unresectable. -Elevated TF MPs VTE. * All studies enroll patients initiating a new chemotherapy regimen.")
120
Treatment of VTE in Cancer: The CLOT Study
Lee, A. Y.Y. et al. N Engl J Med 2003;349:

121
Reduction in Recurrent VTE
CLOT Study: Reduction in Recurrent VTE 5 10 15 20 25 Days Post Randomization 30 60 90 120 150 180 210 Probability of Recurrent VTE, % Risk reduction = 52% p-value = Dalteparin OAC Recurrent VTE Lee et.al. N Engl J Med, 2003;349:146

122
Summary of NCCN Guidelines Updates
Summary of Major Changes in the Version of the NCCN Venous Thromboembolic Disease Guidelines

123
Changes in 2009 NCCN Guidelines
Stage 1 Immediate: “Stage 1 Immediate: Concomitant with diagnosis or while diagnosis and risk assessment (heparin phase)” changed to “Stage 1 Immediate: At diagnosis or during diagnostic evaluation” Low –molecular-weight-heparin: New footnote “6” was added that states, “Although each of the low molecular weight heparins (LMWH), have been studies in randomized control trials in cancer patients, dalteparin’s efficacy in this population is supported by the highest quality evidence and it is the only LMWH approved by the FDA for this indication.” Unfractionated heparin (IV): target aPTT range changed from “ x control) to “ x control…” (Also for VTE-H) in these patients.
 changed to Stage 1 Immediate: At diagnosis or during diagnostic evaluation Low –molecular-weight-heparin: New footnote 6 was added that states, Although each of the low molecular weight heparins (LMWH), have been studies in randomized control trials in cancer patients, dalteparin’s efficacy in this population is supported by the highest quality evidence and it is the only LMWH approved by the FDA for this indication. Unfractionated heparin (IV): target aPTT range changed from x control) to x control… (Also for VTE-H) in these patients.")
124
Changes in 2009 NCCN Guidelines
Stage 3 Chronic: “Third bullet: “Consider indefinite anticoagulation….” changed to “Recommend indefinite anticoagulation….” Fourth bullet: “For catheter associated thrombosis, anticoagulate as long as catheter is in place and for at least 3 months after catheter removal”.

125
Changes in 2009 NCCN Guidelines
6Although each of the low molecular weight heparins (LMWH) have been studied in randomized controlled trials in cancer patients, dalteparin’s efficacy in this population is supported by the highest quality evidence and is the only LMWH approved by the FDA for this indication. Lee AYY, Levine MN, Baker RI, Bowden C, et al. Low-molecular-weight heparin versus a coumarin for the prevention of recurrent venous thromboembolism on patients with cancer. New Eng J Med 2003;349(2):
 have been studied in randomized controlled trials in cancer patients, dalteparin’s efficacy in this population is supported by the highest quality evidence and is the only LMWH approved by the FDA for this indication. Lee AYY, Levine MN, Baker RI, Bowden C, et al. Low-molecular-weight heparin versus a coumarin for the prevention of recurrent venous thromboembolism on patients with cancer. New Eng J Med 2003;349(2):")
126
(VTE-D): Therapeutic Anticoagulation Treatment for VTE
The NCCN panel recommends VTE thromboprophylaxis for all hospitalized patients with cancer who do not have contraindications to such therapy, and the panel also emphasized that an increased level of clinical suspicion of VTE should be maintained for cancer patients. Following hospital discharge, it is recommended that patients at high-risk of VTE (e.g. cancer surgery patients) continue to receive VTE prophylaxis for up to 4 weeks post-operation. Careful evaluation and follow-up of cancer patients in whom VTE is suspected and prompt treatment and follow-up for patients diagnosed with VTE is recommended after the cancer status of the patient is assessed and the risks and benefits of treatment are considered.
 continue to receive VTE prophylaxis for up to 4 weeks post-operation. Careful evaluation and follow-up of cancer patients in whom VTE is suspected and prompt treatment and follow-up for patients diagnosed with VTE is recommended after the cancer status of the patient is assessed and the risks and benefits of treatment are considered.")
127
Therapeutic Anticoagulation Failure
INR Switch to heparin (LMWH preferred) or fondaparinux Increase warfarin dose and treat with parenteral agent until INR target achieved or consider switching to heparin (LMWH preferred) or fondaparinux Patient on warfarin Check Sub-therapeutic
 or fondaparinux. Increase warfarin dose and treat with parenteral agent until INR target achieved or consider switching to heparin (LMWH preferred) or fondaparinux. Patient. on. warfarin. Check. Sub-therapeutic.")
128
Therapeutic Anticoagulation Failure
aPTT Increase dose of heparin or Switch to LMWH or Switch to fondaparinux and Consider placement of IVC filter and Consider HIT Increase dose of heparin to reach therapeutic level Patient on heparin Check aPTT levels Sub-therapeutic

129
TF is an emerging candidate biomarker predictive of VTE and survival
Conclusions Cancer patients are clearly at increased risk for VTE but risk is highly variable TF is an emerging candidate biomarker predictive of VTE and survival ?generalizability to all cancers Lack of standardized assay A recently validated risk model can predict risk of VTE (and mortality) using 5 simple clinical and laboratory variables
 using 5 simple clinical and laboratory variables.")
130
Conclusions Thromboprophylaxis is safe and effective in certain high-risk settings LMWH-base prophylaxis is guideline-based standard of care Hospitalized and surgical patients Highly selected cancer outpatients (myeloma, ?pancreas, ?? lung) Ongoing studies are adopting novel approaches to selecting patients for prophylaxis
 Ongoing studies are adopting novel approaches to selecting patients for prophylaxis.")
131
Hematologic Complications of Chemotherapy
Investigations • Innovation • Clinical Application Hematologic Complications of Chemotherapy Balancing Benefits and Risks of Intervention Jeffrey Crawford, MD George Barth Geller Professor for Research In Cancer Chief of Division of Medical Oncology Department of Medicine Duke University Medical Center Editor-in-Chief, Supportive Care Oncology Durham, North Carolina

133
Enrollment of providers begins March 24, 2010.
APPRISE – Assisting Providers and Cancer Patients with Risk Information for the Safe Use of ESAs Doctors will be required to register and undergo training on risks and benefits of ESAs in order to continue prescribing. As part of the program, patients will be given a medication guide that outlines the risks and benefits of ESAs. Enrollment of providers begins March 24,

134
Biological Characteristics of Erythroid Stimulating Agents (ESAs)
Epoetin alfa – FDA approval for chemotherapy induced anemia (CIA) In vivo half-life 8.5 h (IV) and h (SC) in healthy subjects1 Darbepoetin alfa – FDA approval for CIA -2002 Higher proportion of sialic acid-containing carbohydrate, resulting in a 3-fold longer half-life and a 4-fold weaker binding affinity for the EPO receptor2 Epoetin beta – Approved for CIA in Europe Less sialated than epoetin alfa and a slightly longer half-life when given SC (~24 h in healthy subjects)3 Despite pharmacodynamic differences, efficacy/safety of ESAs in CIA patients appear similar 1Procrit prescribing information 2002; 2Egrie JC et al. Oncology (Huntingt) 2002; 3Halstenson CE et al. Clin Pharmacol Ther 1991
 In vivo half-life 8.5 h (IV) and h (SC) in healthy subjects1. Darbepoetin alfa – FDA approval for CIA Higher proportion of sialic acid-containing carbohydrate, resulting in a 3-fold longer half-life and a 4-fold weaker binding affinity for the EPO receptor2. Epoetin beta – Approved for CIA in Europe. Less sialated than epoetin alfa and a slightly longer half-life when given SC (~24 h in healthy subjects)3. Despite pharmacodynamic differences, efficacy/safety of ESAs in CIA patients appear similar. 1Procrit prescribing information 2002; 2Egrie JC et al. Oncology (Huntingt) 2002; 3Halstenson CE et al. Clin Pharmacol Ther")
135
Rescue by Transfusion vs an Improvement/ Maintenance Strategy with ESAs: a Conceptual Model
ESA improvement/ maintenance strategy Asymptomatic Zone Hb Level Transfusion Rescue Strategy Individualized patient trigger Weeks of Chemotherapy ODAC Meeting, 5/20/07

136
Modeled Probability of Receiving a Blood Transfusion as a Function of Baseline Hb
1 DA Placebo 0.9 0.8 0.7 0.6 Predicted Probability TFN 0.5 0.4 0.3 0.2 OR=0.41, 95%CI (0.33, 0.51) 0.1 15 14 13 12 11 10 9 8 7 6 5 Baseline Hb (g/dL) 4 Phase 3, placebo-controlled CIA Studies, n=1641 (980297, , , ) ODAC Meeting, 5/20/07
 Baseline Hb (g/dL) 4 Phase 3, placebo-controlled CIA Studies, n=1641 (980297, , , ) ODAC Meeting, 5/20/07.")
137
Summary of HRQoL Data from Systematic Review of Randomized Placebo-controlled Trials
Difference in Standardized Mean FACT-F Values (95% CI) Difference in Standardized Means (95% CI) Source P Littlewood 0.23 (-0.02 to 0.48) 0.076 Boogaerts 0.11 (-0.16 to 0.38) 0.428 Iconomou 0.44 (0.07 to 0.82) 0.021 Witzig 0.11 (-0.12 to 0.33) 0.360 Savonije 0.42 (0.12 to 0.71) 0.005 Fixed-effects model 0.22 (0.10 to 0.34) 0.000 Random-effects model 0.22 (0.10 to 0.36) 0.001 -1.00 -0.50 0.00 0.50 1.00 QOL Scale (ESA vs control) Mean Change P-value FACT-F (5 studies, 1418 max pts) 3.6 vs -0.8 <0.001 LASA (4 studies, 1076 max pts) 4.8 vs -3.6 Favors Control Favors EPO/DARB 3-point difference in FACT-F defined as clinically important1 1Cella D et al, J Pain Symptom Manage. 2002;24(6): Ross, S et al. Clin Ther. 2006; 28(6): 1-31
 Difference in Standardized Means (95% CI) Source. P. Littlewood (-0.02 to 0.48) Boogaerts (-0.16 to 0.38) Iconomou (0.07 to 0.82) Witzig (-0.12 to 0.33) Savonije (0.12 to 0.71) Fixed-effects model (0.10 to 0.34) Random-effects model (0.10 to 0.36) QOL Scale (ESA vs control) Mean Change. P-value. FACT-F (5 studies, 1418 max pts) 3.6 vs < LASA (4 studies, 1076 max pts) 4.8 vs Favors Control. Favors EPO/DARB. 3-point difference in FACT-F defined as clinically important1. 1Cella D et al, J Pain Symptom Manage. 2002;24(6): Ross, S et al. Clin Ther. 2006; 28(6):")
138
Higher Hb is Associated with Higher HRQoL
65 60 55 LASA Overall QOL Score 50 45 7 8 9 10 11 12 13 14 1 study (n=1580) Hb level (g/dL) Crawford J, et al. Cancer. 2002;95(4):
 Hb level (g/dL) Crawford J, et al. Cancer. 2002;95(4):")
139
When and Why do Physicians Transfuse
When and Why do Physicians Transfuse? Data from 5 Phase 3 CIA Darbepoetin alfa Studies Across all studies, recommendation for transfusion was Hb <8 g/dL (or signs & symptoms of anemia) (n=2286) Hb at Time of Transfusion (n=2185 transfusion episodes) Reasons Given for Transfusion (n=2227 CRF responses ) 10-12 g/dL 9.2% ≥12 g/dL (0.7%) Hb Trigger 34.7% Therapeutic 46.0% <8 g/dL 35.9% 8 – 10 g/dL 54.3% Other 13.7% Prophylactic (1.2%) Medically Indicated (4.4%)
 (n=2286) Hb at Time of Transfusion (n=2185 transfusion episodes) Reasons Given for Transfusion (n=2227 CRF responses ) g/dL. 9.2% ≥12 g/dL (0.7%) Hb Trigger 34.7% Therapeutic 46.0% <8 g/dL 35.9% 8 – 10 g/dL 54.3% Other 13.7% Prophylactic (1.2%) Medically Indicated (4.4%)")
140
Common Risks of Blood Product Infusions
Some of the Risks of Transfusion Febrile nonhemolytic Acute transfusion reaction from mismatch Acute hemolytic Delayed hemolytic Allergic Anaphylactic Human leukocyte antigen sensitization Red blood cell allosensitization Graft-versus-host disease Clotting disturbances Electrolyte disturbances Volume overload in the young and elderly Transfusion-related acute lung injury Peri-operative infection susceptibility Blood borne infectoons – viral (HIV, hepatitis), bacterial, prions, parasites (malaria) Increased tumor recurrence from peri- operative transfusion Worsensed cancer prognosis from peri-operative transfusion Upile, T, et al. Clinical Advances in Hematology & Oncology Volume 7, Issue 10 October 2009
, bacterial, prions, parasites (malaria) Increased tumor recurrence from peri- operative transfusion. Worsensed cancer prognosis from peri-operative transfusion. Upile, T, et al. Clinical Advances in Hematology & Oncology Volume 7, Issue 10 October")
141
Patterns of Use and Risks Associated with Erythropoiesis-Stimulating Agents Among Medicare Patients with Cancer Background: Erythropoiesis-stimulating agents (erythropoietin and darbepoietin) have been approved to reduce the number of blood transfusions required during chemotherapy; however, concerns about the risks of venous thromboembolism and mortality exist. Methods: Study of patients aged 65 years or older in the Surveillance, Epidemiology and End Results-Medicare database; with colon, non-small cell lung or breast cancer or with diffuse large B-cell lymphoma from 1991 through 2001; and who received chemotherapy. The main outcome measures were claims for use of an erythropoiesis-stimulating agent, blood transfusion, venous thromboembolism (i.e., deep vein thrombosis or pulmonary embolism), and overall survival. Hershman, D. JNCI 101 (23):1-9, 2009
 have been approved to reduce the number of blood transfusions required during chemotherapy; however, concerns about the risks of venous thromboembolism and mortality exist. Methods: Study of patients aged 65 years or older in the Surveillance, Epidemiology and End Results-Medicare database; with colon, non-small cell lung or breast cancer or with diffuse large B-cell lymphoma from 1991 through 2001; and who received chemotherapy. The main outcome measures were claims for use of an erythropoiesis-stimulating agent, blood transfusion, venous thromboembolism (i.e., deep vein thrombosis or pulmonary embolism), and overall survival. Hershman, D. JNCI 101 (23):1-9,")
142
Patterns of Use and Risks of ESAs
Results 56,210 patients received chemotherapy 15,346 (27%) received an ESA 22% received transfusions 14.3% of ESA patients had VTE 9.8% of nonESA patients had VTE ESA – erythroid stimulating agent VTE – venous thromboembolism Hershman, D. JNCI 101 (23):1-9, 2009
 received an ESA. 22% received transfusions. 14.3% of ESA patients had VTE. 9.8% of nonESA patients had VTE. ESA – erythroid stimulating agent. VTE – venous thromboembolism. Hershman, D. JNCI 101 (23):1-9,")
143
Trends in ESA and Transfusion
Use in All Patients 70 60 50 40 30 20 10 % of Patients Receiving ESA % of Patients Receiving Blood Transfusion % of Patients Hershman, D. JNCI 101 (23):1-9, 2009
:1-9,")
144
Overall Survival Proportion alive EAS use ESA non-use
1.00 0.75 0.50 0.25 Proportion alive EAS use ESA non-use Time to death (years) Hershman, D. JNCI 101 (23):1-9, 2009
 Hershman, D. JNCI 101 (23):1-9,")
145
Blood Transfusions, Thrombosis and Mortality in Hospitalized Patients with Cancer
Population 504,208 pts with cancer admitted between at 60 medical centers Khorana, Francis, Blumberg, Culakova, Refaai, Lyman. Arch Intern Med 2008;168:

146
Blood Transfusions, Thrombosis and Mortality in Hospitalized Patients with Cancer
Khorana, Francis, Blumberg, Culakova, Refaai, Lyman. Arch Intern Med 2008;168:

147
Community Oncology ESA Experience
Mean hemoglobin levels at different time points Timepoint Pre-NCD cohort Post NCD cohort P Value Number Hb level (SD) Baseline 225 10.7 (0.9) 144 9.7 (0.8) <0.0001 Week 4 206 11.0 (1.2) 138 10.2 (1.2) Week 8 11.2 (1.3) 102 10.3 (1.1) Feinberg, B. Community Oncology, June 2009,
 Baseline (0.9) (0.8) < Week (1.2) (1.2) Week (1.3) (1.1) Feinberg, B. Community Oncology, June 2009,")
148
Community Oncology ESA Experience
Feinberg, B. Community Oncology, June 2009,

149
Focused ESA Safety Data
Survival, Tumor Progression, TVE* ENHANCE ‡ BEST ‡ EPO-CAN ‡ PREPARE 11/07† Eight cancer trials were chosen for inclusion in the ESA product labeling (May, 2008) reporting decreased survival times, tumor progression and/or increased thrombotic events in the ESA arms. Among the many studies conducted, approximately 57, these eight had the most rigorous protocol for the collection of ESA safety data and are included on this timeline. Depending on the trial, the data presented here is either found on the FDA website or extracted from an actual publication of the study. /05, 4/07† /07† GOG † DAHANCA 12/06† *8 trials selected by FDA for label inclusion out of 57 total, ‡ publication date, † = date data reported to FDA Lancet 2003;632: J Natl Cancer Inst 2006:98: J Clin Oncol 2005;23: J Natl Cancer Inst 2005;97: J Clin Oncol 2007;25: (accessed 3/20/08). JAMA 2008;299:914-24
 reporting decreased survival times, tumor progression and/or increased thrombotic events in the ESA arms. Among the many studies conducted, approximately 57, these eight had the most rigorous protocol for the collection of ESA safety data and are included on this timeline. Depending on the trial, the data presented here is either found on the FDA website or extracted from an actual publication of the study /05, 4/07† /07† GOG † DAHANCA 12/06† *8 trials selected by FDA for label inclusion out of 57 total, ‡ publication date, † = date data reported to FDA. Lancet 2003;632: J Natl Cancer Inst 2006:98: J Clin Oncol 2005;23: J Natl Cancer Inst 2005;97: J Clin Oncol 2007;25: (accessed 3/20/08). JAMA 2008;299:")
150
EPO CAN-20 300 patients not on active treatment
Primary endpoint: QOL at 12 weeks Target hemoglobin g/dL Unplanned safety analysis 70 patients Result : Survival decrement HR 1.84

151
Key Point This graph depicts overall survival (OS) over time and as a function of treatment arm (Epoetin alfa vs. placebo) Results of an interim analysis of 70 patients revealed a significant difference in median time to death in favor of placebo (63 vs 129 days; hazard ratio 1.84, P = 0.04). Deaths occurred in 32 of 33 patients in the treatment group and 34 of 37 patients in the placebo group. The majority of deaths were reported as disease progression. Reference Wright JR, Ung YC, Julian JA, et al. Randomized, double-blind, placebo-controlled trial of erythropoietin in non-small-cell lung cancer with disease-related anemia. J Clin Oncol. 2007;25(9):
. Deaths occurred in 32 of 33 patients in the treatment group and 34 of 37 patients in the placebo group. The majority of deaths were reported as disease progression. Reference. Wright JR, Ung YC, Julian JA, et al. Randomized, double-blind, placebo-controlled trial of erythropoietin in non-small-cell lung cancer with disease-related anemia. J Clin Oncol. 2007;25(9):")
152
EPO-CAN-20 (Advanced NSCLC)
Reported Causes of Death Cause of Death Placebo (34 deaths) Epoetin Alfa (32 deaths) No. of Patients % Progressive lung cancer 31 91.2 28 87.5 Pneumonia 1 2.9 3.1 Myocardial infarction Renal failure - Hyponatremia Bowel perforation Unknown cause Wright J et al. JCO 2007 Mar 20;25(9): Epub 2007 Feb 20
 Epoetin Alfa. (32 deaths) No. of Patients. % Progressive lung cancer Pneumonia Myocardial infarction. Renal failure. - Hyponatremia. Bowel perforation. Unknown cause. Wright J et al. JCO 2007 Mar 20;25(9): Epub 2007 Feb 20.")
153
Meta-analysis: Lung Cancer Trials
Study Name No. of Deaths/Total Odds Ratio 95% CI ESA Control Lower Limit Upper Limit AoC NSCLC Wright 2007 (EPO-CAN-20) 32/33 34/37 2.82 0.28 28.56 CIA NSCLC EPO-GER-22 146/195 159/190 0.58 0.35 0.96 Vansteenkiste 2002 NSCLC 72/108 82/114 0.78 0.44 1.38 Milroy 2003 (INT-49) 136/214 126/210 1.16 0.79 1.72 Random Effects Model: NSCLC 0.83 0.54 1.27 CIA SCLC Vansteenkiste 2002 SCLC 28/47 37/45 0.32 0.12 Pirker 2007 (AMG ) 241/298 251/298 0.52 1.21 EPO-CAN-15 28/52 29/52 0.93 0.43 2.00 Thatcher 1999 7/86 3/44 0.30 4.93 Grote 2005 (N93-004) 100/109 101/115 1.54 0.64 3.72 Random Effects Model: SCLC 0.53 1.28 0.1 0.2 0.5 1 2 5 10 Favors ESA Favors Control ODAC 2008 Supplement 153
 32/33. 34/ CIA NSCLC. EPO-GER / / Vansteenkiste 2002 NSCLC. 72/ / Milroy 2003 (INT-49) 136/ / Random Effects Model: NSCLC CIA SCLC. Vansteenkiste 2002 SCLC. 28/47. 37/ Pirker 2007 (AMG ) 241/ / EPO-CAN /52. 29/ Thatcher /86. 3/ Grote 2005 (N93-004) 100/ / Random Effects Model: SCLC Favors ESA. Favors Control. ODAC 2008 Supplement")
154
Cochrane Meta Analysis – Summary of Results
Study population N Hazard Ratio (95% CI) P-value On-study mortality1 All cancer pts 13, 933 1.17 (1.06, 1.30) 0.002 Chemotherapy trials 10, 441 1.10 (0.98, 1.24) 0.12 Overall survival2 1.06 (1.00, 1.12) 0.05 1.04 (0.97, 1.11) 0.26 1deaths during active study phase; 2 deaths during longest follow-up available Bohlius et al, (Lancet 2009)
 P-value. On-study mortality1. All cancer pts. 13, (1.06, 1.30) Chemotherapy trials. 10, (0.98, 1.24) Overall survival (1.00, 1.12) (0.97, 1.11) deaths during active study phase; 2 deaths during longest follow-up available. Bohlius et al, (Lancet 2009)")
155
Meta Analysis of Disease Progression
Glaspy, Crawford, Vansteenkiste, Henry, Rao, Bowers, Berlin, Tomita, Bridges, Ludwig British Journal of Cancer 102, (5 January 2010)
")
158
Clinical Trials Identifier NCT00858364
A Randomized, Double-Blind, Placebo-Controlled Study to Evaluate the Long-Term Safety and Efficacy of Darbepoetin Alfa Administered at 500 µg Once-Every-3-Weeks in Anemic Subjects With Advanced Stage Non-Small Cell Lung Cancer Receiving Multi-Cycle Chemotherapy 158

159
Clinical Trials Identifier NCT00858364
Sponsor Amgen Inc. General Design Randomized, double-blind, placebo-controlled Phase 3, non-inferiority study intended to evaluate the long term safety and efficacy of darbepoetin alfa Intervention Aranesp or placebo administered Q3W (2:1 randomization) Study population Subjects with advanced stage non-small cell lung cancer and anemia (Hb <=11 g/dL) receiving or about to receive first-line chemotherapy Sample size subjects 159
 Study population Subjects with advanced stage non-small cell lung cancer and anemia (Hb <=11 g/dL) receiving or about to receive first-line chemotherapy. Sample size 3000 subjects")
160
Clinical Trials Identifier NCT00858364
Primary outcome measure Overall Survival (OS) Secondary outcome measures Progression-free survival (PFS) Objective tumor response Incidence of at least 1 RBC transfusion or hemoglobin less than or equal to 8.0 g/dL from week 5 (day 29) to end of efficacy treatment period Incidence of at least 1 RBC transfusion or hemoglobin less than or equal to 8.0 g/dL from study day 1 to end of treatment period Incidence of neutralizing antibody formation to darbepoetin alfa Change in hemoglobin from baseline to end of efficacy treatment period Incidence of adverse events (AEs) such as thrombovascular events (TVE), venous thromboembolic events (VTE), and AEs associated with RBC transfusions 160
 Secondary outcome measures. Progression-free survival (PFS) Objective tumor response. Incidence of at least 1 RBC transfusion or hemoglobin less than or equal to 8.0 g/dL from week 5 (day 29) to end of efficacy treatment period. Incidence of at least 1 RBC transfusion or hemoglobin less than or equal to 8.0 g/dL from study day 1 to end of treatment period. Incidence of neutralizing antibody formation to darbepoetin alfa. Change in hemoglobin from baseline to end of efficacy treatment period. Incidence of adverse events (AEs) such as thrombovascular events (TVE), venous thromboembolic events (VTE), and AEs associated with RBC transfusions")
161
Study Status as of June 2010 Study start date: June 2009
Currently recruiting subjects in North America, Europe, Asia and Latin America Study sites planned for a total of approximately 400 sites in over 30 countries

162
Chemotherapy-induced Neutropenia and Its Complications
Myelosuppressive chemotherapy Neutropenia Febrile neutropenia (FN) Chemotherapy dose delays and dose reductions Complicated life-threatening infection and prolonged hospitalization Decreased relative dose intensity (RDI) From ‘Clinical benefits of pegfilgrastim primary prophylaxis’ slide set Despite major advances in oncology with the availability of G-CSFs, the consequences of chemotherapy-induced neutropenia (CIN) can still be fatal. Such an outcome in the management of an early stage breast cancer patient is unacceptable, but still reported1. Neutropenic patients are highly susceptible to infections, which can lead to febrile neutropenia (FN; defined as absolute neutrophil count (ANC) < 0.5 x 10⁹/L and temperature ≥ 38.2°C). FN is potentially life-threatening, requiring immediate hospitalisation and treatment with antibiotics. A recent study of discharge records from 41,779 adult cancer patients admitted to hospital for FN, showed overall in-patient mortality to be 9.5%1. The risk of mortality increased significantly for patients with additional co-morbidities; patients with more than one major co-morbidity had a > 20% risk of mortality. Co-morbidities included congestive heart failure or other heart disease, lung disease, liver disease, renal disease, cerebrovascular disease, peripheral vascular disease, pulmonary embolism, deep venous thrombosis, anaemia and transfusion requirement. A frequent response to neutropenia is to reduce or delay subsequent chemotherapy treatment, resulting in reduced relative dose intensity (RDI). Reducing RDI by as little as 5% or 10% can negatively impact patient survival2,3. Both 10-year event-free survival and overall survival were significantly reduced in early stage breast cancer patients who received 95% RDI of adjuvant anthracycline non-taxane-based chemotherapy, compared with those receiving 95% RDI (N = 1,056)2. Non-Hodgkin lymphoma (NHL) patients who received 90% RDI of CHOP-21 chemotherapy had significantly lower survival than those receiving > 90% RDI (p = 0.002, N = 210)3. References Kuderer NM, Dale DC, Crawford J, et al. Mortality, morbidity and cost associated with febrile neutropenia in adult cancer patients. Cancer 2006;106:2258–2266. Chirivella I, Bermejo A, Insa A, et al. Impact of chemotherapy dose-related factors on survival in breast cancer patients treated with adjuvant anthracycline-based chemotherapy. J Clin Oncol 2006;24:Abstract 668. Bosly A, Bron D, Van Hoof A, et al. Achievement of optimal average relative dose intensity and correlation with survival in diffuse large B-cell lymphoma patients treated with CHOP. Ann Hematol 2007, advance access published October 20, 2007; doi: /s y. Reduced survival Kuderer NM et al. Cancer 2006;106:2258–2266 Chirivella I et al. J Clin Oncol 2006;24;abstract 668 Bosly A et al. Ann Hematol 2008;87:
 Chemotherapy dose delays and dose reductions. Complicated life-threatening infection and prolonged hospitalization. Decreased relative dose intensity (RDI) From ‘Clinical benefits of pegfilgrastim primary prophylaxis’ slide set. Despite major advances in oncology with the availability of G-CSFs, the consequences of chemotherapy-induced neutropenia (CIN) can still be fatal. Such an outcome in the management of an early stage breast cancer patient is unacceptable, but still reported1. Neutropenic patients are highly susceptible to infections, which can lead to febrile neutropenia (FN; defined as absolute neutrophil count (ANC) < 0.5 x 10⁹/L and temperature ≥ 38.2°C). FN is potentially life-threatening, requiring immediate hospitalisation and treatment with antibiotics. A recent study of discharge records from 41,779 adult cancer patients admitted to hospital for FN, showed overall in-patient mortality to be 9.5%1. The risk of mortality increased significantly for patients with additional co-morbidities; patients with more than one major co-morbidity had a > 20% risk of mortality. Co-morbidities included congestive heart failure or other heart disease, lung disease, liver disease, renal disease, cerebrovascular disease, peripheral vascular disease, pulmonary embolism, deep venous thrombosis, anaemia and transfusion requirement. A frequent response to neutropenia is to reduce or delay subsequent chemotherapy treatment, resulting in reduced relative dose intensity (RDI). Reducing RDI by as little as 5% or 10% can negatively impact patient survival2,3. Both 10-year event-free survival and overall survival were significantly reduced in early stage breast cancer patients who received 95% RDI of adjuvant anthracycline non-taxane-based chemotherapy, compared with those receiving 95% RDI (N = 1,056)2. Non-Hodgkin lymphoma (NHL) patients who received 90% RDI of CHOP-21 chemotherapy had significantly lower survival than those receiving > 90% RDI (p = 0.002, N = 210)3. References. Kuderer NM, Dale DC, Crawford J, et al. Mortality, morbidity and cost associated with febrile neutropenia in adult cancer patients. Cancer 2006;106:2258–2266. Chirivella I, Bermejo A, Insa A, et al. Impact of chemotherapy dose-related factors on survival in breast cancer patients treated with adjuvant anthracycline-based chemotherapy. J Clin Oncol 2006;24:Abstract 668. Bosly A, Bron D, Van Hoof A, et al. Achievement of optimal average relative dose intensity and correlation with survival in diffuse large B-cell lymphoma patients treated with CHOP. Ann Hematol 2007, advance access published October 20, 2007; doi: /s y. Reduced survival. Kuderer NM et al. Cancer 2006;106:2258–2266. Chirivella I et al. J Clin Oncol 2006;24;abstract 668. Bosly A et al. Ann Hematol 2008;87:")
163
Risk of FN Increases with Duration of Severe Neutropenia*
100 80 60 40 20 Predicted probability of FN (%) (temperature >38.2◦C and ANC <0.5 x 10⁹/L) From ‘Optimal G-CSF administration in the management of chemotherapy- induced neutropenia’ slide deck In addition to being dependent on the depth or severity of neutropenia, FN risk is also dependent on the duration of CIN. The more prolonged the period of neutropenia, the higher the risk of infection.1 The graph shown here is based on an analysis2 of data from a pivotal randomised double-blind placebo-controlled trial of filgrastim.3 The trial investigated the effect of filgrastim prophylaxis on the incidence of neutropenia in 211 patients with SCLC (small-cell lung cancer), treated with the CAE regimen (cyclophosphamide, doxorubicin, and etoposide). This slide shows the predicted probability of FN as a function of the duration of severe neutropenia in the first cycle of chemotherapy. The greater the number of days of severe neutropenia experienced, the greater the predicted probability of developing FN. References 1Bodey GP, Buckley M, Sathe YS, Freireich EJ. Quantitative relationships between circulating leukocytes and infection in patients with acute leukemia. Ann Intern Med. 1966;61:328–340. 2Blackwell S, Crawford J. In: Morstyn G, Dexter TM, eds. Filgrastim (r-met HuG-CSF) in Clinical Practice. New York, NY: Marcel Dekker; 1994: 3Crawford J, Ozer H, Stoller R, et al. Reduction by granulocyte colony-stimulating factor of fever and neutropenia induced by chemotherapy in patients with small-cell lung cancer. N Engl J Med. 1991;325:164–170. Days of severe neutropenia *ANC <0.5 x 10⁹/L Adapted from Blackwell S, Crawford J. In: Morstyn G, Dexter TM. Filgrastim; (r-metHuG-CSF) in Clinical Practice. New York: Marcel Dekker; 1994 p 103–116 Crawford J et al. N Engl J Med 1991;325:164–170
 (temperature >38.2◦C and ANC <0.5 x 10⁹/L) From ‘Optimal G-CSF administration in the management of chemotherapy- induced neutropenia’ slide deck. In addition to being dependent on the depth or severity of neutropenia, FN risk is also dependent on the duration of CIN. The more prolonged the period of neutropenia, the higher the risk of infection.1. The graph shown here is based on an analysis2 of data from a pivotal randomised double-blind placebo-controlled trial of filgrastim.3 The trial investigated the effect of filgrastim prophylaxis on the incidence of neutropenia in 211 patients with SCLC (small-cell lung cancer), treated with the CAE regimen (cyclophosphamide, doxorubicin, and etoposide). This slide shows the predicted probability of FN as a function of the duration of severe neutropenia in the first cycle of chemotherapy. The greater the number of days of severe neutropenia experienced, the greater the predicted probability of developing FN. References. 1Bodey GP, Buckley M, Sathe YS, Freireich EJ. Quantitative relationships between circulating leukocytes and infection in patients with acute leukemia. Ann Intern Med. 1966;61:328–340. 2Blackwell S, Crawford J. In: Morstyn G, Dexter TM, eds. Filgrastim (r-met HuG-CSF) in Clinical Practice. New York, NY: Marcel Dekker; 1994: Crawford J, Ozer H, Stoller R, et al. Reduction by granulocyte colony-stimulating factor of fever and neutropenia induced by chemotherapy in patients with small-cell lung cancer. N Engl J Med. 1991;325:164– Days of severe neutropenia. *ANC <0.5 x 10⁹/L. Adapted from Blackwell S, Crawford J. In: Morstyn G, Dexter TM. Filgrastim; (r-metHuG-CSF) in Clinical Practice. New York: Marcel Dekker; 1994 p 103–116. Crawford J et al. N Engl J Med 1991;325:164–170.")
164
Most Initial FN Events Occur During the First Cycle of Chemotherapy
Proportion of first FN events in cycle 1 by cancer type Events in cycle 1 (%) From ‘Clinical benefits of pegfilgrastim primary prophylaxis’ slide set – UPDATED IN LINE WITH PAPER FN events documented in 287/2692 (10.7%) of adult cancer patients during the 1st three cycles of chemotherapy NSCLC – non-small cell lung cancer; SCLC – small cell lung cancer; NHL - non-Hodgkin’s lymphoma; HD – Hodgkin’s disease Adapted from Crawford J et al. JNCCN 2008;6:109–118
 From ‘Clinical benefits of pegfilgrastim primary prophylaxis’ slide set – UPDATED IN LINE WITH PAPER. FN events documented in 287/2692 (10.7%) of adult cancer patients during the 1st three cycles of chemotherapy. NSCLC – non-small cell lung cancer; SCLC – small cell lung cancer; NHL - non-Hodgkin’s lymphoma; HD – Hodgkin’s disease. Adapted from Crawford J et al. JNCCN 2008;6:109–118.")
165
Death as a Result of FN Hospitalization
25 20 15 10 5 Mortality following hospital admission of adult cancer patients with FN* 21.4 Inpatient mortality (percent patients admitted for FN) 10.3 9.5 From ‘Optimal G-CSF administration in the management of chemotherapy- induced neutropenia’ slide deck [Note: subtitle changed from the original] This study shows that FN is associated with increased mortality and morbidity and can significantly add to the costs of cancer care. Using the discharge database of the University Health System Consortium (UHC), researchers studied all adult cancer patients hospitalised with FN at 115 academic medical centres between 1995 and 2000 to determine the relationship between FN and length of hospital stay, hospital costs, and mortality.1 High mortality rates were observed in patients hospitalised for FN. Overall, of the 41,779 patients admitted to hospital for FN, in-patient mortality was 9.5%. The mortality rate was higher for patients with various co-morbidities. Patients with no co-morbidities had an in-patient mortality rate of 2.6%. The mortality rates in patients with one, two, three or four co-morbidities were 10.3%, 21.4%, 38.6% and 50.6%, respectively. Co-morbidities included congestive heart failure or other heart disease, lung disease, liver disease, renal disease, cerebrovascular disease, peripheral vascular disease, pulmonary embolism, deep venous thrombosis, anaemia and transfusion requirement. Reference 1Kuderer NM, Dale DC, Crawford J, et al. Mortality, morbidity and cost associated with febrile neutropenia in adult cancer patients. Cancer. 2006;106:2258–2266. 2.6 Overall No major One major >one major (n=41,779) comorbidity comorbidity comorbidity (n=21,386) (n=12,398) (n=7,995) *Data based on a single admission per patient Kuderer NM et al. Cancer 2006;106:2258–2266
 From ‘Optimal G-CSF administration in the management of chemotherapy- induced neutropenia’ slide deck [Note: subtitle changed from the original] This study shows that FN is associated with increased mortality and morbidity and can significantly add to the costs of cancer care. Using the discharge database of the University Health System Consortium (UHC), researchers studied all adult cancer patients hospitalised with FN at 115 academic medical centres between 1995 and 2000 to determine the relationship between FN and length of hospital stay, hospital costs, and mortality.1. High mortality rates were observed in patients hospitalised for FN. Overall, of the 41,779 patients admitted to hospital for FN, in-patient mortality was 9.5%. The mortality rate was higher for patients with various co-morbidities. Patients with no co-morbidities had an in-patient mortality rate of 2.6%. The mortality rates in patients with one, two, three or four co-morbidities were 10.3%, 21.4%, 38.6% and 50.6%, respectively. Co-morbidities included congestive heart failure or other heart disease, lung disease, liver disease, renal disease, cerebrovascular disease, peripheral vascular disease, pulmonary embolism, deep venous thrombosis, anaemia and transfusion requirement. Reference. 1Kuderer NM, Dale DC, Crawford J, et al. Mortality, morbidity and cost associated with febrile neutropenia in adult cancer patients. Cancer. 2006;106:2258– Overall No major One major >one major (n=41,779) comorbidity comorbidity comorbidity (n=21,386) (n=12,398) (n=7,995) *Data based on a single admission per patient. Kuderer NM et al. Cancer 2006;106:2258–2266.")
166
Clinical Consequences of Neutropenia and Febrile Neutropenia
Suboptimal chemotherapy reduces survival 1.0 +++ + 1.0 0.8 0.8 RDI 0.6 0.6 Cum Proportion Survival < 85% 85% < 85%, censored 85%, censored + Estimated Survival ARDI 0.4 0.4 >90% 0.2 + 0.2 86–≤90% + ≤85% 0.0 0.0 From ‘Optimal G-CSF administration in the management of chemotherapy-induced neutropenia’ slide deck [Note: Ref and graph from original replaced by updated ref and graph and notes for this added. Pettengell ref updated in notes] Chemotherapy dose delays and dose reductions result in a reduction in relative dose intensity (RDI), leading to suboptimal chemotherapy. A decreased RDI has a negative impact on patient survival. A retrospective study of 1,056 ESBC patients treated with adjuvant anthracycline non-taxane- based chemotherapy between 1980 and 2000, the 10-year event-free survival (EFS) and OS rates were significantly reduced in patients receiving 95% RDI compared with those receiving 95% RDI.1 In a study including 210 patients with diffuse large B-cell lymphoma treated with CHOP-21, those who received 90% RDI had significantly lower overall survival (OS) than those receiving >90% RDI (p=0.002).2 In a study of 289 NHL patients treated with CHOP-21, those patients who received 90% of the RDI had significantly lower overall survival (OS) than those receiving >90% RDI (p<0.001).3 References 1Chirivella I, Bermejo A, Insa A, et al. Impact of chemotherapy dose-related factors on survival in breast cancer patients treated with adjuvant anthracycline-based chemotherapy. J Clin Oncol 2006;24:Abstract 668. 2Bosly A, Bron D, Van Hoof A, et al. Achievement of optimal relative dose intensity and correlation with survival in diffuse large B-cell lymphoma patients treated with CHOP. Ann Hematol 2008;87: 3Pettengell R, Schwenkglenks M, Bosly A. Association of reduced relative dose intensity and survival in lymphoma patients receiving CHOP-21 chemotherapy. Ann Hematol 2008; epub ahead of print 2 4 6 8 10 1 2 3 4 5 6 7 8 Disease-Free Survival (years) Years Post Chemotherapy Reduced RDI resulted in lower OS in ESBC receiving anthracycline-containing chemotherapy1 Reduced RDI resulted in lower OS in patients with DLBCL receiving CHOP-21 chemotherapy2 OS, overall survival; ARDI, average relative dose intensity 1 Chirivella I, et al. Breast Cancer Res Treat 2009;114(3): 2 Bosly A, et al. Ann Hematol 2008; 87:277–283 166
, leading to suboptimal chemotherapy. A decreased RDI has a negative impact on patient survival. A retrospective study of 1,056 ESBC patients treated with adjuvant anthracycline non-taxane- based chemotherapy between 1980 and 2000, the 10-year event-free survival (EFS) and OS rates were significantly reduced in patients receiving 95% RDI compared with those receiving 95% RDI.1. In a study including 210 patients with diffuse large B-cell lymphoma treated with CHOP-21, those who received 90% RDI had significantly lower overall survival (OS) than those receiving >90% RDI (p=0.002).2. In a study of 289 NHL patients treated with CHOP-21, those patients who received 90% of the RDI had significantly lower overall survival (OS) than those receiving >90% RDI (p<0.001).3. References. 1Chirivella I, Bermejo A, Insa A, et al. Impact of chemotherapy dose-related factors on survival in breast cancer patients treated with adjuvant anthracycline-based chemotherapy. J Clin Oncol 2006;24:Abstract Bosly A, Bron D, Van Hoof A, et al. Achievement of optimal relative dose intensity and correlation with survival in diffuse large B-cell lymphoma patients treated with CHOP. Ann Hematol 2008;87: Pettengell R, Schwenkglenks M, Bosly A. Association of reduced relative dose intensity and survival in lymphoma patients receiving CHOP-21 chemotherapy. Ann Hematol 2008; epub ahead of print Disease-Free Survival (years) Years Post Chemotherapy. Reduced RDI resulted in lower OS in ESBC receiving anthracycline-containing chemotherapy1. Reduced RDI resulted in lower OS in patients with DLBCL receiving CHOP-21 chemotherapy2. OS, overall survival; ARDI, average relative dose intensity. 1 Chirivella I, et al. Breast Cancer Res Treat 2009;114(3): Bosly A, et al. Ann Hematol 2008; 87:277–")
167
Myelosuppression Predicts for Survival Benefit of Adjuvant Chemotherapy in Breast Cancer Patients
Mayers C, Tannock IF. Cancer 2001;91:2253 Lyman G. JNCCN 2009;7:99-108

168
Neutropenia as a Pharmacodynamic Endpoint of Clinical Benefit
Analysis of 4626 Hodgkin’s Lymphoma patients on German HDSG Trials Results Female Male P value G3/4 leukopenia 69.90 52.20 p<0.0001 FFTF at 66 months 81% 74% Hypothesis: The better outcome of female HL patients is due to greater systemic chemotherapy exposure. Klimm B. J Clin Oncol 2005;23:

169
Overall Survival by Grade of Chemotherapy-Induced Neutropenia for Advanced NSCLC Patients
104 0.8 0.6 0.4 0.2 91 78 65 52 39 26 13 1.0 Time From Landmark Day (Weeks) Probability of Survival No neutropenia Mild neutropenia Severe neutropenia Log-rank P= (stratified by treatment) Patients at Risk No neutropenia 208 150 102 68 43 29 20 13 10 Mild neutropenia 138 98 74 54 38 33 21 11 Severe neutropenia 90 69 50 28 14 8 4 Di Maio M et al. Lancet Oncol 2005;6:669
 Probability of Survival. No neutropenia. Mild neutropenia. Severe neutropenia. Log-rank P= (stratified by treatment) Patients at Risk. No neutropenia Mild neutropenia Severe neutropenia Di Maio M et al. Lancet Oncol 2005;6:669.")
170
Strategies For Management of Chemotherapy-Induced Neutropenia
Prevention Chemotherapy Dose reduction/delay Myeloid growth factors G-CSF (filgrastim, lenograstim) GM-CSF (sargramostim, molgramostim) Pegfilgrastim - Antibiotics Treatment Observation if afebrile Antibiotics Myeloid growth factors (limited benefit)
 GM-CSF (sargramostim, molgramostim) Pegfilgrastim. - Antibiotics. Treatment. Observation if afebrile. Antibiotics. Myeloid growth factors (limited benefit)")
171
95 randomized controlled trials, 1973-2004 (n=9283)
Meta-Analysis: Antibiotic Prophylaxis Reduces Mortality in Neutropenic Patients 95 randomized controlled trials, (n=9283) 79 studies were on inpatients with hematologic malignancies and/or PSCT 52 trials involved quinolone prophylaxis 7 trials included CSFs Gafter-Gvili, A. Ann Intern Med. 2005:142(12):
 79 studies were on inpatients with hematologic malignancies and/or PSCT. 52 trials involved quinolone prophylaxis. 7 trials included CSFs. Gafter-Gvili, A. Ann Intern Med. 2005:142(12):")
172
Meta-Analysis: Antibiotic Prophylaxis
Reduces Mortality in Neutropenic Patients Results of Prophylaxis with Fluoroquinolones Outcome Relative Risk (CI) Fever ( ) Documented Infection ( ) Infection Related Death ( ) All cause mortality ( ) Adverse Events ( ) Development of resistant bacteria ( ) Gafter-Gvili, A. Ann Intern Med. 2005:142(12):
 Fever .67 ( ) Documented Infection .50 ( ) Infection Related Death .38 ( ) All cause mortality .52 ( ) Adverse Events 1.30 ( ) Development of resistant bacteria 1.69 ( ) Gafter-Gvili, A. Ann Intern Med. 2005:142(12):")
173
Limitations of Prophylactic Antibiotics
Meta-Analysis: Antibiotic Prophylaxis Reduces Mortality in Neutropenic Patients Limitations of Prophylactic Antibiotics Insufficient number of outpatient solid tumor/chemotherapy patients to be applicable Not recommended by IDSA guidelines because of concerns regarding antibiotic resistance Routine application limited to high risk inpatients with hematologic malignancies/stem cell transplants Gafter-Gvili, A. Ann Intern Med. 2005:142(12):
:")
174
Role of Prophylactic Antibiotics in the Prevention of Infection after Chemotherapy
SIGNIFICANT Trial Solid tumor/lymphoma patients (n-1565) receiving standard dose multicycle chemotherapy Randomized to levofloxacin 500 mg qd x 7 day vs placebo Primary endpoint – reduction in febrile episodes attributed to infection SIGNIFICANT Trial. Cullen, et al. NEJM 2005; 353:
 receiving standard dose multicycle chemotherapy. Randomized to levofloxacin 500 mg qd x 7 day vs placebo. Primary endpoint – reduction in febrile episodes attributed to infection. SIGNIFICANT Trial. Cullen, et al. NEJM 2005; 353:")
175
Number Needed to Treat (CI)
Role of Prophylactic Antibiotics in the Prevention of Infection after Chemotherapy SIGNIFICANT Trial Outcome Levofloxacin Placebo RR Reduction (95% CI) Number Needed to Treat (CI) In first cycle Febrile episode 3.5 7.9 56 (32-72) 23 (15-46) Probable infection 14 19 28 (10-43) 19 (11-58) Hospitalization 6.7 10 36 (10-54) 28 (16-109) In any Cycle 11 15 29 (8.1-45) 23 (13-91) 34 41 18 (6.3-27) 14 (9-410 16 22 27 ( ) 18 (11-52) Severe Infection or Death 1 2 50 (-14 to 78) Not significant Values are percentages unless otherwise specified. Moon, S. et al. Supportive Cancer Therapy, (4):207-13
 Number Needed to Treat (CI) In first cycle. Febrile episode (32-72) 23 (15-46) Probable infection (10-43) 19 (11-58) Hospitalization (10-54) 28 (16-109) In any Cycle (8.1-45) 23 (13-91) (6.3-27) 14 ( ( ) 18 (11-52) Severe Infection or. Death (-14 to 78) Not significant. Values are percentages unless otherwise specified. Moon, S. et al. Supportive Cancer Therapy, (4):")
176
Primary Prophylaxis with MGFs Reduces Febrile Neutropenia
RR = 0.538 95% CI ( ) 46% reduction in risk of febrile neutropenia with primary prophylaxis Key Point: The risk reduction for febrile neutropenia was statistically significant at (95% CI ). This corresponds to a 46% reduction in the risk, or another way to think about it is you are 1.9 times more at risk (1/0.538) to experience febrile neutropenia with placebo/no treatment than with G-CSF. Background: The forest plot for febrile neutropenia is shown on the right. 15 of 17 trials reported FN as an endpoint. The boxes represent the individual risk reductions of the trials. The size of the box is related to the size of the study. The whiskers encompass the confidence interval for the risk reduction. The diamonds are the meta-analyzed risk reductions for either combined filgrastim, combined lenograstim or the single pegfilgrastim (alone not truly a meta-analysis) and the overall G-CSF effect. Kuderer, NM, et al. J Clin Oncol. 2007;25: Kuderer NM et al. J Clin Oncol. 2007;25:
 46% reduction in risk of febrile neutropenia with primary prophylaxis. Key Point: The risk reduction for febrile neutropenia was statistically significant at (95% CI ). This corresponds to a 46% reduction in the risk, or another way to think about it is you are 1.9 times more at risk (1/0.538) to experience febrile neutropenia with placebo/no treatment than with G-CSF. Background: The forest plot for febrile neutropenia is shown on the right. 15 of 17 trials reported FN as an endpoint. The boxes represent the individual risk reductions of the trials. The size of the box is related to the size of the study. The whiskers encompass the confidence interval for the risk reduction. The diamonds are the meta-analyzed risk reductions for either combined filgrastim, combined lenograstim or the single pegfilgrastim (alone not truly a meta-analysis) and the overall G-CSF effect. Kuderer, NM, et al. J Clin Oncol. 2007;25: Kuderer NM et al. J Clin Oncol. 2007;25:")
177
Primary Prophylaxis with MGFs Reduces Infection-related Mortality
RR = 0.552 95% CI ( ) 45% reduction in risk of infection-related mortality with primary prophylaxis Key Point: The risk reduction for infection-related mortality was statistically significant at (95% CI = ). This corresponds to a 45% reduction in the risk, or another way to think about it is you are 1.8 times more at risk (1/0.552) for infection-related mortality with placebo/no treatment than with G-CSF. Background: The forest plot for infection-related mortality is shown on the right. 12 of 17 trials reported this endpoint. The boxes represent the individual risk reductions of the trials. The size of the box is related to the size of the study. The whiskers encompass the confidence interval for the risk reduction. The diamonds are the meta-analyzed risk reductions for either combined filgrastim, combined lenograstim or the single pegfilgrastim (alone not truly a meta-analysis) and the overall G-CSF effect. Kuderer, NM, et al. J Clin Oncol. 2007;25: Kuderer NM et al. J Clin Oncol. 2007;25:
 45% reduction in risk of infection-related mortality with primary prophylaxis. Key Point: The risk reduction for infection-related mortality was statistically significant at (95% CI = ). This corresponds to a 45% reduction in the risk, or another way to think about it is you are 1.8 times more at risk (1/0.552) for infection-related mortality with placebo/no treatment than with G-CSF. Background: The forest plot for infection-related mortality is shown on the right. 12 of 17 trials reported this endpoint. The boxes represent the individual risk reductions of the trials. The size of the box is related to the size of the study. The whiskers encompass the confidence interval for the risk reduction. The diamonds are the meta-analyzed risk reductions for either combined filgrastim, combined lenograstim or the single pegfilgrastim (alone not truly a meta-analysis) and the overall G-CSF effect. Kuderer, NM, et al. J Clin Oncol. 2007;25: Kuderer NM et al. J Clin Oncol. 2007;25:")
178
Primary Prophylaxis with MGFs Reduces Early Mortality
RR = 0.599 95% CI ( ) 40% reduction in risk of early mortality with primary prophylaxis Key Point: The risk reduction for early mortality (mortality of any cause during chemotherapy treatment) was statistically significant at (95% CI ). This corresponds to a 40% reduction in the risk, or another way to think about it is you are 1.7 times more at risk (1/0.599) of early mortality with placebo/no treatment than with G-CSF. Background: The forest plot for early mortality is shown on the right. 13 of 17 trials reported this endpoint. The boxes represent the individual risk reductions of the trials. The size of the box is related to the size of the study. The whiskers encompass the confidence interval for the risk reduction. The diamonds are the meta-analyzed risk reductions for either combined filgrastim, combined lenograstim or the single pegfilgrastim (alone not truly a meta-analysis) and the overall G-CSF effect. Kuderer, NM, et al. J Clin Oncol. 2007;25: Kuderer NM et al. J Clin Oncol. 2007;25:
 40% reduction in risk of early mortality with primary prophylaxis. Key Point: The risk reduction for early mortality (mortality of any cause during chemotherapy treatment) was statistically significant at (95% CI ). This corresponds to a 40% reduction in the risk, or another way to think about it is you are 1.7 times more at risk (1/0.599) of early mortality with placebo/no treatment than with G-CSF. Background: The forest plot for early mortality is shown on the right. 13 of 17 trials reported this endpoint. The boxes represent the individual risk reductions of the trials. The size of the box is related to the size of the study. The whiskers encompass the confidence interval for the risk reduction. The diamonds are the meta-analyzed risk reductions for either combined filgrastim, combined lenograstim or the single pegfilgrastim (alone not truly a meta-analysis) and the overall G-CSF effect. Kuderer, NM, et al. J Clin Oncol. 2007;25: Kuderer NM et al. J Clin Oncol. 2007;25:")
179
What impact does pegfilgrastim have on early, all-cause mortality in patients receiving chemotherapy? Design Community-based, prospective observational study Inclusion criteria Eligibility was not restricted on the basis of older age or major co-morbidities; 3 month life expectancy and 4 cycles chemotherapy planned Patient population 4,458 consecutive adult patients initiating chemotherapy at 115 U.S. practice sites From ‘Refresher: best practice in neutropenia management deck’ – von ESMO? [Note: streamlined text here as requested by JH] Design This was a systematic review and meta-analysis of randomised controlled trials (RCTs) comparing primary prophylactic G-CSF (filgrastim, pegfilgrastim or lenograstim) with placebo or untreated controls. Inclusion criteria Initiation of G-CSF 1 to 3 days after the completion of chemotherapy in each cycle and G-CSF must have been administered continuously until neutrophil recovery. G-CSF primary prophylaxis was defined as G-CSF administration in the first cycle of chemotherapy before the onset of neutropenia. Studies in which control patients received G-CSF prophylaxis after the first cycle were permitted and this was defined as secondary prophylaxis (G-CSF started in the chemotherapy cycle after the first episode of FN). Studies in which patients received prophylactic antibiotics were included as long as this was permitted equally in both study arms. Patient population Seventeen RCTs including 3,493 patients met criteria for this meta-analysis; 11 (65%) RCTs investigated solid tumour patients and 6 (35%) investigated non-Hodgkin lymphoma (NHL) patients. 10 studies used filgrastim (59%), 6 used lenograstim (35%) and 1 used pegfilgrastim (6%). Endpoints The primary outcome of this analysis was the proportion of patients with FN. Secondary outcomes (reported in at least half of the selected studies) included infection-related mortality, all early mortality, relative dose intensity (RDI) and bone or musculoskeletal pain. Reference Kuderer NM, Dale DC, Crawford J, et al. Impact of primary prophylaxis with granulocyte colony-stimulating factor on febrile neutropenia in adult cancer patients receiving chemotherapy: a systematic review. J Clin Oncol 2007;25: Endpoints Time to febrile neutropenia, progression-free and overall survival Lyman GH, et al. J Clin Oncol 2008; May 20 suppl:6552
 comparing primary prophylactic G-CSF (filgrastim, pegfilgrastim or lenograstim) with placebo or untreated controls. Inclusion criteria. Initiation of G-CSF 1 to 3 days after the completion of chemotherapy in each cycle and G-CSF must have been administered continuously until neutrophil recovery. G-CSF primary prophylaxis was defined as G-CSF administration in the first cycle of chemotherapy before the onset of neutropenia. Studies in which control patients received G-CSF prophylaxis after the first cycle were permitted and this was defined as secondary prophylaxis (G-CSF started in the chemotherapy cycle after the first episode of FN). Studies in which patients received prophylactic antibiotics were included as long as this was permitted equally in both study arms. Patient population. Seventeen RCTs including 3,493 patients met criteria for this meta-analysis; 11 (65%) RCTs investigated solid tumour patients and 6 (35%) investigated non-Hodgkin lymphoma (NHL) patients. 10 studies used filgrastim (59%), 6 used lenograstim (35%) and 1 used pegfilgrastim (6%). Endpoints. The primary outcome of this analysis was the proportion of patients with FN. Secondary outcomes (reported in at least half of the selected studies) included infection-related mortality, all early mortality, relative dose intensity (RDI) and bone or musculoskeletal pain. Reference. Kuderer NM, Dale DC, Crawford J, et al. Impact of primary prophylaxis with granulocyte colony-stimulating factor on febrile neutropenia in adult cancer patients receiving chemotherapy: a systematic review. J Clin Oncol 2007;25: Endpoints. Time to febrile neutropenia, progression-free and overall survival. Lyman GH, et al. J Clin Oncol 2008; May 20 suppl:6552.")
180
Pegfilgrastim Primary Prophylaxis Demonstrates Significant Impact on Early Overall and Progression-free Survival Pegfilgrastim Primary Prophylaxis 1.00 1.00 Pegfilgrastim Primary Prophylaxis 0.95 No Pegfilgrastim Prophylaxis 0.95 0.90 0.90 Survival No Pegfilgrastim Prophylaxis Progression Free Survival 0.85 0.85 Hazard Ratio = [0.210,0.211] P = 0.010 Hazard Ratio = [0.453,0.923] P = 0.015 From ‘Refresher: best practice in neutropenia management deck’ – von ESMO? 0.80 0.80 0.75 0.75 10 20 30 40 50 60 70 80 90 10 20 30 40 50 60 70 80 90 Time (Days) Time (Days) Lyman GH, et al. J Clin Oncol 2008; May 20 suppl:6552
 Time (Days) Lyman GH, et al. J Clin Oncol 2008; May 20 suppl:6552.")
181
Impact of Pegfilgrastim on Overall and Disease Free Survival was Apparent in Major Prognostic Subgroups Hazard Ratio = [0.133,0.723] P = 0.007 Planned RDI ≥ 85% N = 2,623 Pegfilgrastim No Pegfilgrastim A 10 20 30 40 50 60 70 80 90 0.75 0.80 0.85 0.90 0.95 1.00 Survival Time (Days) B Hazard Ratio = [0.125,0.954] P = 0.040 Pegfilgrastim No Pegfilgrastim Lung Cancer N = 907 10 20 30 40 50 60 70 80 90 0.75 0.80 0.85 0.90 0.95 1.00 Survival Time (Days) C Pegfilgrastim No Pegfilgrastim Hazard Ratio = [0.192,0.761] P = 0.006 ECOG ≥ 1 N = 2,024 10 20 30 40 50 60 70 80 90 0.75 0.80 0.85 0.90 0.95 1.00 Survival Time (Days) D Hazard Ratio = [0.110,0.684] P = 0.006 Liver Dysfunction N = 1,045 Pegfilgrastim No Pegfilgrastim 10 20 30 40 50 60 70 80 90 0.75 0.80 0.85 0.90 0.95 1.00 Survival Time (Days) From ‘Refresher: best practice in neutropenia management deck’ Lyman GH, et al. J Clin Oncol 2008; May 20 suppl:6552
 B. Hazard Ratio = [0.125,0.954] P = Pegfilgrastim. No Pegfilgrastim. Lung Cancer N = Survival. Time (Days) C. Pegfilgrastim. No Pegfilgrastim. Hazard Ratio = [0.192,0.761] P = ECOG ≥ 1 N = 2, Survival. Time (Days) D. Hazard Ratio = [0.110,0.684] P = Liver Dysfunction N = 1,045. Pegfilgrastim. No Pegfilgrastim Survival. Time (Days) From ‘Refresher: best practice in neutropenia management deck’ Lyman GH, et al. J Clin Oncol 2008; May 20 suppl:6552.")
182
Risk of Mortality in Patients with Cancer Experiencing Febrile Neutropenia
Kaplan-Meier Survival Curve for Early Mortality 1.00 0.99 0.98 0.97 0.96 0.95 Survival Log rank test: Chi2(1)=4.79, p=0.0287 Length of Follow-up in Months Non febrile neutropenia patients Febrile neutropenia patients Barron, R. Abstract 9561, ASCO 2009
=4.79, p= Length of Follow-up in Months. Non febrile neutropenia patients. Febrile neutropenia patients. Barron, R. Abstract 9561, ASCO")
183
Risk of Mortality in Patients with Cancer Experiencing Febrile Neutropenia
Kaplan-Meier Survival Curve for Overall Mortality 1.00 0.95 0.90 0.85 0.80 0.75 Log rank test: Chi2(1)=23.15, p<0.0001 Survival Length of Follow-up in Months Non febrile neutropenia patients Febrile neutropenia patients Barron, R. Abstract 9561, ASCO 2009
=23.15, p< Survival Length of Follow-up in Months. Non febrile neutropenia patients. Febrile neutropenia patients. Barron, R. Abstract 9561, ASCO")
184
Guidelines at a Glance: Primary Prophylactic CSF Administration
Neutropenic Event Risk EORTC 2006 ASCO NCCN 2007 Moderate to High Use CSF ≥ 20% Use CSF ~ 20% Use CSF > 20% Intermediate Consider CSF % with risk factors Recommend < 20% (with risk factors) Low CSF is not recommended < 10% Not specified CSF is not recommended for most patients < 10% Risk Factor Assessment +++ ++ Key Point All three guidelines recommend prophylactic CSF administration are based on the risk threshold for febrile neutropenia (FN risk of 20% or greater).1-4 All three also recommend considering CSF treatment for treatment regimens in the 10-20% FN range based on individual patient risk factors. The clinical recommendations of ASCO, NCCN, and EORTC are compared. Clinical recommendations for primary prophylactic CSF administration based on the risk threshold for febrile neutropenia or neutropenic events are in alignment for the three guidelines. Prophylatic CSF administration is indicated in patients with a FN or neutropenic events risk of 20% or greater. If FN events risk is %, assessment of patient risk factors may increase FN risk. All three guidelines recommend CSFs under special circumstances, even when the chemotherapy of FN risk is < 20%. Thus, patients should be routinely assessed to determine the need for CSFs based on: Clinical factors of FN risk If patient is hospitalized or is on IV antibiotics If dose-dependent or dose-intense chemotherapy regimens have survival benefits. Smith TJ, Khatcheressian J, Lyman GH, et al Update of Recommendations for the Use of White Blood Cell Growth Factors: An Evidence-Based Clinical Practice Guideline. J Clin Oncol. 2006;24(19): National Comprehensive Cancer Network. Clinical Practice Guidelines in Oncology: Myeloid Growth Factors. v Available at: Accessed May 23, 2007. Aapro MS, Cameron DA, Pettengell R, et al. EORTC Guidelines for the Use of Granulocyte-Colony Stimulating Factor to Reduce the Incidence of Chemotherapy-Induce Febrile Neutropenia in Adult Patients with Lymphomas and Solid Tumors. European J Cancer 2006;42: NCCN Clinical Practice Guidelines in Oncology: Myeloid Growth Factors. v Available at: accessed May 23, 2007 Smith TJ, et al. J Clin Oncol. 2006;24(19): Aapro MS, et al. European J Cancer. 2006;42: 184
 Low. CSF is not recommended < 10% Not specified. CSF is not recommended for most patients < 10% Risk Factor Assessment Key Point. All three guidelines recommend prophylactic CSF administration are based on the risk threshold for febrile neutropenia (FN risk of 20% or greater).1-4 All three also recommend considering CSF treatment for treatment regimens in the 10-20% FN range based on individual patient risk factors. The clinical recommendations of ASCO, NCCN, and EORTC are compared. Clinical recommendations for primary prophylactic CSF administration based on the risk threshold for febrile neutropenia or neutropenic events are in alignment for the three guidelines. Prophylatic CSF administration is indicated in patients with a FN or neutropenic events risk of 20% or greater. If FN events risk is %, assessment of patient risk factors may increase FN risk. All three guidelines recommend CSFs under special circumstances, even when the chemotherapy of FN risk is < 20%. Thus, patients should be routinely assessed to determine the need for CSFs based on: Clinical factors of FN risk. If patient is hospitalized or is on IV antibiotics. If dose-dependent or dose-intense chemotherapy regimens have survival benefits. Smith TJ, Khatcheressian J, Lyman GH, et al Update of Recommendations for the Use of White Blood Cell Growth Factors: An Evidence-Based Clinical Practice Guideline. J Clin Oncol. 2006;24(19): National Comprehensive Cancer Network. Clinical Practice Guidelines in Oncology: Myeloid Growth Factors. v Available at: Accessed May 23, Aapro MS, Cameron DA, Pettengell R, et al. EORTC Guidelines for the Use of Granulocyte-Colony Stimulating Factor to Reduce the Incidence of Chemotherapy-Induce Febrile Neutropenia in Adult Patients with Lymphomas and Solid Tumors. European J Cancer 2006;42: NCCN Clinical Practice Guidelines in Oncology: Myeloid Growth Factors. v Available at: accessed May 23, Smith TJ, et al. J Clin Oncol. 2006;24(19): Aapro MS, et al. European J Cancer. 2006;42:")
185
NCCN Practice Guidelines in Oncology v.1.2010 Myeloid Growth Factors
Patient Risk Factors for Developing Febrile Neutropenia In addition to the risk of the chemotherapy regimen and the specific malignancy being treated, these factors need to be considered when evaluating a patient’s overall risk for febrile neutropenia. Older patient, notably patients age 65 and older (see NCCN Senior Adult Oncology Guidelines) Previous chemotherapy or radiation therapy Pre-existing neutropenia or bone marrow involvment with tumor Pre-existing conditions Neutropenia Infection/open wounds Recent surgery Poor performance status Poor renal function Liver dysfunction, most notably elevated bilirubin
 Previous chemotherapy or radiation therapy. Pre-existing neutropenia or bone marrow involvment with tumor. Pre-existing conditions. Neutropenia. Infection/open wounds. Recent surgery. Poor performance status. Poor renal function. Liver dysfunction, most notably elevated bilirubin.")
188
Adverse Events Associated with Myeloid Growth Factors
Filgrastim/Pegfilgrastim Common Bone/musculoskeletal pain (25-50%) Less Common Splenomegaly (3%) Headache, nausea Fever (1%) Rare Allergic reaction Sweet’s syndrome Controversial Acute myeloid leukemia – epidemiologic association, but not confirmed in randomized prospective trials Myeloid Growth Factor Guidelines v ,
 Less Common. Splenomegaly (3%) Headache, nausea. Fever (1%) Rare. Allergic reaction. Sweet’s syndrome. Controversial. Acute myeloid leukemia – epidemiologic association, but not confirmed in randomized prospective trials. Myeloid Growth Factor Guidelines v ,")
189
Relative Risk for AML/MDS by Cancer Type
Acute Myeloid Leukemia or Myelodysplastic Syndrome and Overall Mortality with Chemotherapy and Granulocyte Colony-Stimulating Factor Meta-Analysis of Randomized Controlled Trials Relative Risk for AML/MDS by Cancer Type Lyman, G. ASCO Abstract 9524, 2009

190
AML/MDS by Planned CT Regimen Category
Acute Myeloid Leukemia or Myelodysplastic Syndrome and Overall Mortality with Chemotherapy and Granulocyte Colony-Stimulating Factor Meta-Analysis of Randomized Controlled Trials AML/MDS by Planned CT Regimen Category Lyman, G. ASCO Abstract 9524, 2009

191
All-Cause Mortality by Tumor Type
Acute Myeloid Leukemia or Myelodysplastic Syndrome and Overall Mortality with Chemotherapy and Granulocyte Colony-Stimulating Factor Meta-Analysis of Randomized Controlled Trials All-Cause Mortality by Tumor Type Lyman, G. ASCO Abstract 9524, 2009

192
All-Cause Mortality by Regimen Category
Acute Myeloid Leukemia or Myelodysplastic Syndrome and Overall Mortality with Chemotherapy and Granulocyte Colony-Stimulating Factor Meta-Analysis of Randomized Controlled Trials All-Cause Mortality by Regimen Category Lyman, G. ASCO Abstract 9524, 2009

193
Neutropenia / Management Summary
Neutropenia is the major risk factor for fever and infection, as well as reduced chemotherapy dose delivery; both of which can be associated with reduced survival of the cancer patient. In patients at significant risk of febrile neutropenia (>20%) prophylactic CSFs are warranted in the first and all subsequent cycles of chemotherapy. Prophylactic antibiotics may add to the benefit of CSFs in selected settings, but cannot replace them. Further prospective studies evaluating chemotherapy RDI and outcomes in cancer patients are needed.
 prophylactic CSFs are warranted in the first and all subsequent cycles of chemotherapy. Prophylactic antibiotics may add to the benefit of CSFs in selected settings, but cannot replace them. Further prospective studies evaluating chemotherapy RDI and outcomes in cancer patients are needed.")
Similar presentations


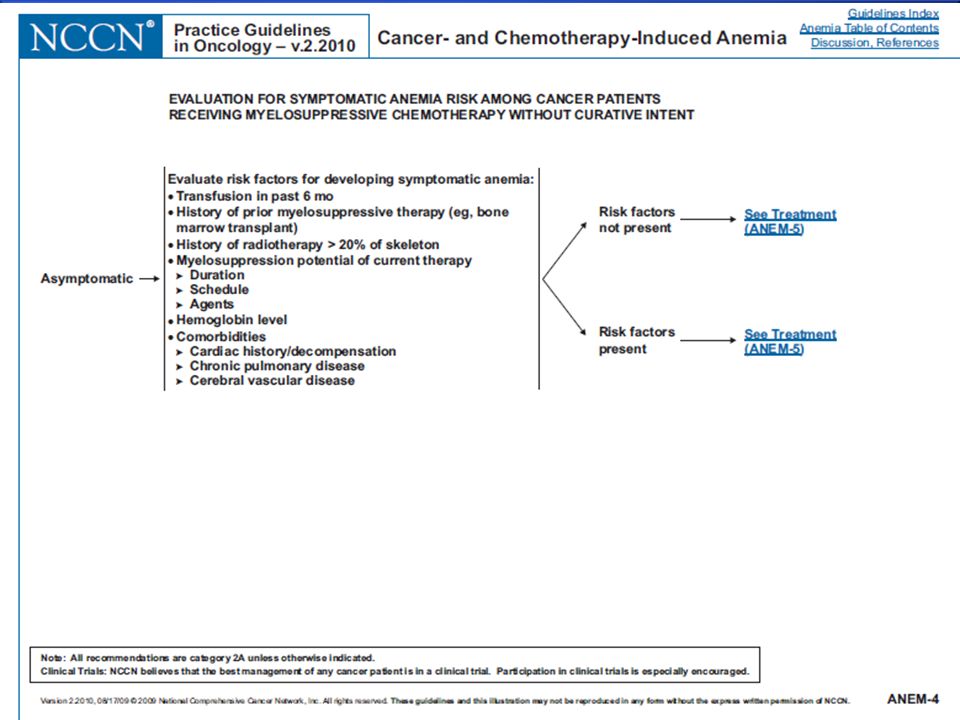


 patients Policy.>")


