Download presentation
Presentation is loading. Please wait.

1
Healthcare Engineering: Quantitative Decision Support Models for the Healthcare Industry
Lot’s of O.R. in health care! My bib around 6000 papers just on OR applications to health care My purpose: to encourage quantitative academics to work in health care ... -and to encourage health care industry to utilize OR OR in healthcare is growing Michael W. Carter Centre for Research in Healthcare Operations Mechanical and Industrial Engineering University of Toronto

2
Outline Brief Overview of the Health Care Industry
Why do we need engineers? Some application examples No assumption about the audience (academic? Healthcare? General public?) I will assume that you don’t know much about health care - interested in applications
 I will assume that you don’t know much about health care. - interested in applications.")
3
The Importance of Health Care
Health care is North America’s largest single industry. Estimated total spending in Canada was $183 billion (CN) in ($2.5 trillion in the US) In Canada, in 2009, $5,452 per person was spent on health care compared to $8,047 in US
 in ($2.5 trillion in the US) In Canada, in 2009, $5,452 per person was spent on health care compared to $8,047 in US.")
4
International Trends Centers for Medicare & Medicaid Services is predicting 17.7% by 2012 Before 1971, Canadian & US systems were the same Note the sharp increase in expense in past three years OECD web site: Oct 2007

6
Unfair Comparison: More $ doesn’t = better health?

8
Health Care Delivery (% Public Payor in 2007)
")
9
Commonwealth Fund Overall Ranking 2007
AUST. CAN. GER N.Z. U.K. U.S. OVERALL RANKING (2007) 3.5 5 2 1 6 Quality Care 4 2.5 Right Care 3 Safe Care Coordinated Care Patient-Centered Care Access Efficiency Equity Long, Healthy, and Productive Lives 4.5 Health Expenditures per Capita, 2004 $2,876* $3,165 $3,005* $2,083 $2,546 $6,102 * 2003 data Source: Calculated by Commonwealth Fund based on the Commonwealth Fund 2004 International Health Policy Survey, the Commonwealth Fund 2005 International Health Policy Survey of Sicker Adults, the 2006 Commonwealth Fund International Health Policy Survey of Primary Care Physicians, and the Commonwealth Fund Commission on a High Performance Health System National Scorecard.
 Quality Care Right Care. 3. Safe Care. Coordinated Care. Patient-Centered Care. Access. Efficiency. Equity. Long, Healthy, and Productive Lives Health Expenditures per Capita, $2,876* $3,165. $3,005* $2,083. $2,546. $6,102. * 2003 data. Source: Calculated by Commonwealth Fund based on the Commonwealth Fund 2004 International Health Policy Survey, the Commonwealth Fund 2005 International Health Policy Survey of Sicker Adults, the 2006 Commonwealth Fund International Health Policy Survey of Primary Care Physicians, and the Commonwealth Fund Commission on a High Performance Health System National Scorecard.")
10
Systemic Hospital Issues: The Four Faces of Health Care*
Containment Coalition Health care is a business, but... Multiple decision makers. Conflicting goals, incentives. Social “good”. No market, no manager. Trustees Community Managers Control Insider Coalition Status Coalition Doctors Cure Nursing Care Key issue in healthcare - Implementation of any project will only occur if all stakeholders win! Clinical Coalition *Glouberman & Mintzberg, 2001

11
The Four Faces of Health Care*
The same divisions apply to the overall social health system! Health Authorities Insurance Public Control Elected Officials Community Involvement Acute Hospital Acute Cure LTC, Primary Community Care *Glouberman & Mintzberg, 2001

12
Some success stories Ontario Waitlist Forecast
System Dynamics: Cardiac Surgeons Ministry of Health and Long Term Care and the Local Health Integration Networks (LHINs) Cancer Care Ontario: Chemo Therapy Centres Surgical Planning: Orthopaedic
 Cancer Care Ontario: Chemo Therapy Centres. Surgical Planning: Orthopaedic.")
13
Ontario Waitlist Initiative
Target to reduce wait times to benchmarks for five priority areas: Cardiac, Cataract, Cancer, Hip & Knee Replacement, MRI/CT Problem: How many (cataracts) do we need to do to meet bench mark (90% wait less than 26 weeks) by March 2007?
 do we need to do to meet bench mark (90% wait less than 26 weeks) by March 2007")
14
Data Requirements for Prediction
Current Patient Arrival Rate Projected Future Arrival Rate Current Waitlist Distribution of Patients on Waitlist (Priority) Surgical Volumes (Service Rates) Future Funded Surgical Volumes If you gave me all of these values, I could tell you how long the wait list will be in the future In fact, I don’t know any of these numbers. We even had problems getting precise values for funded surgical volumes (I will elaborate later) In our model, we estimated all of these from
 Surgical Volumes (Service Rates) Future Funded Surgical Volumes. If you gave me all of these values, I could tell you how long the wait list will be in the future. In fact, I don’t know any of these numbers. We even had problems getting precise values for funded surgical volumes (I will elaborate later) In our model, we estimated all of these from.")
15
Observed Waitlist Approximation
Cutoff Point Used an algorithm developed by ICES. (Access Atlas) Using OHIP (01.IV.2001 to 30.XI.2005) and CIHI (01.IV.2001 to 31.III.2005) created datasets that tracked daily identified arrivals, waitlists, surgeries performed. Gave us the arrival rate (using the average of the mean arrival rate) - Also gave us the wait times. For every patient, we know how long they waited (in days) and we know the number of surgeries that were performed between the decision to treat and the surgery. Therefore, we can assume that those people were, on average, ahead of this patient on the wait list. Average wait list was around people. Assumed 34,133 in June 04. The 90th percentile waited for over 100,000 surgeries or over 1 year. Cutoff … Sept 04. Pretty sure almost everyone on list is finished
 Using OHIP (01.IV.2001 to 30.XI.2005) and CIHI (01.IV.2001 to 31.III.2005) created datasets that tracked daily identified arrivals, waitlists, surgeries performed. Gave us the arrival rate (using the average of the mean arrival rate) - Also gave us the wait times. For every patient, we know how long they waited (in days) and we know the number of surgeries that were performed between the decision to treat and the surgery. Therefore, we can assume that those people were, on average, ahead of this patient on the wait list. Average wait list was around people. Assumed 34,133 in June 04. The 90th percentile waited for over 100,000 surgeries or over 1 year. Cutoff … Sept 04. Pretty sure almost everyone on list is finished.")
16
In order to estimate the shape of the distribution, we observed that the 90th percentile was consistently around 2.3 times the mean (each week) Varied between 2.1 – 2.5) Therefore, if we want the 90th percentile under 26 weeks, we need the mean under 11 weeks!

17
Average monthly pt arrivals (blue)
Notice seasonal patterns …dip in summer, Christmas and end of fiscal year (white bars) Yellow – Our forecast model … takes seasonal variation and annual trends into account Orange – Many patients get both eyes done (one pt., two surgeries) – plus we could not compute a decision date for all pts. Inflated our forecast by 28.7% to get forecast surgery demand rate.
 Yellow – Our forecast model … takes seasonal variation and annual trends into account. Orange – Many patients get both eyes done (one pt., two surgeries) – plus we could not compute a decision date for all pts. Inflated our forecast by 28.7% to get forecast surgery demand rate.")
18
Recent Ontario Performance
Oct./Nov./Dec (all priorities) Hips – 23 weeks (Ont. target 90% in 26 weeks) Knees – 26 weeks (target 26) Cataracts – 16 weeks (target 26) Breast cancer – 5 weeks (target 12) Colorectal cancer – 6 weeks (target 12) Cardiac Bypass – 8 weeks (target 26) MRI – 16.6 weeks (target 4) CT – 7 weeks (target 4) The aggressive cataract model recommended funding an additional 5400 cataract procedures by March 2007, while the conservative model recommended no additional surgeries total knee replacements and 1000 total hip replacements were recommended to be additionally funded before March 31, On September , the McGuinty government announced additional funding to improve access to five key healthcare services as part of its wait times strategy. Among them, 6,100 more cataract surgeries and a combined total of 3,008 more hip and knee joint replacements were announced. By March 31, 2007, wait times were markedly improved from the previous six months (182 days). Cataract surgeries had 90% wait times within 156 days, Hips within 244 days, and Knees within 326 days. Although the number of funded cases was based in part on CRHE’s forecast, the Ministry’s funding announcement was tempered by available capacity, human resources and time constraints. Hospitals were awarded additional funding for surgeries, if they were on target to meet base surgical volumes for the year, and had available capacity. Hospitals were required to maintain current volumes of other surgeries. Not all additional surgeries were carried out. Many hospitals found that they could not meet the target volumes do to resource or personnel constraints. However, a review of the number of actual surgeries performed, arrivals and wait list observations reveals that if the model recommendations had been followed, the 90th percentile wait times for Cataracts would have been 131 days, for Hips days and for Knees days.
 Hips – 23 weeks (Ont. target 90% in 26 weeks) Knees – 26 weeks (target 26) Cataracts – 16 weeks (target 26) Breast cancer – 5 weeks (target 12) Colorectal cancer – 6 weeks (target 12) Cardiac Bypass – 8 weeks (target 26) MRI – 16.6 weeks (target 4) CT – 7 weeks (target 4) The aggressive cataract model recommended funding an additional 5400 cataract procedures by March 2007, while the conservative model recommended no additional surgeries total knee replacements and 1000 total hip replacements were recommended to be additionally funded before March 31, On September , the McGuinty government announced additional funding to improve access to five key healthcare services as part of its wait times strategy. Among them, 6,100 more cataract surgeries and a combined total of 3,008 more hip and knee joint replacements were announced. By March 31, 2007, wait times were markedly improved from the previous six months (182 days). Cataract surgeries had 90% wait times within 156 days, Hips within 244 days, and Knees within 326 days. Although the number of funded cases was based in part on CRHE’s forecast, the Ministry’s funding announcement was tempered by available capacity, human resources and time constraints. Hospitals were awarded additional funding for surgeries, if they were on target to meet base surgical volumes for the year, and had available capacity. Hospitals were required to maintain current volumes of other surgeries. Not all additional surgeries were carried out. Many hospitals found that they could not meet the target volumes do to resource or personnel constraints. However, a review of the number of actual surgeries performed, arrivals and wait list observations reveals that if the model recommendations had been followed, the 90th percentile wait times for Cataracts would have been 131 days, for Hips days and for Knees days.")
19
Health Human Resources Modelling

20
Modeling the Future of Canadian Cardiac Surgery Workforce Using System Dynamics
Michael Carter1,Chris Feindel2,Timothy Latham2 & Sonia Vanderby1 1Centre for Research in Healthcare Engineering, University of Toronto 2Canadian Society of Cardiac Surgeons

21
In Canada only 5 out of 11 slots were filled in 2009 match

22
But . . . Retiring Surgeon Population Demand patterns … CABG Non-CABG

23
Population is aging …

24
Study Motivation Will there be a future shortage of surgeons?
Specialty selection decisions being made based on current situation Current oversupply; unemployed grads Education Process > 10 years

25
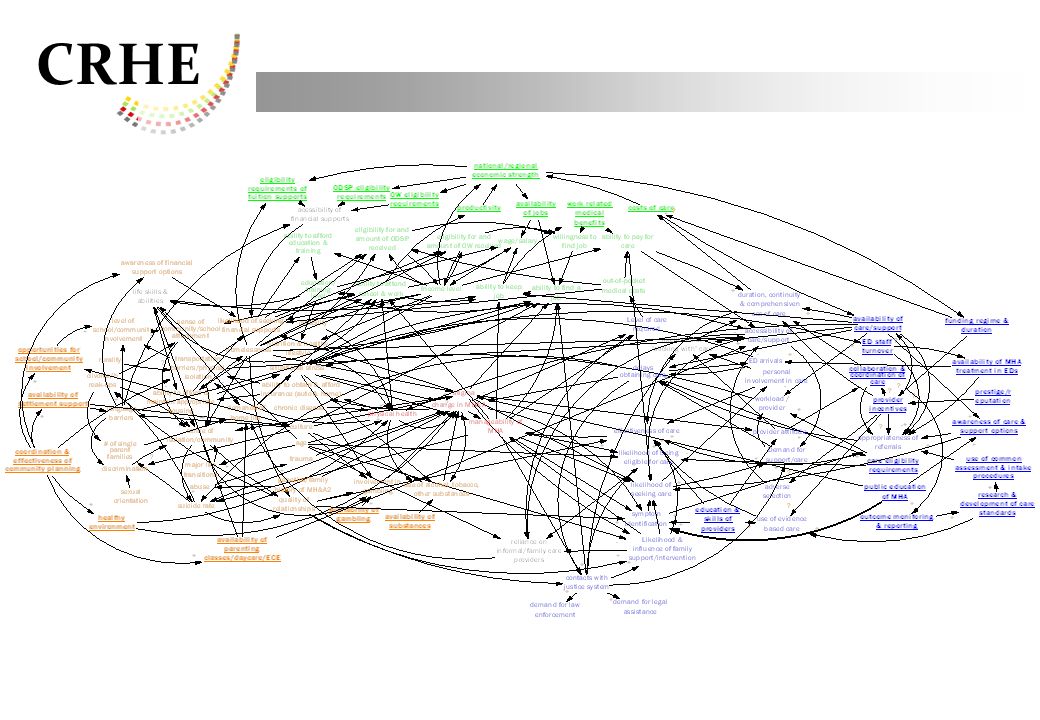
Causal Loop (Influence) Diagram
CSCS model also includes feedback Demand-Supply gap to productivity

26
Scenario Testing Initial increase in unemployed pool (grads) –currently in the “pipeline” Reduces enrolment Unemployed gradually hired, few new grads, surgeon shortage rapidly increases

27
Other System Dynamics Projects
Alberta Health & Wellness Model for demand for GPs for next ten years Ontario MOHLTC Model impact of “Aging at Home” strategy Model of mental health strategies May 20, 2009 Operations Research & Patient Flow

29
Local Health Integration Networks (LHINs)
Planning Tools for “Aging at Home” GIS models of Supply & Demand Ali Esensoy, Agnita Pal & Mike Carter

30
Demand Estimation

31
Estimated Adult Day Program Demand in TC LHIN

32
Adult Day Program Supply in TC LHIN

33
Cluster Analysis of ADP Gap in TC LHIN

34
Cancer Care Ontario How many medical oncologists do we need in Ontario? Graham Woodward, Adriane Castellino, Matt Nelson & Mike Carter

35
HHR Model How are teams of providers configured in chemo clinics?
How are responsibilities/tasks distributed among providers? (i.e., Who does what?) Focus on functions that could be performed by more than one type of provider Are there differences among sites? Best practice
 Focus on functions that could be performed by more than one type of provider. Are there differences among sites Best practice.")
36
I believe you are familiar with this process diagram
Our intention is to expand on this … finer granularity … who does what? Some functions are specific to scope of practice for certain professionals. Other tasks could be carried out by more than one type of person.

37
Data Collection Each centre has different people doing the tasks.
Need rough estimate of time required for each task by type of patient (expert opinion) Only trying to get a high level sense of who does what to answer questions like: “How many Medical Oncologists do we need at this centre?” Times may be different by centre and by provider type
 Only trying to get a high level sense of who does what to answer questions like: How many Medical Oncologists do we need at this centre Times may be different by centre and by provider type.")
38
Integer Programming Models
Given current volume and mix of patients, determine “ideal” provider configuration. Given current set of providers, how many patients can be treated? (% of current volume) How many providers are needed under different models of care? How do sites compare to each other in terms of resource use? (Best Practice.) Models of care: e.g., (Grand River makes use of nurse practitioners?)
 How many providers are needed under different models of care How do sites compare to each other in terms of resource use (Best Practice.) Models of care: e.g., (Grand River makes use of nurse practitioners )")
39
Surgical Planning & Scheduling
Sherry Weaver, Daphne Sniekers, Dionne Aleman, Solmaz Azari-Rad, Carolyn Busby & Mike Carter

40
Several current projects
Western Canada Wait List: Orthopaedic surgery Alberta Bone & Joint Health Institute: Calgary, Edmonton, Winnipeg Bone & Joint Canada General Perioperative Simulation Hamilton, UHN, St. Mike’s, Mt. Sinai, William Osler (Brampton Civic & Etobicoke General) Sunnybrook Health Sciences Urgent Ortho & Smoothing Resource Use
 Sunnybrook Health Sciences. Urgent Ortho & Smoothing Resource Use.")
41
Conclusions Health Care is major industry
The current system is not sustainable Quantitative methods (Operational Research) can help The health care industry is beginning to recognize the value of systems thinking
 can help. The health care industry is beginning to recognize the value of systems thinking.")
42
Opportunities for Operations Research?
Watch your newspaper: Patient flow → Supply Chain ED Wait times → Queueing/Simulation Surgical Wait Lists → Better scheduling Infectious Diseases → Logistics, Modelling Health Human Resources → Forecasting

Similar presentations