Download presentation
Presentation is loading. Please wait.

1
University of Pennsylvania
HDL: Still a target for therapy? PaACC Annual Chapter Meeting November 2, 2008 Daniel J. Rader, MD University of Pennsylvania School of Medicine

2
Lipoproteins and Atherosclerosis Oxidation, modification, aggregation
CE B Chol Chol Arterial macrophage LDL

3
LDL goals keep going down
Moderately High Risk ≥2 risk factors (10-yr risk 10–20%) High Risk CHD or CHD risk equivalents (10-yr risk >20%) Moderate Risk ≥2 risk factors (10-yr risk <10%) Lower Risk <2 risk factors 190 - goal 160 mg/dL 160 - goal 130 mg/dL goal 130 mg/dL LDL-C level 130 - goal 100 mg/dL 100 mg/dL* Based on recent clinical trial evidence, an NCEP report1 has been published recommending tighter control of cholesterol management. The trials support an LDL-C goal of <100 mg/dL in high-risk patients, and the inclusion of diabetes in the high-risk category. All patients with CHD or CHD risk equivalents are at high-risk. Therapeutic lifestyle changes (TLC) remain an essential part of clinical management. In patients at high risk (CHD and CHD risk equivalents, 10-year risk >20%), the recommended LDL-C goal is <100 mg/dL, but when risk is very high, an LDL-C goal of <70 mg/dL (1.8 mmol/dL) is a proposed therapeutic option. Patients at very high risk are those with established CVD plus: multiple major risk factors (especially diabetes); severe and poorly controlled risk factors (especially continued cigarette smoking); multiple risk factors of the metabolic syndrome and patients with acute coronary syndrome. The recommended point at which TLC should be initiated is an LDL-C level of 100 mg/dL (2.6 mmol/L). The guidelines recommend that drug therapy be considered in this category simultaneously with TLC in persons whose LDL-C levels are 100 mg/dL (2.6 mmol/L). In patients at moderately high risk (2 risk factors and 10-year CHD risk of 10–20%) the guidelines recommend that TLC are initiated at LDL-C levels of 130 mg/dL (3.4 mmol/L), with the aim of <130 mg/dL (3.4 mmol/L), but an LDL-C goal of <100 mg/dL (2.6 mmol/L) is a therapeutic option based on clinical trial evidence. This also applies to patients with a baseline LDL-C of mg/dL. Drug therapy should be considered if LDL-C levels remain 130 mg/dL (3.4 mmol/L), after 3 months of TLC. In patients at moderate risk (2 risk factors and 10-year CHD risk of <10%) the guidelines recommend that TLC are initiated at LDL-C levels of 130 mg/dL (3.4 mmol/L), with the aim of <130 mg/dL (3.4 mmol/L). In this group drug therapy should be considered at LDL-C levels 160 mg/dL (4.1 mmol/L). In individuals at lower risk (<2 risk factors) and whose LDL-C levels are 160 mg/dL (4.1 mmol/L), TLC are recommended. Drug therapy should be considered when LDL-C levels are 190 mg/dL (5 mmol/L) despite TLC, and is optional depending on clinical judgement at LDL-C levels of 160–189 mg/dL (4.1-5 mmol/L). The goal for LDL-C in this risk category is <160 mg/dL (4.1 mmol/L). When LDL-C lowering drug therapy is employed in high-risk or moderately high-risk patients, it is advised that intensity of therapy be sufficient to achieve at least a 30% to 40% reduction in LDL-C levels. Moreover, any person at high risk or moderately high risk who has life-style related risk factors (eg obesity, physical inactivity, elevated TG, low HDL-C or the metabolic syndrome) is a candidate for TLC to modify these risk factors regardless of LDL-C level. Reference 1. Grundy SM, Cleeman JI, Merz NB et al. Implications of recent clinical trials for the National Cholesterol Education Program Adult Treatment Panel III guidelines. Circulation 2004;110:227–239. Previous LDL-C goals New LDL-C goals 100 - 70 mg/dL* 70 - Grundy SM, et al. Circulation. 2004;110:
 High Risk. CHD or CHD risk equivalents. (10-yr risk >20%) Moderate Risk. ≥2 risk factors. (10-yr risk <10%) Lower Risk. <2 risk factors goal mg/dL goal mg/dL. goal mg/dL. LDL-C level goal mg/dL. 100 mg/dL* Based on recent clinical trial evidence, an NCEP report1 has been published recommending tighter control of cholesterol management. The trials support an LDL-C goal of <100 mg/dL in high-risk patients, and the inclusion of diabetes in the high-risk category. All patients with CHD or CHD risk equivalents are at high-risk. Therapeutic lifestyle changes (TLC) remain an essential part of clinical management. In patients at high risk (CHD and CHD risk equivalents, 10-year risk >20%), the recommended LDL-C goal is <100 mg/dL, but when risk is very high, an LDL-C goal of <70 mg/dL (1.8 mmol/dL) is a proposed therapeutic option. Patients at very high risk are those with established CVD plus: multiple major risk factors (especially diabetes); severe and poorly controlled risk factors (especially continued cigarette smoking); multiple risk factors of the metabolic syndrome and patients with acute coronary syndrome. The recommended point at which TLC should be initiated is an LDL-C level of 100 mg/dL (2.6 mmol/L). The guidelines recommend that drug therapy be considered in this category simultaneously with TLC in persons whose LDL-C levels are 100 mg/dL (2.6 mmol/L). In patients at moderately high risk (2 risk factors and 10-year CHD risk of 10–20%) the guidelines recommend that TLC are initiated at LDL-C levels of 130 mg/dL (3.4 mmol/L), with the aim of <130 mg/dL (3.4 mmol/L), but an LDL-C goal of <100 mg/dL (2.6 mmol/L) is a therapeutic option based on clinical trial evidence. This also applies to patients with a baseline LDL-C of mg/dL. Drug therapy should be considered if LDL-C levels remain 130 mg/dL (3.4 mmol/L), after 3 months of TLC. In patients at moderate risk (2 risk factors and 10-year CHD risk of <10%) the guidelines recommend that TLC are initiated at LDL-C levels of 130 mg/dL (3.4 mmol/L), with the aim of <130 mg/dL (3.4 mmol/L). In this group drug therapy should be considered at LDL-C levels 160 mg/dL (4.1 mmol/L). In individuals at lower risk (<2 risk factors) and whose LDL-C levels are 160 mg/dL (4.1 mmol/L), TLC are recommended. Drug therapy should be considered when LDL-C levels are 190 mg/dL (5 mmol/L) despite TLC, and is optional depending on clinical judgement at LDL-C levels of 160–189 mg/dL (4.1-5 mmol/L). The goal for LDL-C in this risk category is <160 mg/dL (4.1 mmol/L). When LDL-C lowering drug therapy is employed in high-risk or moderately high-risk patients, it is advised that intensity of therapy be sufficient to achieve at least a 30% to 40% reduction in LDL-C levels. Moreover, any person at high risk or moderately high risk who has life-style related risk factors (eg obesity, physical inactivity, elevated TG, low HDL-C or the metabolic syndrome) is a candidate for TLC to modify these risk factors regardless of LDL-C level. Reference. 1. Grundy SM, Cleeman JI, Merz NB et al. Implications of recent clinical trials for the National Cholesterol Education Program Adult Treatment Panel III guidelines. Circulation 2004;110:227–239. Previous LDL-C goals. New LDL-C goals mg/dL* 70 - Grundy SM, et al. Circulation. 2004;110:")
4
TNT: Stable CAD Patients Major Cardiovascular Events
(HR = % CI 0.69, 0.89) P=0.0002 Proportion of patients experiencing major cardiovascular event 0.05 0.10 0.15 Atorvastatin 10 mg LDL 100 Atorvastatin 80 mg LDL 77 Time (years) Relative risk reduction = 22% Over the course of the study, there was a highly significant reduction in major cardiovascular events in the atorvastatin 80mg group. The Kaplan-Meier analysis demonstrates a hazard ratio of 0.78 with a p-value of This represents a 22% reduction in relative risk in the atorvastatin 80mg group relative to the atorvastatin 10 mg group over-and-above the remarkably low absolute event rate of 10.9% recorded in the atorvastatin 10mg group. There was no statistical interaction for age or gender in the primary outcome measure. Further analyses of these categories are underway. *CHD death, nonfatal non–procedure-related MI, resuscitated cardiac arrest, fatal or nonfatal stroke LaRosa JC, et al. N Eng J Med. 2005;352
 P= Proportion of patients experiencing major cardiovascular event Atorvastatin 10 mg LDL 100. Atorvastatin 80 mg LDL Time (years) Relative risk reduction = 22% Over the course of the study, there was a highly significant reduction in major cardiovascular events in the atorvastatin 80mg group. The Kaplan-Meier analysis demonstrates a hazard ratio of 0.78 with a p-value of This represents a 22% reduction in relative risk in the atorvastatin 80mg group relative to the atorvastatin 10 mg group over-and-above the remarkably low absolute event rate of 10.9% recorded in the atorvastatin 10mg group. There was no statistical interaction for age or gender in the primary outcome measure. Further analyses of these categories are underway. *CHD death, nonfatal non–procedure-related MI, resuscitated cardiac arrest, fatal or nonfatal stroke. LaRosa JC, et al. N Eng J Med. 2005;352.")
5
Lipoproteins and Atherosclerosis Oxidation, modification, aggregation
A-I Oxidation, modification, aggregation CE CE CE B Chol HDL Arterial macrophage LDL

7
“On-treatment” HDL-C Predicts Cardiovascular Events: TNT
Major Cardiovascular Events On treatment HDL-C (mg/dL) % Mean LDL-C 99 mg/dL Mean LDL-C 73 mg/dL Barter et al. ACC Abstract
 % Mean LDL-C 99 mg/dL. Mean LDL-C 73 mg/dL. Barter et al. ACC Abstract")
8
Is HDL causally related to atherosclerosis and CHD risk or simply a very good integrator and biomarker of CHD risk?

9
Low HDL is often accompanied by other cardiovascular risk factors
Insulin resistance Inflammation Hypertension High triglycerides ↓HDL Gerald Reaven in 1988 coined the term Jean-Pierre Despres in Quebec ↑ Cardiovascular Disease

10
Low HDL is often accompanied by other cardiovascular risk factors
Insulin resistance Inflammation Hypertension High triglycerides ↓HDL Gerald Reaven in 1988 coined the term Jean-Pierre Despres in Quebec ? ↑ Cardiovascular Disease

11
Hepatic expression of apoA-I reduces and even regresses atherosclerosis in mice
AdapoA-I Liver A-I HDL

12
HDL Metabolism and Reverse Cholesterol Transport
Bile A-I A-I FC CE CE FC LCAT FC FC CE ABCA1 SR-BI Macrophage Liver

13
Quantitation of macrophage to feces reverse cholesterol transport in vivo
3H-BA 3H-FC Bile 3H-BA 3H-FC 3H-Chol 3H-BA 3H-FC Plasma 3H-cholesterol, AcLDL 3H-chol

14
ApoA-I overexpression promotes macrophage to feces reverse cholesterol transport
ApoA-I adenovirus Feces 3H-BA 3H-FC Bile 3H-BA 3H-FC 3H-Chol 3H-BA 3H-FC Plasma 3H-cholesterol, AcLDL 3H-chol

15
HDL-C levels are not a marker of the rate of reverse cholesterol transport
Bile A-I A-I FC CE CE FC LCAT FC FC CE ABCA1 SR-BI Macrophage Liver SR-BI HDL RCT atherosclerosis Zhang, et al, J Clin Invest, 2004

16
Targeting HDL metabolism for therapeutic reasons is complex
Intestine ABCG1 A-I A-I FC PPARα PPARγ PPARδ BA LXR FC FC LCAT FC FC CE ABCA1 SR-BI HL, EL M Macrophage Liver CETP LDLR PLTP CE B TG Anti-oxidant, anti-inflammatory, anti-thrombotic, other VLDL/LDL

17
Clinical studies have not definitively confirmed the HDL hypothesis
Niacin: Coronary Drug Project, HATS Fibrates: VA-HIT, BIP, FIELD ApoA-I: IVUS studies

18
Nicotinic Acid (Niacin)
This is its structure.

19
Niacin acts on adipose to reduce FFA release and flux to liver
B VLDL apoB MTP TG LDLR B FFA LDL FFA Niacin

20
Niacin receptor (GPR109A)
Highly expressed in adipose tissue Mediates the anti-lipolytic effects of niacin

21
Adipocyte lipolysis generating FFA
Adenylate Cyclase ATP cAMP FFA PKA Inactive HSL Active HSL TG FFA

22
Suppression of lipolysis in adipocytes by niacin activating its receptor GPR109A
Gi-GDP Gi-GTP Adenylate Cyclase ATP cAMP FFA PKA Inactive HSL Active HSL TG FFA

23
Niacin activates its receptor GPR109A in adipose to reduce FFA release and flux to liver
LDLR apoB TG B VLDL LDL MTP FFA Niacin GPR109A

24
Mechanism of Niacin-induced Flushing
Nicotinic Acid–Induced Flush Undesirable effects Arachidonic acid COX-1 EP2 or EP4 DP1 Smooth muscle cell or other cell type Dermal macrophages PGE2 PGD2 Cutaneous vasodilation and burning sensation on face and upper body Adapted from Pike NB. J Clin Invest. 2005;115:

25
Mechanisms of niacin’s HDL raising effects?
CE ? PL TG Liver Kidney

26
Data are needed proving that adding niacin to a statin reduces CV outcomes to a greater extent than statin alone

27
AIM-HIGH Study Overview
Simvastatin Atherogenic Dyslipidemia (HDL<40 or 50; TGL>149; LDL<160) CV Death NFMI Stroke ACS 3-5 yr Vascular Dz. Age >45 years Simvastatin + niaspan 2 year enrollment Hypothesis -30% event rate with Simva -23% event rate with simva-nia - 50% relative reduction based on ~46% placebo rate 3300 patients from 60 sites (U.S. and Canada LDL-C target <80 mg/dl both groups (may add ezetimibe if needed)
 CV Death. NFMI. Stroke. ACS. 3-5 yr. Vascular Dz. Age >45 years. Simvastatin + niaspan. 2 year enrollment. Hypothesis. -30% event rate. with Simva. -23% event rate with simva-nia. - 50% relative reduction based on ~46% placebo rate patients from 60. sites (U.S. and Canada. LDL-C target <80 mg/dl both groups (may add ezetimibe if needed)")
28
HPS2-THRIVE: A Randomized Trial of the Long-term Clinical Effects of Raising HDL With Niacin and Laropiprant Does niacin combined with Laropiprant prevent vascular events in high-risk patients receiving intensive LDL-lowering therapy? An international collaboration, with a Central Office in Oxford and 3 Regional Coordinating Centers in the UK, China and Scandinavia, will conduct the trial in about 200 hospitals Patients aged years with pre-existing atherosclerotic disease receiving simvastatin 40 mg qd and, if indicated, ezetimibe/simvastatin 10/40 mg qd N=20,000 Randomization Niacin 2 g + Laropiprant 40 mg Placebo Follow-up visits at 3 and 6 months, then every 6 months thereafter THRIVE=Treatment of HDL to Reduce the Incidence of Vascular Events.

29
CETP inhibition: the definitive test of the HDL hypothesis?

30
HDL Metabolism: Role of CETP
Bile A-I A-I FC CE CE FC LCAT FC FC CE ABCA1 SR-BI Macrophage Liver CETP LDLR CE B TG VLDL/LDL

31
CETP Deficiency is Associated with Markedly Increased HDL-C Levels
A-I Bile FC A-I FC CE CE CE LCAT FC FC ABCA1 SR-BI Macrophage Liver X CETP LDLR CE B TG VLDL/LDL

32
CETP Inhibition as a Novel Strategy to Raise HDL-C
Bile Feces A-I A-I FC CE CE FC LCAT FC CE FC ABCA1 SR-BI Macrophage Liver X CETP LDLR CETP inhibitor CE B TG VLDL/LDL

33
Treatment with the CETP inhibitor torcetrapib substantially raiseed HDL-C levels in patients with low HDL Brousseau, et al. NEJM 350: ; 2004

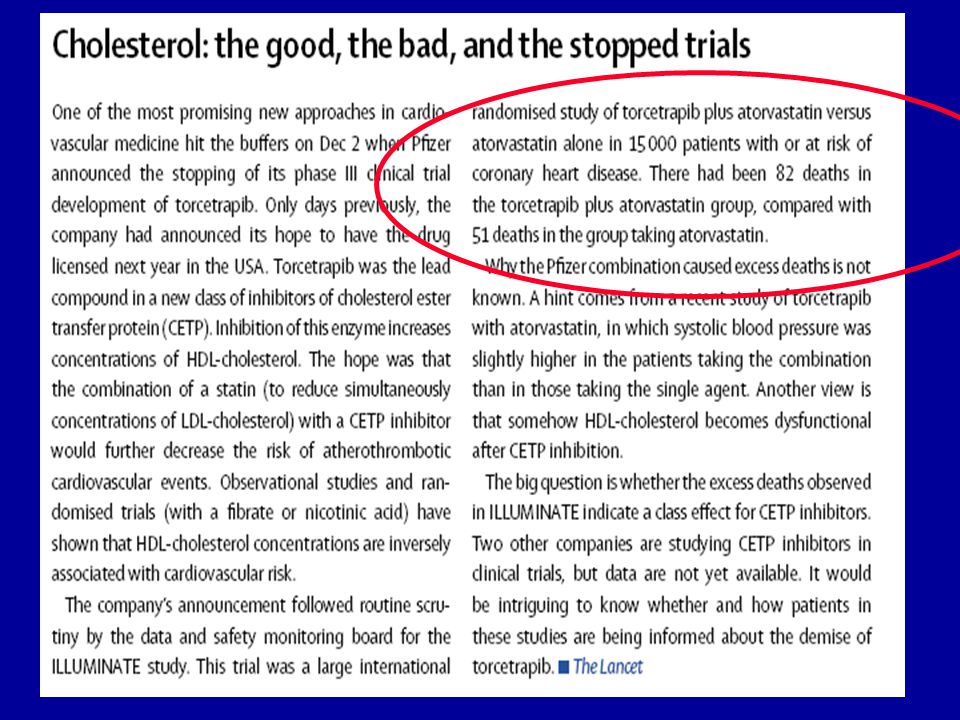
35
ILLUMINATE: Increased mortality and major cardiovascular events in subjects randomized to torcetrapib therapy despite favorable lipid changes HDL 72% LDL 25% Figure 2. Kaplan-Meier Curves for Death from Any Cause and for the Primary Composite Outcome. Panel A shows the between-group comparison of patients who died from any cause during the study: 59 patients in the atorvastatin-only group and 93 patients in the torcetrapib group. Panel B shows the between-group comparison of patients who had the primary composite outcome: 373 patients in the atorvastatin-only group and 464 patients in the torcetrapib group. The primary outcome was the time to the first occurrence of a major cardiovascular event, a composite that included four components: death from coronary heart disease, nonfatal myocardial infarction (excluding procedure-related events), stroke, and hospitalization for unstable angina. Analyses in both panels were censored on December 2, 2006. Barter P et al. N Engl J Med 2007
, stroke, and hospitalization for unstable angina. Analyses in both panels were censored on December 2, Barter P et al. N Engl J Med")
36
Torcetrapib Phase III Imaging Program: Efficacy
One coronary IVUS and two carotid IMT trials Torcetrapib resulted in increases in HDL-C of 50-63% and decreases in LDL-C of ~ 20% No significant impact on atherosclerosis progression by carotid IMT or coronary IVUS

37
Torcetrapib Phase III Imaging Program: Blood pressure
Carotid IMT trial in heterozygous FH patients (RADIANCE 1): Mean BP increase 2.1 mmHg Carotid IMT trial in mixed hyperlipidemia (RADIANCE 2): Mean BP increase 5.1 mmHg Coronary IVUS study in CHD patients (ILLUSTRATE): Mean BP increase 4.6 mmHg
: Mean BP increase 2.1 mmHg. Carotid IMT trial in mixed hyperlipidemia (RADIANCE 2): Mean BP increase 5.1 mmHg. Coronary IVUS study in CHD patients (ILLUSTRATE): Mean BP increase 4.6 mmHg.")
38
Is the BP increasing effect of torcetrapib
- a mechanism-based effect of CETP inhibition -or a molecule-specific effect of torcetrapib?

39
ILLUMINATE: Increased mortality and major cardiovascular events in subjects randomized to torcetrapib therapy Table 4. Causes of Death. Barter P et al. N Engl J Med 2007

40
Potential Mechanisms of Adverse Outcomes Associated with Torcetrapib
Figure 1. Potential Mechanisms of Adverse Outcomes Associated with Torcetrapib. Treatment with torcetrapib has both mechanism-based and off-target effects that may have contributed to an increased rate of adverse cardiovascular and noncardiovascular outcomes. The drug inhibits cholesteryl ester transfer protein (CETP), blocking the transfer of cholesteryl esters to lipoproteins containing apolipoprotein B (ApoB), such as low-density lipoprotein (LDL), resulting in increased levels of high-density lipoprotein (HDL) cholesterol and enlarged HDL particles. Although HDL cholesterol can be taken up directly by the liver through the HDL scavenger receptor, class B, type I (SR-BI), inhibition of CETP may reduce the rate of return of HDL cholesterol to the liver, thus impairing reverse cholesterol transport and increasing cardiovascular risk. In addition, the change in HDL composition could conceivably impair immune function associated with HDL, thus increasing noncardiovascular risks such as infection and cancer. On the other hand, the molecule torcetrapib clearly has the off-target effects of elevating levels of aldosterone and blood pressure, changes that probably contributed to the increased cardiovascular risk. The potential that torcetrapib has off-target effects that contributed to an increased risk of noncardiovascular events is possible but speculative. Finally, CETP inhibition has the potentially beneficial effects of increasing cholesterol efflux from macrophages mediated by ATP-binding cassette transporter G1 (ABCG1) (which could increase the rate of physiologically relevant reverse cholesterol transport from macrophages) and of increasing the uptake of LDL cholesterol by the liver (which reduces LDL cholesterol levels), effects that could be important for CETP inhibitors that do not have the off-target effects of torcetrapib. Rader D. N Engl J Med 2007
, blocking the transfer of cholesteryl esters to lipoproteins containing apolipoprotein B (ApoB), such as low-density lipoprotein (LDL), resulting in increased levels of high-density lipoprotein (HDL) cholesterol and enlarged HDL particles. Although HDL cholesterol can be taken up directly by the liver through the HDL scavenger receptor, class B, type I (SR-BI), inhibition of CETP may reduce the rate of return of HDL cholesterol to the liver, thus impairing reverse cholesterol transport and increasing cardiovascular risk. In addition, the change in HDL composition could conceivably impair immune function associated with HDL, thus increasing noncardiovascular risks such as infection and cancer. On the other hand, the molecule torcetrapib clearly has the off-target effects of elevating levels of aldosterone and blood pressure, changes that probably contributed to the increased cardiovascular risk. The potential that torcetrapib has off-target effects that contributed to an increased risk of noncardiovascular events is possible but speculative. Finally, CETP inhibition has the potentially beneficial effects of increasing cholesterol efflux from macrophages mediated by ATP-binding cassette transporter G1 (ABCG1) (which could increase the rate of physiologically relevant reverse cholesterol transport from macrophages) and of increasing the uptake of LDL cholesterol by the liver (which reduces LDL cholesterol levels), effects that could be important for CETP inhibitors that do not have the off-target effects of torcetrapib. Rader D. N Engl J Med")
41
Could CETP inhibition impair reverse cholesterol transport?
Bile Feces A-I A-I FC CE CE FC LCAT FC CE FC ABCA1 SR-BI Macrophage Liver X CETP LDLR CETP inhibitor CE B TG VLDL/LDL

42
Potential beneficial effects of CETP inhibition
Bile Feces ABCG1 A-I A-I FC CE CE FC LCAT FC CE FC ABCA1 SR-BI Macrophage Liver X CETP LDLR CETP inhibitor CE B TG VLDL/LDL

43
HDL-targeted therapeutics in the post-torcetrapib era: focus on HDL function
Increasing HDL-C levels is neither adequate nor necessary for predicting cardiovascular benefit of an HDL-targeted therapeutic approach Improving HDL function will be the focus of new therapies Better and standardized methods to assess HDL function will be required

44
Targeting HDL: Promote Reverse Cholesterol Transport
Bile A-I A-I FC CE CE FC LCAT FC FC CE ABCA1 SR-BI Macrophage Liver

45
Increasing lipid-poor apoA-I as an acceptor for cholesterol efflux via ABCA1
BA FC FC LCAT FC FC CE ABCA1 SR-BI Macrophage CETP LDLR CE B TG VLDL/LDL

46
Increasing lipid-poor apoA-I as an acceptor for cholesterol efflux: parenteral approaches
ApoA-I Milano/phospholipid complexes ApoA-I (wild-type)/PL complexes ApoA-I mimetic peptides Large unilamellar vesicles (LUVs) Delipidated HDL
/PL complexes. ApoA-I mimetic peptides. Large unilamellar vesicles (LUVs) Delipidated HDL.")
47
Increasing endogenous apoA-I production via transcriptional enhancement
Liver Intestine A-I HDL

48
Regulation of Cholesterol Efflux in the Macrophage by LXR
A-I CE ABCG1 LXR Chol A-I ABCA1

49
Pharmacologic Promotion of Macrophage Cholesterol Efflux by Synthetic LXR Agonists
A-I CE ABCG1 LXR Chol A-I ABCA1 Agonist

50
The LXR agonist GW3965 significantly increased macrophage to feces reverse cholesterol transport in vivo 2.5 * 2.0 % CPM Injected 1.5 1.0 0.5 0.0 Control LXR agonist Naik, et al, Circulation 2005

51
LXR agonists can cause steatosis, hypertriglyceridemia, and elevated LDL-C
TG B VLDL apoB MTP TG LDLR B LDL SREBP1c LXR

52
Endothelial Lipase: a member of the lipoprotein lipase gene family
TG-rich lipoproteins HDL TG Lipase LPL HL EL Phospholipase Jaye M, et al, Nature Genetics 21:424; 1999

53
Endothelial lipase promotes catabolism of apoA-I and reduces HDL levels
Bile A-I A-I FC EL CE CE SR-BI PL TG Liver Kidney

54
Endothelial lipase is upregulated by inflammation in metabolic syndrome and mediates low HDL-C levels Cytokines ↑EL Gerald Reaven in 1988 coined the term Jean-Pierre Despres in Quebec ↓HDL

55
Mutations in endothelial lipase cause high HDL

56
Endothelial Lipase: Target for Pharmacologic Inhibition to Raise HDL?
EL inhibitor Bile A-I A-I FC X EL CE CE SR-BI PL TG Liver Kidney

57
Targeting HDL metabolism for therapeutic reasons is complex
Intestine ABCG1 A-I A-I FC PPARα PPARγ PPARδ BA LXR FC FC LCAT FC FC CE ABCA1 SR-BI HL, EL M Macrophage Liver CETP LDLR PLTP CE B TG Anti-oxidant, anti-inflammatory, anti-thrombotic, other VLDL/LDL

Similar presentations


>")

 Lipid Guidelines (The Good and Bad) Robert A. Vogel, MD Clinical Professor of Medicine University of Colorado Denver Disclosures: National Coordinator.>")


 LDL derived from VLDL as TAG in VLDL (and IDL) removed by lipoprotein lipase LDL major cholesterol-carrying lipoprotein.>")


 Kidney (CETP)CEHDL.>")


 and Drug Therapy in Different Risk Categories Risk Category LDL Goal (mg/dL)>")

