Download presentation
Presentation is loading. Please wait.

1
Unit 1: Honors Precalculus
Lesson 1: Standard 1.1 and 1.2 (1-1, 1-2) Lesson 2: Standard 1.3 (1-3, 1-4) Lesson 3: Standard 1.3 and 1.4 (1-5, 1-7) Lesson 4: Standard 1.3 (1-6) Lesson 5: Standard 1.6 (1-8, 2-6) Lesson 6: Standard 1.5 (2-1, 2-2)
 Lesson 2: Standard 1.3 (1-3, 1-4) Lesson 3: Standard 1.3 and 1.4 (1-5, 1-7) Lesson 4: Standard 1.3 (1-6) Lesson 5: Standard 1.6 (1-8, 2-6) Lesson 6: Standard 1.5 (2-1, 2-2)")
2
Welcome to Precalculus! Mrs. Bunting Room C109
Get an index card and your handouts. Pick up a textbook (Rust with spiral on front) Find your seat on the seating chart and take your seat. Fill out your index card. Please begin to work on reviewing the material in Section 1-1 of your book. Use your textbook and tablemates to help yourself review this material. You will need to TAKE NOTES on the material. Complete p 10 #17 – 37 odd, all
 Find your seat on the seating chart and take your seat. Fill out your index card. Please begin to work on reviewing the material in Section 1-1 of your book. Use your textbook and tablemates to help yourself review this material. You will need to TAKE NOTES on the material. Complete p 10 #17 – 37 odd, all.")
3
By the time you and your group finish you will answer…
Standard 1.1: distinguish between relations and functions, identify domain and range, and evaluate functions (Section 1-1) p 10 #17 – 37 odd, all By the time you and your group finish you will answer… What is a relation? What is contained in the domain of a relation? In the range? What is a function and how is it different from a relation? What is the vertical line test and what is it used for? What does function notation look like? How are functions evaluated for specific values?
 p 10 #17 – 37 odd, all. By the time you and your group finish you will answer… What is a relation What is contained in the domain of a relation In the range What is a function and how is it different from a relation What is the vertical line test and what is it used for What does function notation look like How are functions evaluated for specific values")
4
What is Honors Precalculus?
You will be introduced to: Higher level algebra skills! Common and Natural Logarithms! Limits! Arithmetic, Geometric and Infinite Series! Polynomial, Rational and Exponential Functions! Lots of Trigonometry! Rectangular and Polar Coordinates! not necessarily in that order…

5
What Can I Expect? We will cover at least a section a day.
We will complete a unit pretty much weekly. Each quarter will have several portfolio projects. You can expect to have Precalculus work to do every single night.

6
In a nutshell: To Do Well: Grading to Standards:
1. You need to master EVERY standard to pass. 2. Any standard which you do not pass must be reassessed. To Do Well: 1. Complete your homework It is your ticket to reassess. 2. Reassess promptly while things are fresh.

7
Extra Help Tutorial – right here in C109! Everyday but Tuesday (Library Duty) Got Math? 3C in C211 Ms Kielkucki 3D in C106 Ms Ciliano 4C in C104 Mr. Lisella 4C in C100 Ms Rohrer 4D in C100 Ms Bunting

8
In this unit we will complete…
Unit 1: “Get in Line” In this unit we will complete… Standard 1.1: distinguish between relations and functions, identify domain and range, and evaluate functions (1-1) Standard 1.2: perform operations (add, subtract, multiply, divide, compose) on functions (1-2) Standard 1.3: analyze graphs and make predictions based on linear functions (1-3, 1-4, 1-5, 1-6) Standard 1.4: graph and interpret piecewise functions (1-7) Standard 1.5: solve systems of equations (2-1, 2-2) Standard 1.6: solve systems of linear inequalities (1-8, 2-6)
 Standard 1.2: perform operations (add, subtract, multiply, divide, compose) on functions (1-2) Standard 1.3: analyze graphs and make predictions based on linear functions (1-3, 1-4, 1-5, 1-6) Standard 1.4: graph and interpret piecewise functions (1-7) Standard 1.5: solve systems of equations (2-1, 2-2) Standard 1.6: solve systems of linear inequalities (1-8, 2-6)")
9
Standard 1.1 (continued): Using the Vertical Line Test and Stating The Domain From A Graph (1-1)
x y x y

10
x y x y

11
Standard 1.1: Finding the Domain of a Function in Equation Form (1-1)
To find out what the independent (x) values for a function will be involves finding out what they cannot be. There are TWO Bozo No-No’s: No values which cause zero’s in denominators No values which cause a negative under a square root (or any even root)
 values for a function will be involves finding out what they cannot be. There are TWO Bozo No-No’s: No values which cause zero’s in denominators. No values which cause a negative under a square root (or any even root)")
12
Find the values for x which are not in the domain of the function, then state the domain in proper set notation.

13
Find the values for x which are not in the domain of the function, then state the domain in proper set notation.

14
Find the values for x which are not in the domain of the function, then state the domain in proper set notation.

15
Find the values for x which are not in the domain of the function, then state the domain in proper set notation.

16
When we finish this lesson you will be able to …
Standard 1.2: perform operations (add, subtract, multiply, divide, compose) on functions (1-2) When we finish this lesson you will be able to … Perform basic math operations with functions Create, use and check composite functions
 on functions (1-2) When we finish this lesson you will be able to … Perform basic math operations with functions. Create, use and check composite functions.")
17
Given: Add the functions: Written: It means:

18
Given: Subtract the functions: Written: It means:

19
Given: Multiply the functions: Written: It means:

20
Given: Multiply the functions: Written: It means:

21
You try it… Given:

22
Composite Functions: Careful with notation, this is not multiplication. It means you actually put one function into the other. The second one is going into the first.

23
Example:

24
Example:

25
To Check:

26
Homework: HW 1.1: p 10 #17 – 47 odd, 48-50 all
For Tomorrow: HW 1.1: p 10 #17 – 47 odd, all HW 1.2: p 17 #11 – 23 odd, 31 By Monday: Cover book Get your binder or notebook setup Get parental form turned in

27
Warm-Up: P 25 #41 Have your homework out to be checked!

28
Homework:

29
At the end of this lesson you will be able to…
Standard 1.3: analyze graphs and make predictions based on linear functions (1-3,1-4) At the end of this lesson you will be able to… Identify and properly use the three forms of linear equations Find x- and y-intercepts Define, identify and use the formula for slope Identify the two special cases of slope
 At the end of this lesson you will be able to… Identify and properly use the three forms of linear equations. Find x- and y-intercepts. Define, identify and use the formula for slope. Identify the two special cases of slope.")
30
Linear Functions What does a linear equation look like?
Are all the equations of lines also functions? How many of the forms do you remember?

31
Standard Form:

32
Standard Form: Where A, B and C are numbers like this.
In this form you can tell what about the line? Nothing.

33
Slope-Intercept Form Where m is… And b is… In this form you can…
Tell exactly what the line looks like Graph the line

34
Point-Slope Form: Used to develop the linear equation if you know the slope, m, and one point on the graph, (x1, y1). Find the standard form of the equation of the line which has a slope of -1 and passes through the point (-4, 5).
.")
35
What if you only have two points on the graph?
Find the standard form of the equation which passes through the points (6,5) and (4,-5). Find slope. Use slope and one of the points to find equation of the line.
 and (4,-5). Find slope. Use slope and one of the points to find equation of the line.")
36
Graph a couple…

37
The Two Special Cases of Slope:

38
Finding the Zero of a Linear Function:
Zero is another name for the x-intercept. You will also hear it called a root. The y-intercept is called b but not much else.

39
Finding x- and y-intercepts:

40
Homework: HW1 1.3: P24 #13 – 33 every other odd HW2 1.3: P30 #11 – 27 every other odd

41
Warm-up:

42
Homework:

43
By the end of this lesson we will be able to answer…
Standard 1.3: analyze graphs and make predictions based on linear functions (1-5) By the end of this lesson we will be able to answer… How can parallel and perpendicular lines be identified from their equations? How can the properties of lines be used to identify geometric figures? How can the coefficient for an equation be found so that it will be parallel or perpendicular to a specific line?
 By the end of this lesson we will be able to answer… How can parallel and perpendicular lines be identified from their equations How can the properties of lines be used to identify geometric figures How can the coefficient for an equation be found so that it will be parallel or perpendicular to a specific line")
44
Parallel and Perpendicular Lines
Parallel lines have the same slope Perpendicular lines have slopes which are negative reciprocals of each other. Find the equation of the line parallel to the equation above and passing through (2,-2) Find the equation of the line perpendicular to the equation above and passing through (-4,1)
 Find the equation of the line perpendicular to the equation above and passing through (-4,1)")
45
Special Case: Lines which have the same slope and the same y-intercept are called coinciding.

46
Slope and Distance: Consider the polygon with vertices at (0,0), (1,3), (3,-1) and (4,2). Is it a parallelogram? Is it a rectangle?

47
Are these lines parallel, coinciding perpendicular or none of these?
neither parallel coinciding perpendicular

48
Solving for an unknown coefficient:

49
Solving for an unknown coefficient:

50
Standard 1-4: graph and interpret piecewise functions (1-7)
In this lesson we will … Identify piecewise functions including greatest integer, step and absolute value. Graph piecewise functions.

51
Piecewise Functions: Different equations are used for different intervals of the domain. The graphs do not have to connect.

52
Graphing Piecewise Functions:

53
Another…

54
Step Functions: Are piecewise functions whose graphs look like a set of steps. One example of a step function is the greatest integer function.

55
An example of a step function fee schedule:
The cost of mailing a letter is $0.37 for the first ounce and $0.23 for each additional ounce or portion thereof.

56
The Absolute Value Function:

57
Make sure you find the turning point:

58
Make sure you find the turning point:

59
Homework: HW3 1.3: p36 #13-31 odd HW 1.4: p49 #11-33 odd

60
Warm-up: Feel free to get a piece of graph paper from the bin by the windows.
Graph the functions:

61
Homework:

62
In this section we will…
Standard 1.3: analyze graphs and make predictions based on linear functions (1-6) In this section we will… Draw and analyze scatter plots. Draw a best-fit line and write a prediction equation. Solve problems using prediction equation models.
 In this section we will… Draw and analyze scatter plots. Draw a best-fit line and write a prediction equation. Solve problems using prediction equation models.")
63
Collecting and Using Data:
Real life data seldom forms nice straight lines or smooth curves. For graphs which approximate a line, a best-fit line (also called a regression line) can be drawn and a prediction equation can be determined.
 can be drawn and a prediction equation can be determined.")
64
Scatter Plots: p 38 Basically, data is the graph of a relation.
If the graph shows a linear trend you can create a prediction equation. Accuracy of predictions depends on how closely the data approximates a line.

65
Correlation: p 40 This refers to how closely a set of data actually approximate a line. If the data is very scattered, that is a weak correlation. If the data is very close to being on a line then it has a strong correlation. Our example had moderate correlation.

66
More About Correlation: p 40
Correlation is measured using a correlation coefficient (r). r < ½ means weak, ½ < r < ¾ is moderate, ¾ < r < 1 is strong. One means complete correlation. NOTICE: r is positive for positive slopes and negative for negative slopes.
. r < ½ means weak, ½ < r < ¾ is moderate, ¾ < r < 1 is strong. One means complete correlation. NOTICE: r is positive for positive slopes and negative for negative slopes.")
67
The Prediction Equation:
Graph your data. Draw a best-fit line. Chose two points, on the line. Find their slope. Use the slope and one of the points to find the prediction line.

68
Regression Lines on the Calculator:
Go to STAT, choose EDIT, and enter the x-values in L1 and the y-values in L2. Go to STAT PLOT (2nd, Y=), press ENTER on 1:Plot 1, and turn Plot1 On. Go to WINDOW, and adjust your Xmin, Xmax, Ymin, and Ymax to fit your data. Go to GRAPH to see your points plotted. Go to STAT, choose CALC, arrow down to highlight the appropriate regression model, and press ENTER. Press L1 (2nd, 1), the comma (above the 7), L2 (2nd, 2), the comma again, then VARS, choose Y-VARS, choose Function, choose Y1, and press ENTER. Go to Y= to see that your equation has been transferred to the Y= screen. Go to GRAPH to see your line. To enter an x-value and find the corresponding y-value, go to CALC (2nd, TRACE) and choose 1:value. Enter the x-value, and the y-value will be provided. To enter a y-value and find the corresponding x-value, go to Y= and next to Y2 graph the line y=a, where a is the y-value in which you are interested. Then go to CALC (2nd, TRACE) and choose 5:intersect. Press ENTER three times, and the point of intersection will be provided. NOTE: You may need to change your viewing window to accomplish steps 8 and 9.
, press ENTER on 1:Plot 1, and turn Plot1 On. Go to WINDOW, and adjust your Xmin, Xmax, Ymin, and Ymax to fit your data. Go to GRAPH to see your points plotted. Go to STAT, choose CALC, arrow down to highlight the appropriate regression model, and press ENTER. Press L1 (2nd, 1), the comma (above the 7), L2 (2nd, 2), the comma again, then VARS, choose Y-VARS, choose Function, choose Y1, and press ENTER. Go to Y= to see that your equation has been transferred to the Y= screen. Go to GRAPH to see your line. To enter an x-value and find the corresponding y-value, go to CALC (2nd, TRACE) and choose 1:value. Enter the x-value, and the y-value will be provided. To enter a y-value and find the corresponding x-value, go to Y= and next to Y2 graph the line y=a, where a is the y-value in which you are interested. Then go to CALC (2nd, TRACE) and choose 5:intersect. Press ENTER three times, and the point of intersection will be provided. NOTE: You may need to change your viewing window to accomplish steps 8 and 9.")
69
Now…do it yourselves. Use the data your group was given.
Paste the chart with your data and plot your points on the large sheet of graph paper. Draw a best-fit line. Choose two points on your line and determine your prediction equation. Show all work on the graph paper. Label it “Hand Calculated Equation” Finally, use the graphing calculators to find the regression equation. Record it on the graph paper and label it “Calculator Generated Equation”. Make sure that you allow enough room on the paper to answer your questions.

70
Homework: HW5 1.3: p42 #7 and 9

71
Warm-up:. Grab a couple pieces of graph paper for the lesson Feel free to hole punch it For heaven’s sake! Finish those projects!

72
Homework:

73
Standard 1.6: Graph and solve using linear inequalities (1-8)
In this section we will… Graph linear inequalities Graph more complex inequalities

74
Inequality Graphs: Any line will cut the coordinate plane into two halves. Any point on the line will cause the statement to be true.

75
Inequality Graphs: Any point above the line causes...
Any point below the line causes...

76
Let’s try this one…

77
How about this?

78
Or this?

79
Okay Partners, wrangle these…
You will need graph paper. p 55 Partner 1 graphs #12, Partner 2 graphs #10 Switch papers and check each other. Partner 1 graphs #14, Partner 2 graphs #18

80
Answers:

82
Standard 1.6: Solve systems of linear inequalities (2-6)
At the end of this section you should be able to … Find the solution for a system of inequalities using a graph Graph a polygonal convex set Find the vertices for a polygonal convex set Find the minimum and maximum values for a polygonal convex set

83
How can the solution for a system of inequalities be determined using a graph?

84
What is a polygonal convex set?
A polygonal convex set is the solution for a system of inequalities. The solution is contained within the polygon formed by the boundaries of the inequalities.

85
First graph the inequalities and determine the polygonal convex set.

86
How do I find the vertices for a polygonal convex set?

87
How can I find the minimum and maximum values for a polygonal convex set?

88
Try this one… (3,-11)
")
89
Word Problem!!! P111 #26

90
One more! The Cruiser Bicycle Company makes two styles of bicycles: the Xenon, which sells for $200, and the Yaris, which sells for $600. Each bicycle has the same frame and tires, but the assembly and painting time required for the Xenon is only 1 hour, while it is 3 hours for the Yaris. There are 300 frames and 360 hours of labor available for production. How many bicycles of each model should be produced to maximize revenue, and how much money will be made?

91
Homework: Grab graph paper!
HW1 1.6: P55 #9 – 21 every other odd and #23 HW2 1.6: P110 #9 – 21 HW3 1.6: P117 #15 Look for a Unit 1 Test on Tuesday 2/15!!! Portfolio 1 due on Wednesday 2/16!!!

92
Warm-up:

93
Homework:

94
Standard 1.5: solve systems of equations (2-1, 2-2)
In these sections we will… Solve systems of equations involving two variables algebraically. Solve systems of equations involving three variables algebraically. You will need a ruler and a piece of graph paper.

95
What does the solution for a system of linear equations represent?

96
How Can We Solve a System?
Graphing Elimination Substitution

97
Solve the following systems by graphing:

98
Terminology: If lines intersect: ONE solution a.k.a. consistent and independent If same line twice: INFINITE solutions a.k.a. consistent and dependent If lines are parallel: NO solution a.k.a. inconsistent What were your graphs?

99
Substitution and Elimination:

100
Word Problem! p 71 #10

101
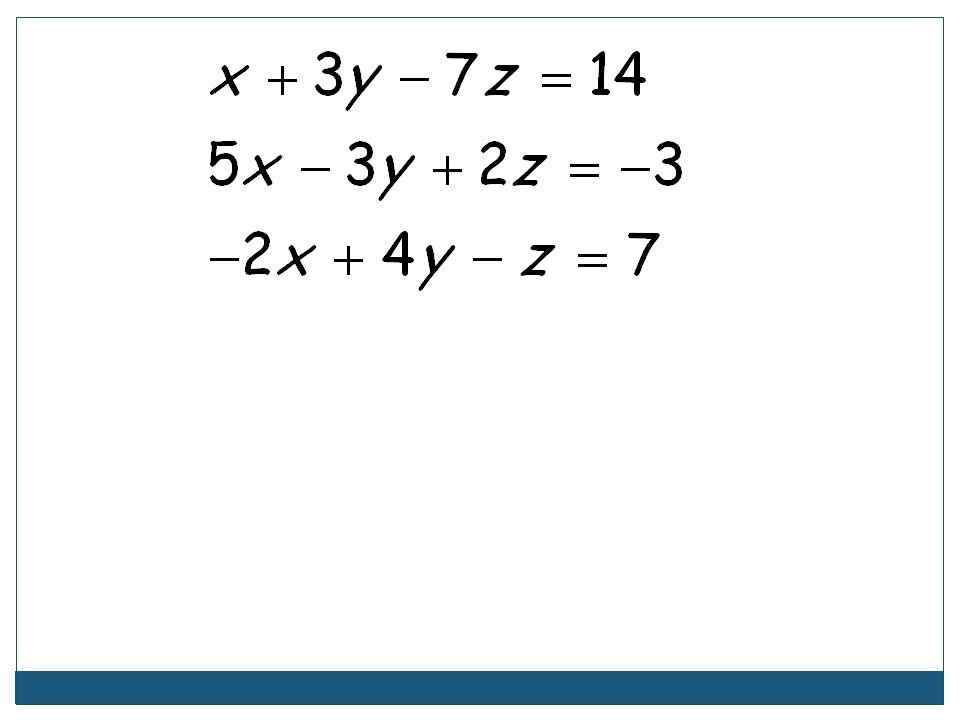
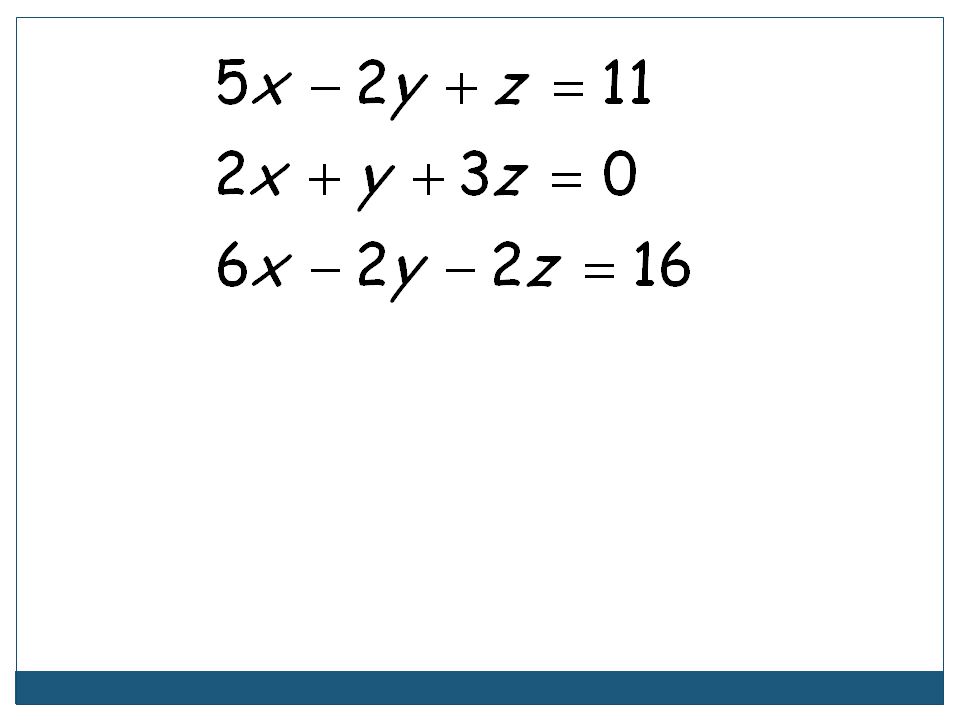
Solving Systems in 3 Variables
A system in 3 variables represents the intersection of 3 planes. Look at page 73. You need 3 equations to solve. You have to have the same number of equations as you have variables. Solve using substitution or elimination.

102
Let’s try some… How should the solution be written?

106
Now…YOU think. Write a system of 3 equations that fits each description. The system has a solution of x = - 5, y = 9 and z = 11. There is no solution to the system. The system has an infinite number of solutions.

107
Homework: HW1 1.5: P 71 #22 – 25 all HW2 1.5: P 76 #9, 11 and 13 UNIT 1 Test on Tuesday 2/15 Portfolio 1 due Wednesday 2/16

Similar presentations


 Concept: Be able to solve systems of equations by graphing Expected Prior Knowledge:>")


>")

