Download presentation
Presentation is loading. Please wait.

1
Chapter 1 Introduction to Macroeconomics
© 2014 Pearson Education, Inc.

2
1-2

3
What Macroeconomics Is About
Macroeconomics: the study of structure and performance of national economies and government policies that affect economic performance Issues addressed by macroeconomists: Long-run economic growth Business cycles Unemployment Inflation The international economy Macroeconomic policy Aggregation: from microeconomics to macroeconomics 1-3

4
Quick Intro to GNP and GDP
GNP – focused on nationality Sum of value of finished (or final) goods and services (as opposed to intermediate outputs) produced by a country’s economic agents (firms and households) during one year, regardless of whether production takes place within or outside the country. GDP – geographically focused Sum of value of finished (not intermediate) goods and services produced in a country during one year, regardless of whether foreigners or that country’s economic agents are doing the production. Alternative definition of GDP (or GNP) – national income Instead of determining the size of the economy by counting up the value of all finished goods and services, one can estimate GDP by summing value added, industry/sector by industry/sector. The single industry’s value-added is distributed as income to the suppliers of labor, capital, and other factors of production. Accordingly, the summation of all value added in an economy equals national income. 1-4
 goods and services (as opposed to intermediate outputs) produced by a country’s economic agents (firms and households) during one year, regardless of whether production takes place within or outside the country. GDP – geographically focused. Sum of value of finished (not intermediate) goods and services produced in a country during one year, regardless of whether foreigners or that country’s economic agents are doing the production. Alternative definition of GDP (or GNP) – national income. Instead of determining the size of the economy by counting up the value of all finished goods and services, one can estimate GDP by summing value added, industry/sector by industry/sector. The single industry’s value-added is distributed as income to the suppliers of labor, capital, and other factors of production. Accordingly, the summation of all value added in an economy equals national income")
5
The Growth Rate – What it Means
The growth rate between two years, such as 2014 and 2013, is given by the formula: where GDP2014 is the GDP in 2014 and GDP2013 is the GDP in 2013 If you know the growth rate and, for example, if the rate of growth between 2013 and 2014 is 1.3%, then to find the GDP in 2014, multiply the GDP in 2013 by In order to figure out the GDP over a longer period of time, say between 2009 and 2014 (a period of 5 years): notice that the growth rate is the average annualized rate (exactly 1.3% growth probably doesn’t occur every year; it is the average annual growth rate or more exactly, the rate that would generate the end year result if one growth rate had obtained for the entire time) 1-5
: notice that the growth rate is the average annualized rate (exactly 1.3% growth probably doesn’t occur every year; it is the average annual growth rate or more exactly, the rate that would generate the end year result if one growth rate had obtained for the entire time) 1-5.")
6
A Comparison of Growth Rates
Doubling time of income 1.3% About 50 years (around 3 generations) 2.0% A little over 30 years 3.0% A little less than 25 years 8.0% Less than 10 years 1-6
 2.0% A little over 30 years. 3.0% A little less than 25 years. 8.0% Less than 10 years")
7
Figure 1.1 Output of the U.S. economy, 1869-2011
Sources: Federal spending and receipts for 1869–1929 from Historical Statistics of the United States, Colonial Times to 1970, p. 1104; GNP 1869–1928 from Christina D. Romer, “The Prewar Business Cycle Reconsidered: New Estimates of Gross National Product, 1869–1908,” Journal of Political Economy, 97, 1 (February 1989), pp. 22–23; GNP for 1929 from FRED database, Federal Reserve Bank of St. Louis, Research.stlouisfed.org/fred2/ series/GDPA; Federal spending and receipts as percentage of output, 1930–2011 from Historical Tables, Budget of the U.S. Government, Table 1.2 Two main sources of growth Population growth Increases in average labor productivity 1-7
, pp. 22–23; GNP for from FRED database, Federal. Reserve Bank of St. Louis, Research.stlouisfed.org/fred2/ series/GDPA; Federal spending. and receipts as percentage. of output, 1930–2011 from. Historical Tables, Budget of the. U.S. Government, Table 1.2. Two main sources of growth. Population growth. Increases in average labor productivity")
8
1-8

9
Figure 1.2 Average labor productivity in the United States, 1900-2011
Sources: Employment in thousands of workers 14 and older for 1900–1947 from Historical Statistics of the United States, Colonial Times to 1970, pp. 126–127; workers 16 and older for 1948 onward from FRED database, Federal Reserve Bank of St. Louis, research.stlouisfed.org/fred2/series/ CE16OV. Average labor productivity is output divided by employment, where output is from Fig. 1.1. 1-9

10
Labor Productivity 1-10

11
What Macroeconomics Is About
Business cycles Business cycle: Short-run contractions and expansions in economic activity Downward phase is called a recession 1-11

12
Real and Potential GDP 1-12

13
What Macroeconomics Is About
Unemployment Rate Unemployment Rate by State Unemployment Rate by Country 1-13

14
Figure 1.3 The U.S. unemployment rate, 1890-2011
Sources: Civilian unemployment rate (people aged 14 and older until 1947, aged 16 and older after 1947) for 1890–1947 from Historical Statistics of the United States, Colonial Times to 1970, p. 135; for 1948 onward from FRED database Federal Reserve Bank of St. Louis, research.stlouisfed.org/fred2/series/UNRATE. 1-14
 for 1890–1947 from Historical Statistics of the United States, Colonial Times to 1970, p. 135; for 1948 onward from FRED database Federal Reserve Bank of St. Louis, research.stlouisfed.org/fred2/series/UNRATE")
15
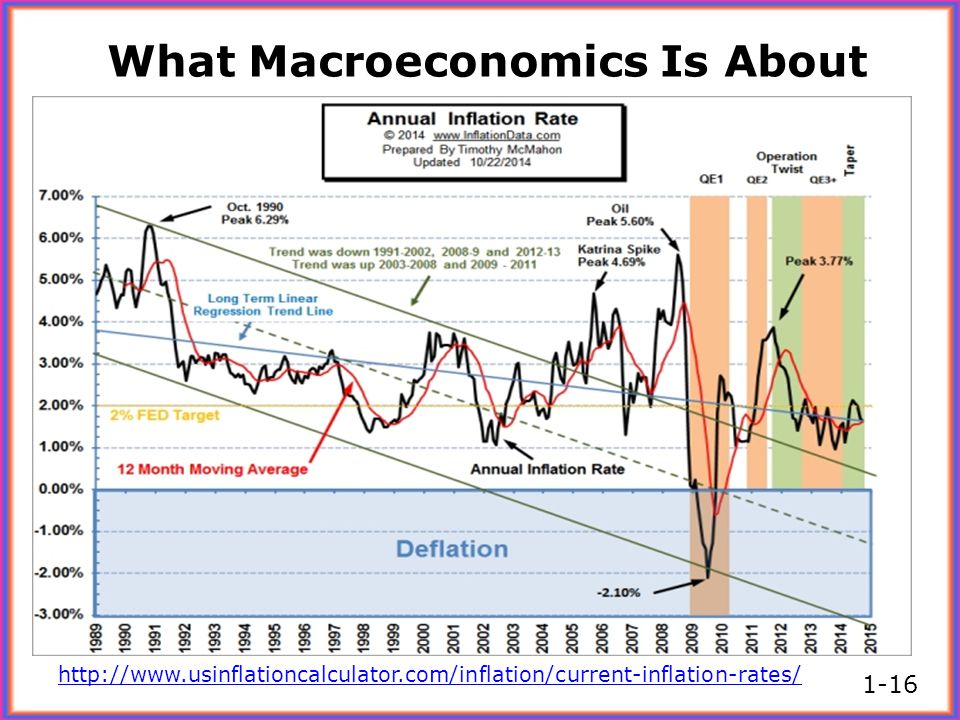
Inflation Deflation: when prices of most goods and services decline
Inflation rate: the percentage increase in the level of prices Hyperinflation: an extremely high rate of inflation What is disinflation? 1-15

16
What Macroeconomics Is About
1-16
17
Figure 1.4 Consumer prices in the United States, 1800-2011
Sources: Consumer price index, 1800–1946 (1967 = 100) from Historical Statistics of the United States, Colonial Times to 1970, pp. 210–211; 1947 onward (1982–1984 = 100) from FRED database, Federal Reserve Bank of St. Louis, research.stlouisfed.org/fred2/series/CPIAUCSL. Data prior to 1971 were rescaled to a base with 1982–1984 = 100. 1-17
 from Historical Statistics of the United States, Colonial Times to 1970, pp. 210–211; 1947 onward (1982–1984 = 100) from FRED database, Federal Reserve Bank of St. Louis, research.stlouisfed.org/fred2/series/CPIAUCSL. Data prior to 1971 were rescaled to a base with 1982–1984 =")
18
What Macroeconomics Is About
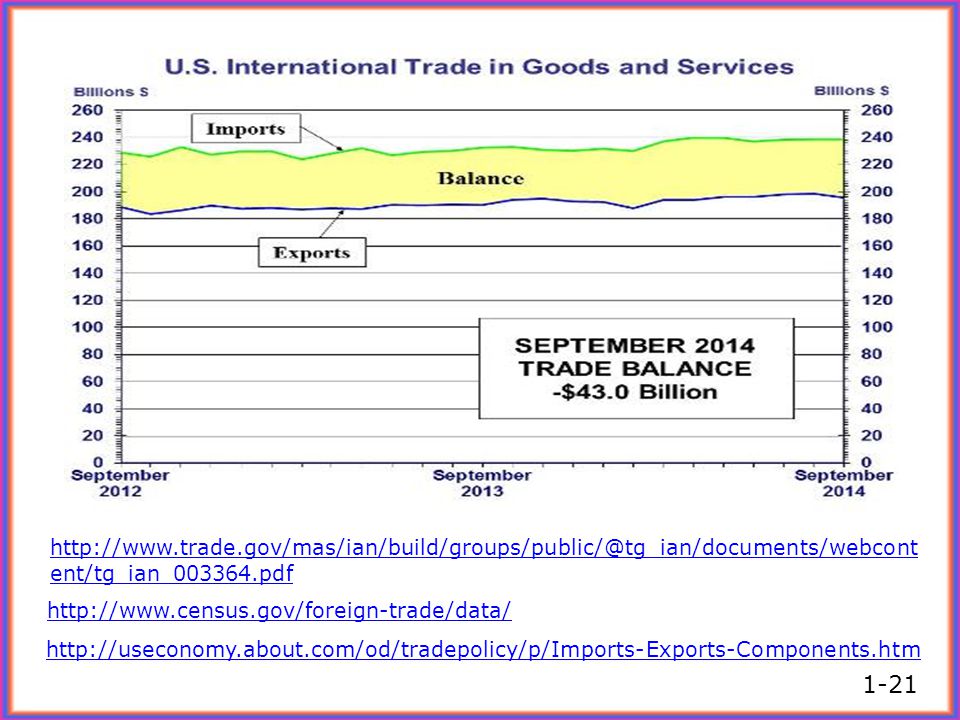
The international economy Open vs. closed economies Open economy: an economy that has extensive trading and financial relationships with other national economies Closed economy: an economy that does not interact economically with the rest of the world Trade imbalances Trade surplus: exports exceed imports Trade deficit: imports exceed exports 1-18

19
Figure 1.5 U.S. exports and imports, 1869-2011
Sources: Imports and exports of goods and services: 1869–1959 from Historical Statistics of the United States, Colonial Times to 1970, pp. 864–865; 1960 onward from FRED database, Federal Reserve Bank of St. Louis, research.stlouisfed.org/fred2/series/BOPX and BOPM; nominal output: 1869–1928 from Christina D. Romer, “The Prewar Business Cycle Reconsidered: New Estimates of Gross National Product, 1869–1908,” Journal of Political Economy, 97, 1 (February 1989), pp. 22–23; 1929 onward from FRED database, series GDPA. 1-19
, pp. 22–23; 1929 onward from FRED database, series GDPA")
20
United States Trade Over Time
1-20

21
1-21
22
What Macroeconomics Is About
Macroeconomic Policy Fiscal policy: government spending and taxation Effects of changes in federal budget U.S. experience in Fig. 1.6 Relation to trade deficit? Monetary policy: growth of money supply; determined by central bank; the Fed in U.S. 1-22

23
Figure 1.6 U.S. Federal government spending and tax collections, 1869-2011
Sources: Federal spending and receipts for 1869–1929 from Historical Statistics of the United States, Colonial Times to 1970, p. 1104; GNP 1869–1928 from Christina D. Romer, “The Prewar Business Cycle Reconsidered: New Estimates of Gross National Product, 1869–1908,” Journal of Political Economy, 97, 1 (February 1989), pp. 22–23; GNP for 1929 from FRED database, Federal Reserve Bank of St. Louis, Research.stlouisfed.org/fred2/series/GDPA; Federal spending and receipts as percentage of output, 1930–2011 from Historical Tables, Budget of the U.S. Government, Table 1.2. 1-23
, pp. 22–23; GNP for 1929 from FRED database, Federal Reserve Bank of St. Louis, Research.stlouisfed.org/fred2/series/GDPA; Federal spending and receipts as percentage of output, 1930–2011 from Historical Tables, Budget of the U.S. Government, Table")
24
1-24

25
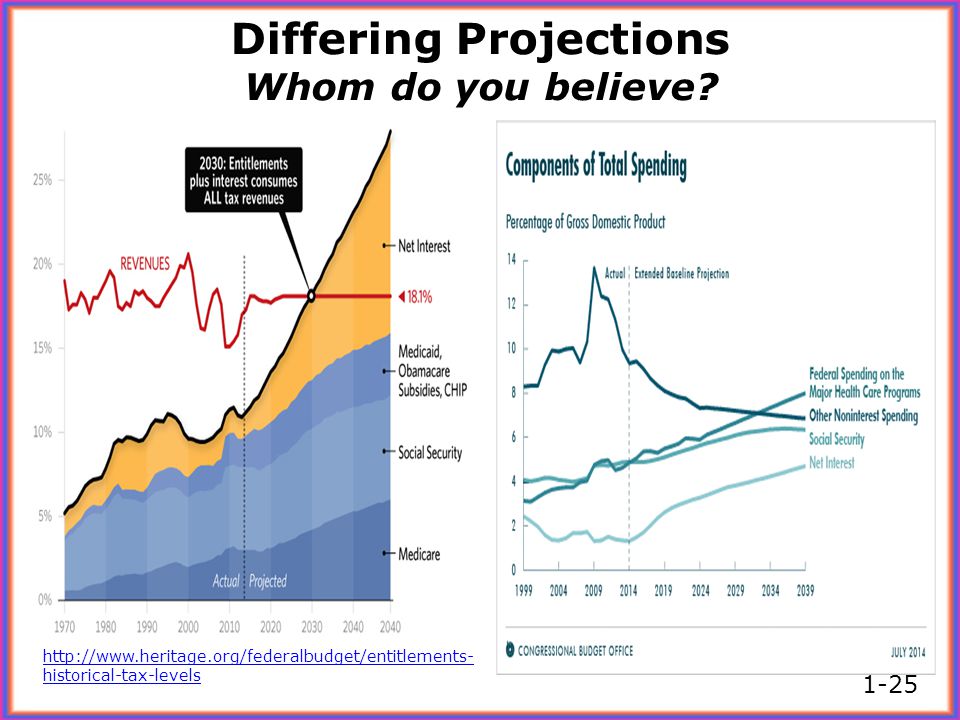
Differing Projections Whom do you believe?
1-25
26
1-26

27
1-27

28
What Macroeconomists Is About and What it Does
Aggregation Aggregation: summing individual economic variables to obtain economywide totals Distinguishes microeconomics (disaggregated) from macroeconomics (aggregated) Macroeconomic forecasting Relatively few economists make forecasts Forecasting is very difficult Macroeconomic analysis Private and public sector economists—analyze current conditions Does having many economists ensure good macroeconomic policies? No, since politicians, not economists, make major decisions 1-28
 from macroeconomics (aggregated) Macroeconomic forecasting. Relatively few economists make forecasts. Forecasting is very difficult. Macroeconomic analysis. Private and public sector economists—analyze current conditions. Does having many economists ensure good macroeconomic policies No, since politicians, not economists, make major decisions")
29
What Macroeconomists Do
Macroeconomic research Goal: to make general statements about how the economy works Theoretical and empirical research are necessary for forecasting and economic analysis Economic theory: a set of ideas about the economy, organized in a logical framework Economic model: a simplified description of some aspect of the economy Usefulness of economic theory or models depends on reasonableness of assumptions, possibility of being applied to real problems, empirically testable implications, theoretical results consistent with real-world data 1-29

30
What Macroeconomists Do
In Touch with Data and Research: Developing and Testing an Economic Theory Step 1: State the research question Step 2: Make provisional assumptions Step 3: Work out the implications of the theory Step 4: Conduct an empirical analysis to compare the implications of the theory with the data Step 5: Evaluate the results of your comparisons Data development—very important for making data more useful 1-30

31
Why Macroeconomists Disagree
Positive vs. normative analysis Positive analysis: examines the economic consequences of a policy Normative analysis: determines whether a policy should be used Solved Problem: Positive or Normative • A tax cut will raise interest rates. • Payroll taxes should not be cut unless capital gains taxes are cut also. • A reduction in the payroll tax would primarily benefit poor and middle-class workers. • Payroll taxes are too high. • A cut in the payroll tax would improve the President’s popularity ratings. 1-31

32
Why Macroeconomists Disagree
Classicals vs. Keynesians The classical approach The economy works well on its own The “invisible hand”: the idea that if there are free markets and individuals conduct their economic affairs in their own best interests, the overall economy will work well Wages and prices adjust rapidly to get to equilibrium Equilibrium: a situation in which the quantities demanded and supplied are equal Changes in wages and prices are signals that coordinate people’s actions Result: Government should have only a limited role in the economy 1-32

33
Why Macroeconomists Disagree
Classicals vs. Keynesians The Keynesian approach The Great Depression: Classical theory failed because high unemployment was persistent Keynes: Persistent unemployment occurs because wages and prices adjust slowly, so markets remain out of equilibrium for long periods Conclusion: Government should intervene to restore full employment The evolution of the classical-Keynesian debate Keynesians dominated from WWII to 1970 Stagflation led to a classical comeback in the 1970s Last 30 years: excellent research with both approaches 1-33

34
Why Macroeconomists Disagree
A unified approach to macroeconomics Textbook uses a single model to present both classical and Keynesian ideas Three markets: goods, assets, labor Model starts with microfoundations: individual behavior Long run: wages and prices are perfectly flexible Short run: Classical case—flexible wages and prices; Keynesian case—wages and prices are slow to adjust 1-34

35
Conservative, Classical Liberal Reform (Modern) Liberal, Socialist
CONSTRAINED VISION Conservative, Classical Liberal UNCONSTRAINED VISION Reform (Modern) Liberal, Socialist Human Nature Cannot and should not be changed by others. Can and sometimes should be changed. Individual vs. Society The individual and his/her freedom is more important than the collective. “Society” is nothing more than some total of the individuals who make it up. The collective is more important than the individual. Society shapes the individual. Private Property Yes. Property rights are critical and must be enforced. It is a reasonable role for govern-ment to ensure property rights. No. At least not complete private property rights. Distributive Justice Process justice must be preserved at all costs. It is the glue that holds society together and directs self-interest into social benefit. Focus on entitlement and process. Equality means “parity of privileges.” It is process equality. Justice is tied to results. Therefore different standards may apply to different individuals. The focus must be on “end-states”. Equality means nothing outside of social outcomes. It is “end-state equality.” Central Planning De-centralize. Individual knowledge and judgment are imperfect. Uncoordinated processes are best. This maximizes freedom, flexibility, use of proximity. Use markets—they work. Centralized. Some individuals are better able to decide for others. Coordinate processes. Why act without reason? Use government—it works. Social Change Is evolutionary. Follows from human progress. Allowing natural evolution provides stability. Social engineering (direct design) by knowledgeable leaders is more efficient and leads to chosen outcomes.
 Liberal, Socialist. Human Nature. Cannot and should not be changed by others. Can and sometimes should be changed. Individual vs. Society. The individual and his/her freedom is more important than the collective. Society is nothing more than some total of the individuals who make it up. The collective is more important than the individual. Society shapes the individual. Private Property. Yes. Property rights are critical and must be enforced. It is a reasonable role for govern-ment to ensure property rights. No. At least not complete private property rights. Distributive Justice. Process justice must be preserved at all costs. It is the glue that holds society together and directs self-interest into social benefit. Focus on entitlement and process. Equality means parity of privileges. It is process equality. Justice is tied to results. Therefore different standards may apply to different individuals. The focus must be on end-states . Equality means nothing outside of social outcomes. It is end-state equality. Central Planning. De-centralize. Individual knowledge and judgment are imperfect. Uncoordinated processes are best. This maximizes freedom, flexibility, use of proximity. Use markets—they work. Centralized. Some individuals are better able to decide for others. Coordinate processes. Why act without reason Use government—it works. Social Change. Is evolutionary. Follows from human progress. Allowing natural evolution provides stability. Social engineering (direct design) by knowledgeable leaders is more efficient and leads to chosen outcomes.")
36
Defining Questions What is your view of human nature (your opinion of people in society)? What is the relative importance of the individual and society? Of individual freedoms vs. collective interests? Is private property just? Does it make sense? Is private property in the best interests of the individual and society? What constitutes distributive justice? Do markets actually work? Does government actually work? Are government intervention and central planning appropriate? Should social processes be engineered? 1-36

37
Government Intervention
Ideology Government Intervention in Economic Affairs For Against Government Intervention in Social/Person Affairs Against For 1-37

38
The Fun Stuff Some Excellent Data "Fear the Boom and Bust" Global Financial Crisis Explained 1-38

39
What Are Society’s Major Economic Problems Today?
Rank the importance to them of the following economic issues: Unemployment inflation economic growth stagnant incomes the trade deficit Social Security the government budget income inequality. What are some other issues?

40
1-40

Similar presentations


