Download presentation
Presentation is loading. Please wait.

1
Stats: Modeling the World
Chapter 12 Sample Surveys

2
The WHO of our data…. The population of interest is the entire group of people/things that we wish to study. Since we want to know things about the population, we need to figure out how to gather that data!!

3
Let’s “sample” them all!!
A census is a “sample” of the entire population. How many “G’s”?

4
Problems with a Census So why doesn’t a census always work? - difficult or impractical to complete - populations shift in their demographics - too complex in terms of time and budget

5
Taking a Survey Often, we ask questions of a small group (called a sample) in the hope of learning something about the entire population… These are called opinion polls or surveys
 in the hope of learning something about the entire population… These are called opinion polls or surveys")
6
The ultimate question…
The ultimate question…. Does every sample represent the population fairly?

7
Literary Digest Poll…

8
The Moral of the Story… The phrase Garbage In – Garbage Out applies.
If your sample was chosen in a poor manner, it doesn’t matter how many people you surveyed, bad data will still produce bad results. The phrase Garbage In – Garbage Out applies. In order to draw valid conclusions, you need a sample (no matter the size) that well represents the population!
 that well represents the population!")
9
NFL Exit Poll

10
Getting a Representative Sample…
Making sure that, on average, the sample looks like the rest of the population allows us to draw conclusions based on our data. A small sample, IF it is chosen correctly, can represent the entire population!

11
Parameters vs Statistics
A population parameter is a value that describes the entire population. This value is rarely known and typically unknowable due to constant change Our goal is usually to estimate the parameter. A sample statistic is a value that is found from the sample data. We use the sample to estimate the parameter.

12
Try it!! This summer, when I went to the grocery store, I kept track of my receipts to help with budgeting. I wrote down how much I spent at Smith’s during June and July. On average, I spent $ a) What is the parameter I'm trying to estimate? b) If Smith's took a sample of customers and checked their receipts, what parameter is Smith's trying to estimate?
 What is the parameter I m trying to estimate b) If Smith s took a sample of customers and checked their receipts, what parameter is Smith s trying to estimate")
13
So how do we gather statistics?
Picking a sample at random protects us from the influences of all the features of our population, even ones that we may not have thought of. Statistical sampling uses random chance, not human choice!!

14
Jelly Blubbers… Materials needed… JellyBlubber colony Ruler Calculator
Data Sheet

15
JellyBlubbers… What is our population of interest? What is the population parameter?

16
Judgmental Sample Select 5 Jelly Blubbers that, in your judgment, are representative of the population of Jelly Blubbers. Record the lengths of your five Jelly Blubbers in millimeters and find the average. Plot your average on the whiteboard…

17
Simple Random Sample (SRS)
A Simple Random Sample has two requirements… - every person has an equal chance and - every combination of people has an equal chance of being selected.

18
To select an SRS “Label and Table” 1) Assign numbers to each of the subjects 2) Use a random table to select the sample. Table Example:
 Assign numbers to each of the subjects 2) Use a random table to select the sample. Table Example:")
19
Simple Random Sample Use the 1st line of your random number table to choose 5 JellyBlubbers and measure the length in mm. Find the average length and plot it on the board. Advantages? Disadvantages?

20
Simple Random Sample: Advantages: Disadvantages:

21
Systematic Sample A systematic sample involves every nth object. This is useful when you believe that the order of the list will not affect the results of your survey. To get a systematic sample: 1) Determine a starting place using a random table 2) From your starting place, sample every nth object on the list.
 Determine a starting place using a random table 2) From your starting place, sample every nth object on the list.")
22
Systematic Random Sample
Since we have 100 JB’s and we want a sample of 5, we need to count every _____th JB. Use the 2nd line of your RNT to choose a JB as a starting place. Advantages? Disadvantages?

23
Cluster Sample A cluster sample involves splitting the population into subgroups. This is useful when you think all subgroups are pretty similar and each group will adequately represent the population. (ALL from SOME) To get a cluster sample: 1) Split your population into heterogeneous groups, called clusters 2) Use an SRS to determine which cluster(s) to sample
 To get a cluster sample: 1) Split your population into heterogeneous groups, called clusters 2) Use an SRS to determine which cluster(s) to sample")
24
Cluster Random Sample Using the 3rd line of your RNT, pick a random JB to measure. Then choose the two JBs before it and the two JBs after it and measure those too. Plot your average! Advantages? Disadvantages?

25
Stratified Random Sample
A stratified sample is more complicated than the others. It also involves splitting the population into subgroups. This is useful when you think certain characteristics may be an influence in the data. (SOME from ALL) To get a stratified sample: 1) Split your population into homogeneous groups, called strata 2) Within each strata, use an SRS to determine who is sampled 3) Combine the results from each strata
 To get a stratified sample: 1) Split your population into homogeneous groups, called strata 2) Within each strata, use an SRS to determine who is sampled 3) Combine the results from each strata")
26
Stratified Random Sample
Using the 4rd and 5th lines of your RNT, pick a random JB to measure from each strata. Plot your average! Advantages? Disadvantages?

28
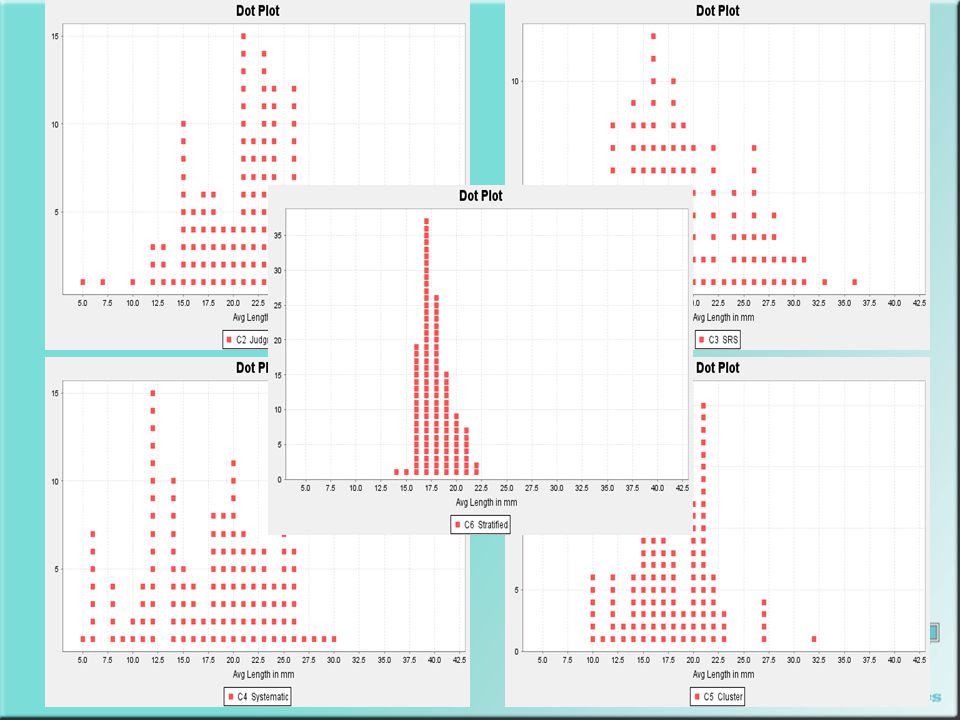
About the Lab… Did we all get the same results each time? Does each graph look alike? Which one does the best job of predicting JB length? Why?

29
Other ways to sample…. Multistage Sampling Voluntary Response Sampling Convenience Sampling

30
Random-random sample practice
simple random sample convenience sample cluster sample voluntary response systematic sample stratified sample JHS Students TU alumni Scientific American magazine subscribers Oklahomans national pet stores Tulsa Public Schools middle school students

31
Try it!! What kind of sampling method is used?
We want to know what percentage of local doctors accept Medicare patients. We call the offices of 50 doctors randomly selected from the local Yellow Pages. We want to know what percentage of local businesses anticipate hiring additional employees in the upcoming month. We randomly select a page in the Yellow Pages and call every business on the page. We want to know if students at our school are satisfied with the food available on campus. We go to the cafeteria and interview every 10th person in line.

32
Watch out for Bias Bias means that something about the sample’s design has systematically distorted the result so that the sample does not reflect or even approximate reality. There is usually no way to fix a biased sample and no way to salvage useful information from it.

33
Problems to watch for… Sometimes the sampling frame (the list from which we sample from) is difficult to obtain or even to define. This creates a problem because the people who are left out of the list may differ from the people on the list.
 is difficult to obtain or even to define. This creates a problem because the people who are left out of the list may differ from the people on the list.")
34
Problems to watch for… Many samples suffer from a bias called undercoverage, in which some portion of the population is not sampled at all or has a smaller representation in the sample than it has in the actual population.

35
Problems to watch for… A major issue in sampling is nonresponse bias, where someone who is chosen for the sample cannot be contacted or refuses to cooperate. The problem is that those who don’t respond may differ from those who did respond.

36
In your POD folder/notes…

37
Problems to watch for… Another major issue for surveys is known as response bias. (not be confused with non-response!) Response bias refers to anything in the survey that influences the responses, such as wanting to please the interviewer, not wanting to answer personal or legal questions, etc.
 Response bias refers to anything in the survey that influences the responses, such as wanting to please the interviewer, not wanting to answer personal or legal questions, etc.")
38
Problems to watch for… Watch out for the wording of the question in a survey, as it can also influence the responses. Asking a question with a leading statement is a good way to bias the responses.

39
How to combat bias… Look for bias in any survey you encounter. - If you are developing your own survey, critique your survey before gathering data. - Spend your resources and time trying to reduce bias - Pretest your survey so that you can make changes before it is too late. - Report your sampling method in detail!

40
Chapter 2/12 Review… One Minute Paper
POD #6 8/29/2011 Quiz Review Chapter 2/12 Review… One Minute Paper For each topic below, write a few sentences briefly summarizing the concept. Then rate yourself on each concept with Green (Good to Go!), Yellow (Kind of shaky), or Red (Whoa! Help me!) The W’s of Data Identifying the Population, Parameter, Sample, and Statistic Identifying the type of sampling method used Using a random number table to choose a sample Classroom Website:
, Yellow (Kind of shaky), or Red (Whoa! Help me!) The W’s of Data. Identifying the Population, Parameter, Sample, and Statistic. Identifying the type of sampling method used. Using a random number table to choose a sample. Classroom Website:")
41
POD #7 8/30/ #27 For the other options, determine the sampling method. What about bias?

Similar presentations