Download presentation
Presentation is loading. Please wait.

1
Interpretation of DEXA
Bone Densitometry Interpretation of DEXA

2
Osteoporosis

3
Osteoporosis Osteoporosis is the most common metabolic bone disorder. It has been defined by the National Institutes of Health as an age-related disorder characterized by decreased bone mass and increased susceptibility to fractures in the absence of other recognizable causes of bone loss.

4
Osteoporosis Type 1. involutional osteoporosis affects mainly trabecular bone, occurs in women during the years after the menopause, and is related to a lack of estrogen. This is thought to account for wrist and vertebral crush fractures, which occur through areas of principally trabecular bone. Type 2. senile involutional osteoporosis. The fractures of old age seen at the hip, proximal humerus, pelvis and asymptomatic vertebral wedge fractures. This affects both trabecular and cortical bone and represents progressive loss of bone mass from the peak around the age of years. Secondary osteoporosis is due to an underlying medical condition, such as renal disease, malabsorption, or hormonal imbalance, or to medical treatment such as steroids or certain anticonvulsants

5
Osteoporosis Risk factors Smoking Alcohol Poor diet Lack of exercise
may be superimposed upon either involutional or secondary osteoporosis, including : Smoking Alcohol Poor diet Lack of exercise An early menopause Strong family history Small frame

6
Osteoporosis The normal rate of bone loss is 2% per year, hence 20-40% of the female bone mass is already lost by the age of 65 years of age, beginning before the menopause and accelerating afterwards

7
Osteoporosis Osteoporosis progression over 2Y UC Steroids 59F

8
Osteoporosis Bone mass is the major determinant of bone strength that can be measured by non-invasive techniques, and accounts for 75-85% of this parameter

9
Osteoporosis Bone densitometry is clinically indicated for the detection and assessment of osteoporosis and for the evaluation and monitoring of several diseases and therapies. These include: The detection of osteoporosis and assessment of its severity. Evaluation of perimenopausal women for the initiation of estrogen therapy. Evaluation of patients with metabolic diseases that affect the skeleton. Monitoring of treatment and evaluation of disease course. In addition it may be useful as an epidemiological tool and possibly in the future for screening American Society of Bone and Mineral Research

10
Measurement

11
Osteoporosis Measurement
Plain film, Subjective, Radiogrammetry, Osteogram SPA DPA DEXA QCT US MRI Quadratical equations

12
Osteoporosis Measurement
Plain film, Subjective, Radiogrammetry, Osteogram SPA DPA DEXA QCT US MRI Quadratical equations

13
Osteoporosis Measurement
Plain film, Subjective, Radiogrammetry, Osteogram SPA DPA DEXA QCT US MRI Quadratical equations

14
Osteoporosis Measurement
Plain film, Subjective, Radiogrammetry, Osteogram SPA DPA DEXA QCT US MRI Quadratical equations

15
Osteoporosis Measurement
Plain film, Subjective, Radiogrammetry, Osteogram SPA DPA DEXA QCT US MRI Quadratical equations

16
DEXA Because photons of different energy are differentially attenuated by bone and soft-tissues, by measuring the percentage of each transmitted beam and then applying simple simultaneous equations, the absorption by bone alone and hence bone density can be calculated. This measurement is not a true density but rather an areal density, represented in gms/cm2

17
DEXA y x

18
DEXA DEXA has very high accuracy and precision
(the difference in the measurement from a known standard) and precision (observed deviation of serial measurements with time) both short and long term to within 1% at the hip and spine
 and. precision. (observed deviation of serial measurements with time) both short and long term. to within 1% at the hip and spine.")
19
DEXA DEXA is at present the most precise measurement of BMD
QCT is more sensitive to change

20
DEXA Interpretation

21
DEXA Interpretation

22
Find out as much relevant information as possible

23
Find out as much relevant information as possible

24
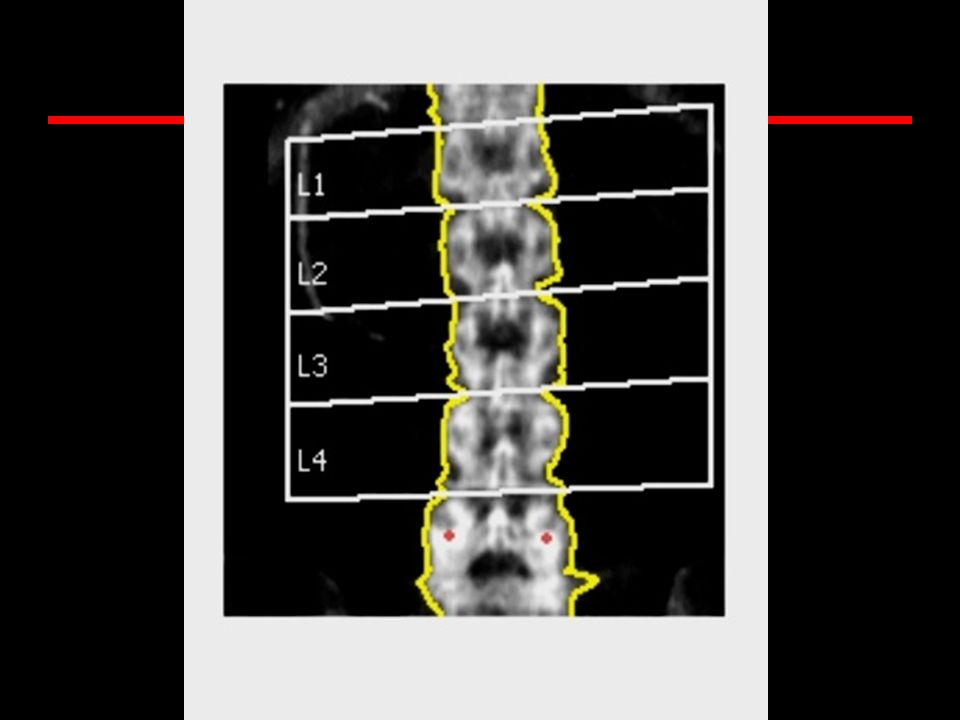
Spine Scan

25
Bone Densitometry DEXA spine check list
Note the age, sex, ethnicity and weight Does this match the reference ranges? Is the bottom of L4 roughly at the level of the iliac crests Are there any ribs on L1 Scoliosis Are the vertebrae correctly divided Anything in the soft tissue

26
Vertebroplasty

27
Calcium Tablets

28
Transitional vertebrae
Wrong levels

29
Bone Densitometry DEXA spine check list
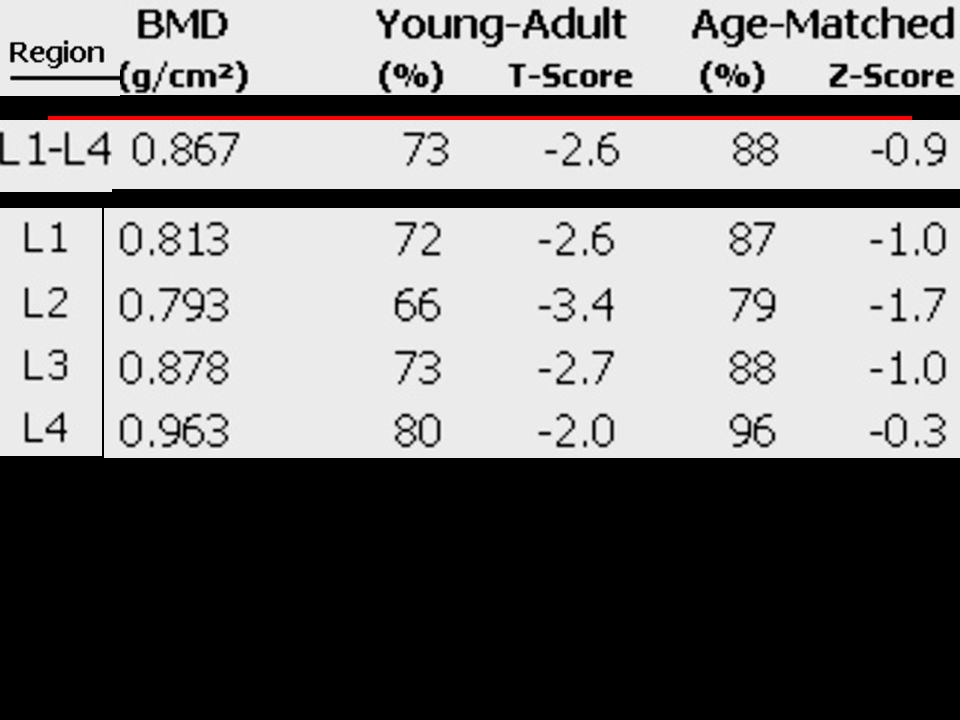
Look for significant level to level variations 15-20% difference between adjacent levels

30
DEXA, what makes a good scan?
5-15 Lines of Iliac Crest. I recommend 1/2 of L5. 5-10 Lines of T12. 2 cm of tissue on both sides of the spine. Spine should be straight. No metal in spine.

31
Common problems with spine scans.
Spine isn’t straight. Scan starts in sacrum. Scan stops too soon. Wrong scan mode. Scan doesn’t include L5.

32
What is a scan mode? This determines the speed the arm travels, and how much radiation the patient receives. The bigger the patient, the more radiation you’ll require. The smaller the patient, the less radiation you’ll require.

33
IQ Scan Modes

34
IQ Patient Thickness 12-15 cm is Medium 750 15-22 cm is Fast 3000
Most patients fall in the Fast 3000 range.

35
Bone Densitometry In preventing Fxs it is the worst scenario that matters. Generally a slight increase in density as descend the L spine. Approx 6% increase between L1 and L4.

36
Typical Spine scan

37
What’s wrong with this scan?
L1 is really T12

38
What’s wrong with this scan?
Divisions don’t account for scoliosis

39
What’s wrong with this scan?
Everything

40
Femur Scan

41
DEXA Femur check list Hints for a good scan.
Patient should be straight on table. Pack patient with rice bags. Shaft of femur should be straight. Rotate leg inward, this will hide the lesser trochanter.

42
DEXA Femur check list Hints for a good scan.
The Wards area is roughly half the neck area Trochanteric area 8-14cm2 in women, 10-16cm2 in men Check left and right and state side being used in report.

43
nonIQ DPX scanning Show 15-30 scan lines prior to seeing ischium.
There should be little or no lesser Trochanter. Straight shaft. 25 lines or more above the Greater Trochanter.

44
Typical Femur Scan

45
What’s wrong with this scan?
Too much shaft

46
What’s wrong with this scan?
Insufficient tissue below neck

47
What’s wrong with this scan?
Set up for wrong leg

48
What’s wrong with this scan?
Includes ischium

49
Reporting

50
Bone Densitometry WHO uses T scores
Normal > -1 SD below young adult Osteopenia SD Osteoporosis <-2.5 SD Established (Manifest) Osteoporosis + Fxs, usually spine, hip, proximal humerus, wrist, rib
 Osteoporosis. + Fxs, usually spine, hip, proximal humerus, wrist, rib.")
51
Macro DEXA Template

52
Bone Densitometry Never round up figures
-1 is osteopenia, is normal -2.5 is osteoporosis, is osteopenia

53
Example

54
Bone Densitometry 44F

55
Bone Densitometry 44F

56
Bone Densitometry 44F

57
Bone Densitometry 44F

58
Bone Densitometry T score is compared to reference population, years, same sex, any race, any weight. Z score is matched for age, sex, weight and ethnicity.

59
Two possible reasons for this lady’s Z score being
worse than the T score?

60
Two possible reasons for this lady’s Z score being
worse than the T score? Obesity and race

61
The T score is based on a white, same sex, age 20-40 population
The T score is based on a white, same sex, age population. The patient's BMD is compared to this population's BMD. A lower T score means that the patient BMD is low compared to this young, healthy normal weight population The Z score compares the patient to an adjusted population, it adjusts for age, weight, and ethnic background. The Z score can be lower than the T score for the patient, if the average patient in this population has a higher BMD than the average in the T score population. This can be seen in patients with higher weights, (which increases bone density), and in African American groups, (which show increased bone density). If the patients comparison group has a generally higher bone density, then it is possible to have a poorer comparison to others of same age, than to younger comparisons in generally lower density group.
, and in African American groups, (which show increased bone density). If the patients comparison group has a generally higher bone density, then it is possible to have a poorer comparison to others of same age, than to younger comparisons in generally lower density group.")
62
260 lb man, young Z above young T

63
Black as Black as White

64
Black as > Black as White T same Z up <

65
Bone Densitometry Weight gain/loss and Z
Weight gain (or loss) will not affect Z score comparison, since Z scores are weight matched, but should cause an increase (or decrease) in absolute BMD. An increase in weight, pushes up the reference range, and therefore the Z score may seem reduced, and vice versa. 2.2lbs=1Kg
 will not affect Z score comparison, since Z scores are weight matched, but should cause an increase (or decrease) in absolute BMD. An increase in weight, pushes up the reference range, and therefore the Z score may seem reduced, and vice versa. 2.2lbs=1Kg.")
66
Bone Densitometry Weight gain/loss and T
Weight gain (or loss) should cause an increase (or decrease) in absolute BMD. Weight gain (or loss) will affect T score comparison, since reference range will not have changed. Hence an increase in weight with a corresponding increase in bone density, will look like a good improvement in T score, but fracture risk is unchanged.
 should cause an increase (or decrease) in absolute BMD. Weight gain (or loss) will affect T score comparison, since reference range will not have changed. Hence an increase in weight with a corresponding increase in bone density, will look like a good improvement in T score, but fracture risk is unchanged.")
67
51F 90Kg 53F 51Kg

68
= significant increase in fracture risk
1.172 1.176 SD = Both between -2 and -3 SD below mean for age 1Y, 16lb gain, 5% BMD loss = significant increase in fracture risk

69
Comparison with previous

70
Bone Densitometry Comparison with previous
Are the studies comparable Always compare like with like Thornton L1-4 4th and Lewis (previously L2-4) Any intervening events Cannot compare Hologic and Lunar
 Any intervening events. Cannot compare Hologic and Lunar.")
71
Bone Densitometry Comparison with previous
David Sartoris’s previous studies that do not mention the region or levels measured, were standardized for L1-4 and the femoral neck. He usually did not quote BMD. Many previous studies were prior to the current database. Use the percent young adult as a guide to percentage change.

72
Bone Densitometry Comparison with previous
If over a period of time there is an increase in BMD in the lower lumbar spine and decrease in the upper lumbar spine, it is likely there is OA of the lower facet joints, and the upper lumbar spine is a truer reflection of useful BMD.

73
Bone Densitometry Comparison with previous
Increase in BMD of the femoral neck can be due to calcar buttressing with OA of the hip.

74
Bone Densitometry Comparison with previous
If you want to eyeball the % for a comparison, use the young adult % since the reference range will not change with age. A static bone density is actually a good result over a significant period of time If a test is 1% precise, then a change has to be greater than 2% to be significant

75
Bone Densitometry Comparison with previous
If you would have expected the bone density to have fallen 4% in 2 years, and it is static, then this is a positive response to RX

76
Bone Densitometry Comparison with previous
Generally Rx affects all levels equally. OA does not.

77
Bone Densitometry Comparison with previous
55F

78
Bone Densitometry 55F

79
Bone Densitometry 55F

80
Bone Densitometry 55F

81
Children

82
Bone mass in healthy children
Radiology 1991;179:

83
Bone mass in healthy children
Increases with age, weight and pubertal Tanner stage. Tanner stage and weight are best predictors of bone mass. Age, sex, race, activity and diet are not good predictors, when weight and Tanner stage are controlled. Radiology 1991;179:

84
Bone mass in healthy children
Make sure we have at least the age and weight of the child, if not the Tanner stage. Radiology 1991;179:

85
BMD in children and adolescents

86
BMD in children and adolescents
BMD in children and adolescents- Female- L2-4- Lunar

87
BMD in children and adolescents
BMD in children and adolescents- Male- L2-4- Lunar

88
BMD in children and adolescents- Female- femur

89
BMD in children and adolescents- Male- femur

90
BMD in children and adolescents- Female- femoral neck

91
BMD in children and adolescents- Male- femoral neck

92
BMD in children and adolescents- Female- L2-4

93
BMD in children and adolescents- Male- femur

94
Cases

95
Cases

96
New Case 6 63F

97
5 63F

98
4 63F

99
3 63F

100
2 63F

101
Report Because of the previous laminectomy at L4, which may also be affecting the reading on the inferior aspect of L3, the BMD is averaged at L1-2. Note is also made of mild decrease in the L4 vertebral height. 1 63F

102
New Case

103
New Case 3 35F White 242lbs 62in

104
2 35F White 242lbs 62in

105
Report Because of the patients weight, the T score may not fully represent the fracture risk, and note should be made that the Z score is 1.7 SD below age and weight matched. 1 35F White 242lbs 62in

106
New Case

107
New Case 2 OGI 39M

108
Report The very low bone density is compatible with the known diagnosis of osteogenesis imperfecta. 1 39M

109
New Case

110
New Case 4 46 F

111
3 Calcified bile 46 F

112
2 46 F Calcified bile

113
Report Although the calcified bile is seen on the DEXA scan, it is outside the measured region and will not affect the reading. 1 46 F Calcified bile

114
New Case

115
New Case Black 2 47F

116
Report The Z score is worse than the T score at all levels because the the Z score is compared to weight and ethnicity and African American females naturally have a higher bone density than the standard Caucasian used for the T score, even at the age of 47. 1 African American 47F

117
New Case

118
New Case 2 49F 2Y8M gap Lx spine up, Fem neck down

119
Report A common cause for the bone density of the lumbar spine to increase whilst that of the femoral neck decreases over time is, the development of lower lumbar spine end plate sclerosis and facet osteophytes. 1 49F 2Y8M gap Lx spine up, Fem neck down

120
New Case

121
New Case T 2 Sacral agenesis 49F

122
Report It is likely that only L1 represents close to true bone density and use of femoral neck measurements alone is recommended. 1 Sacral agenesis 49F

123
New Case

124
New Case 3 Dense R femoral neck 50F

125
2 50F dense R femoral neck

126
Report In view of the significant discrepancy between the right femoral neck and lumbar spine measurements , radiographs of the right hip/pelvis are recommended. 1 50F dense R femoral neck

127
New Case

128
New Case 2d earlier 2d later 3 51F

129
2 51F Barium in diverticulum from recent enema

130
Report It was noticed that the patient has had a recent barium study and that barium may therefore falsely elevate the bone density. A repeat study is therfore recommended. 1 51F Barium in diverticulum from recent enema

131
New Case

132
New Case 53F 51Kg 6 yr later, 8Kg wt loss 47F 59Kg 2

133
47F 59Kg 53F 51Kg 1

134
Report As the patient loses weight the T score worsens at a faster rate than the Z score because the reference range for the Z score also is lowered. However with the loss of weight the fracture risk does not increase as much as the T score worsens. 1 6 yr later, 8Kg wt loss

135
New Case

136
New Case 3 60F

137
2 60F OA

138
Report Because of lower lumbar spine degenerative changes the lumbar spine should not be included in the study. 1 60F OA

139
New Case

140
New Case 3 Rec. repeat 54M ESLD s/p trans

141
New Case 2 Rec. repeat 54M ESLD s/p trans

142
Report Only technical error could account for such a finding and therefore repeat study is recommended. 1 54M ESLD s/p trans

143
New Case

144
New Case 15m earlier 15m later 2 76F response to Rx

145
Report If all levels increase in bone density over time, it is likely a response to treatment. 1 76F response to Rx

146
New Case

147
New Case 3 85M Bil THR

148
2 85M Bil THR

149
Report When the lumbar spine and hips cannot be used we turn to the distal radius and use the ultradistal measurement. 1 85M Bil THR

150
New Case

151
New Case 4 DEXA 51F

152
3 DEXA 51F

153
2 DEXA 51F

154
Report Increase in lumbar spine bone density is due to syndesmophytes and ligament ossification. 1 Ank Spond DEXA 51F

155
New Case

156
New Case 2 59M

157
Report Calcium anterior to the spine can increase apparent BMD. 1
DEXA pancreatic Cal 59M

158
New Case

159
New Case 2 50M

160
Report If the patient does not wish to divulge their personal details, only T score and not Z score can be produced. 1 DEXA no personal data 50M

161
New Case

162
New Case 4 59F

163
3 59F

164
2

165
Report Benign bone sclerosis such as Worth’s disease or Van Buchem’s, or a variant of osteopetrosis. Recommend repeat DEXA to check for spurious result. 1 High bone density 8SD 59F

166
New Case

167
New Case 4 62F

168
3 62F

169
MDP 2 62F

170
Report Benign sclerotic lesion L1 Levels may be incorrect. 1

171
New Case

172
New Case 76F

173
76F

174
Report When a vertebrae collapses, initially it will be of higher density. 1 DEXA L1 fracture 76F

175
New Case

176
New Case 65F

177
65F

178
1Y prior m prior DEXA with islet cell met to L2 65F

179
Report Look out for vertebrae with a different and unaccountable bone density, either higher or lower. 1 DEXA with islet cell met to L2 65F

180
New Case

181
New Case 44F

182
44F

183
Report 5’2”, 182lbs 1

184
New Case

185
New Case 55F

186
Report 1 55F

187
55F

188
Report Good response to Rx 1

189
New Case 54yo F with h/o pancreatic neuroendocrine tumor and small cell lymphoma on Fosamax

197
New Case

199
Report 1

200
Bone Densitometry DEPA
Gd153 Accuracy similar to QCT Less radiation than QCT Measures cortical and trabecular Less sensitive to early changes Affected by aortic Ca2+

201
DPX-IQ scanning Show 25-40 scan lines prior to seeing ischium.
There should be little or no lesser Trochanter. Straight shaft. 25 lines or more above Greater Trochanter.

202
Bone Densitometry QCT Single energy 97% accurate
Dual energy not routinely available 300mR Fat content adversely affects accuracy Difficult to reproduce positioning Can only measure trabecular bone 8X increase turnover of trabecular bone

203
IQ has version 4.3 and above

204
Non IQ has these versions
Version 1.15 for the DPXalpha Version 1.35 for the DPXL Version 3.65 for the DPX Version 1.15 for the DPXSF Can upgrade with the 3.65 u on all versions.

205
DPXIQ versus DPXnonIQ Spine measure and analysis are the same.
Scan modes vary depending on the type of DPX. Femur measuring is different. Femur analyzing is different. IQ and nonIQ are different animals.

206
How is IQ different? IQ offers unlimited patients in database
IQ offers Total Femur results, as well as Femoral Neck. IQ offers better resolution image. IQ offers automatic analysis of femurs. IQ offers better algorithms for femurs.

207
How is nonIQ different? Limited patients in database (3500 to 7500).
Offers only Femoral Neck Resolution is not nearly as good. Must manually analyze all femurs. Algorithms not as good for femurs.

208
SPINE SCANS FOR ALL TYPES OF DPX

209
IQ and non IQ, what makes a good scan?
5-15 Lines of Iliac Crest. I recommend 1/2 of L5. 5-10 Lines of T12. 2 cm of tissue on both sides of the spine. Spine should be straight. No metal in spine.

210
Common problems with spine scans.
Spine isn’t straight. Scan starts in sacrum. Scan stops too soon. Wrong scan mode. Scan doesn’t include L5.

211
nonIQ Scan Modes

212
Femur scans for DPX-IQ

213
Hints for a good scan. Patient should be straight on table.
Pack patient with rice bags. Shaft of femur should be straight. Rotate leg inward, this will hide the lesser Trochanter.

214
DPX-IQ scanning Show 25-40 scan lines prior to seeing ischium.
There should be little or no lesser Trochanter. Straight shaft. 25 lines or more above Greater Trochanter.

215
nonIQ DPX scanning Show 15-30 scan lines prior to seeing ischium.
There should be little or no lesser Trochanter. Straight shaft. 25 lines or more above the Greater Trochanter.

Similar presentations


 Translate into A Compression Fracture? S.L.>")

, confirmed after.>")
, Fellowship Diabetes/Endocrinology (AKUH), PG Dip Diab (UK) Consultant Endocrinologist.>")

>")
>")


 Dr Malith Kumarasinghe MBBS (Colombo)>")


