Download presentation
Presentation is loading. Please wait.

1
Cardiovascular Monitoring
Clinical Monitoring Arterial Blood Pressure Monitoring: Non invasive Invasive Usefulness for predicting fluid responsiveness Dr. Monica University College of Medical Sciences & GTB Hospital, Delhi

2
Monitoring in the past Finger on the Pulse

3
ASA Monitoring Guidelines
Standard I: Qualified anaesthesia personnel shall be present in the room throughout the conduct of all general anaesthetics, regional anaesthetics and monitored anaesthesia care. Standard II: During all anaesthetics, the patient’s oxygenation, ventilation, circulation and temperature shall be continually evaluated.

4
High Tech Patient Monitoring

5
Who is the best Monitor in the operating room?
The Anaesthesiologist The monitors however extend their range and increase their efficacy.

6
Clinical Monitoring of Cardiovascular system
Inspection, palpation and auscultation are fundamental elements of perioperative cardiovascular monitoring. Inspection : Mucous membranes, Skin color and Skin turgor provide clues about hydration, oxygenation and perfusion. Pallor Cyanosis (peripheral/ central)
")
7
Inspection of neck veins
s/o low, normal or high JVP. Elevated JVP: Congestive heart failure, Cor pulmonale Pulmonary embolism, Tamponade Iatrogenic fluid overload in surgical patients. Right ventricular infarction Simple clinical techniques like: Empirical estimation of fluid deficits and blood loss. Measurement of urine output Detection of altered mental status.

8
Palpation of accessible peripheral pulse
Coldness of extremities: sign of reduced cardiac output. Oedema : Pitting oedema is a cardinal feature of CHF. Palpation of accessible peripheral pulse Examination of cardiac rate and rhythm: Tachycardia : light anaesthesia, hypotension drug induced (atropine, glycopyrrolate). Bradycardia : increased vagal tone, inhalant anaesthetic overdose. Irregular rhythm: Atrial fibrillation, frequent ectopic beats or self limiting paroxysmal arrhythmias.
. Bradycardia : increased vagal tone, inhalant anaesthetic overdose. Irregular rhythm: Atrial fibrillation, frequent ectopic beats or self limiting paroxysmal arrhythmias.")
9
Pulse characteristics Bounding pulse: Hyperdynamic circulation
Slow rising: Aortic stenosis Water hammer: Aortic regurgitation Bifid pulse: HOCM, severe AR, AS+ AR Dicrotic pulse: severe Heart failure Pulsus alternans: Heart failure Symmetry : Radial, Brachial, Carotid, Femoral, Popliteal and pedal pulses . Reduced or absent pulse indicates obstruction proximally in arterial tree usually by thromboembolism or aortic dissection.

10
Auscultation/ Stethoscopy:
Palpation of any artery within the surgical field by the surgeon in case of hemodynamic instability. Capillary Refill Time : normal < 2 sec. >2 sec. suggestive of inadequate tissue perfusion. Auscultation/ Stethoscopy: Intraoperative monitoring with either precordial or esophageal stethoscope are the most common simple methods for monitoring circulation and ventilation in anaesthetized patients. 2 types: Precordial Esophageal

11
Precordial stethoscopy
2 types: Precordial Esophageal Precordial stethoscopy Simple, highly effective device. Monitors heart and respiratory function Heavy metal bell or accumulator attached to length of rubber or plastic extension tubing and monoaural earpiece. Electrically amplified stethoscope available which improve quality and clarity of heart and breath sounds.

12
Precordial Stethoscopes .

13
Esophageal Stethoscopy Soft, plastic catheter with a balloon covered distal opening.
Tip placed at junction of middle and lower third of esophagus

14
Advantages of esophageal stethoscopy
Breath and heart sounds heard clearly. Detects apnea, myocardial depression, arrythmias, endobronchial intubation, airway secretions, wheeze, air embolus etc. Temperature probe, ECG leads and atrial pacemaker electrodes can be incorporated. Limitation: can be used only in intubated patients

15
Complications Hypoxemia :
Unintended tracheobronchial placement or compression of membranous posterior trachea in infants. Loss down the esophagus Detachment of accoustic cuff Contraindication: Esophageal varices or strictures The current role of intra operative stethoscopy as a continuous monitor has become limited to special applications (Pediatric Anaesthesia and to institutions with limited resouces).
.")
16
Heart Rate / Pulse Rate Monitoring
Heart Rate measured from the ECG trace and Pulse Rate from a selectable pulse source, most common being pulse oximeter/IABP waveform / Automatic NIBP. Problems in HR monitoring: interference by artifacts caused by electrosurgical unit. Paced rhythms can cause problems. Pulse oximeter is of limited value in pts. with arterial occlusive disease or peripheral vasoconstriction. Pulse deficit – extent to which pulse rate is less than the heart rate. Example Atrial fibrillation, Electrical – mechanical dissociation or Pulseless electrical activity.

17
Blood Pressure Force exerted by circulating blood against any unit area of the vessel wall. One of the principal vital sign Depends on the Cardiac output and Peripheral resistance. Blood Pressure Monitoring: Indirect cuff devices Direct arterial cannulation and pressure transduction Noninvasive BP monitoring: Manual Intermittent techniques Automated Intermittent techniques Automated Continuous techniques

18
Manual Intermittent Techniques: Palpatory
Auscultatory Palpatory methods Rely on sphygmomanometer and mercury manometer to measure cuff pressure Riva- Rocci method: SBP measured by determining pressure at which palpated radial pulse disappeared as cuff was inflated. Return to flow technique: variation of Riva-Rocci method. SBP recorded during cuff deflation at which pulse reappears and is detected by palpation. Can be used with pulse oximeter or indwelling arterial catheter in ipsilateral arm.

19
Auscultatory method Originally described by Korotkoff in 1905.
Most commonly used. Uses Sphygmomanometer, cuff and stethoscope. Measures both SBP and DBP by auscultating sounds produced by arterial blood flow. Korotkoff sounds: Very low frequency sounds (25-50 Hz) produced by turbulent blood flow beyond the partially occluded cuff. Failure to identify initial Korotkoff sounds results in falsely low BP.
 produced by turbulent blood flow beyond the partially occluded cuff. Failure to identify initial Korotkoff sounds results in falsely low BP.")
20
Phases of Korotkoff sounds: 1.First appearance of sounds marking SBP.
II and III- Increasingly loud sounds. IV. Abrupt muffling of sounds V. No sounds Phase V provides better measure of DBP. Phase IV may be used in conditions where Korotkoff sounds remain audible despite complete deflation of cuff. Eg. AR, AV fistula and pregnancy.

21
Technical aspects Length of the cuff should be 80% and width
should be 40% of the circumference of the arm. Cuff should be applied snugly, with bladder centred over the artery. Rate of cuff deflation should be 2-3mmHg per heart beat Miscuffing: Use of inappropriate sized cuffs. Most common source of error . Too small cuff leads to false high BP and too large cuff will produce little error .

22
Adequate size of cuffs size Arm circumference (cm) Bladder size
Newborn 6-11 2.5x5 Infant 10-19 6x12 Child 18-26 9x18 Adult 25-35 12x23 Large arm 33-47 15x33 Thigh 46-66 18x36

23
Limitations of auscultatory method
Conditions of decreased peripheral flow or high dose vasopressor infusion can attenuate the sounds and underestimate the BP. Shivering decreases compliance of tissues under the cuff leading to Pseudohypertension. BP RELIES ON BLOOD FLOW HIGH OCCLUDING PRESSURE NEEDED

24
Discrepancy between Direct and Indirect BP measurements in shock (from Cohn JN. Blood pressure measurement in shock. JAMA 1967) Systolic BP Difference (Direct – Cuff) % Patients 0-10 mm Hg 11-20 mm Hg 28 21-30 mm Hg 22 >30 mm Hg 50
 % Patients mm Hg mm Hg mm Hg. 22. >30 mm Hg. 50.")
25
Automated Intermittent Techniques (Oscillometry)
Provide frequent, regular BP measurement. Utilize the Oscillometry principle. Arterial pulsation —› variation in cuff pressure during cuff deflation —› sensed by sensor —› used to measure BP. Point of maximum amplitude of arterial pulsations corresponds to MAP. SBP and DBP calculated from increasing and decreasing magnitude of oscillations acc. to empirically derived algorithm.

26
SBP identified as pressure at which pulsations are increasing and are at 25-50% of the maximum.
DBP is the most unreliable oscillometric measurement. Advantages: Uniform compression of the artery is not necessary No interference with noise Not sensitive to electrosurgical interference Work well with peripheral vasoconstriction Limitation : sensitive to patient’s arm movement.

28
Factors affecting BP determination
Cuff arm relationship: too small cuff overestimates BP. Site: cuff placed peripherally leads to increased SBP and decreased DBP. Arm Position: each 10cm vertical height above or below heart level, 7.5mm Hg should be added or subtracted. Arrhythmias: vulnerable to error.

29
Complications of non invasive BP measurement
Pain Petechiae and ecchymosis (patients on anti inflammatory drugs, steroids, anticoagulants) Limb edema Venous stasis and thrombophlebitis Peripheral neuropathy (median, ulnar, radial) Compartment syndrome (more common after prolonged periods of frequent cycles of measurement, trauma or impaired limb perfusion)
 Limb edema. Venous stasis and thrombophlebitis. Peripheral neuropathy (median, ulnar, radial) Compartment syndrome (more common after prolonged periods of frequent cycles of measurement, trauma or impaired limb perfusion)")
30
Finger BP measurement (Finapress) - Automated continuous technique
Finger BP measurement (Finapress) - Automated continuous technique. -Uses Penaz technique(arterial volume clamp method). - Device tends to track the MAP in digital arteries underlying the cuff by keeping the volume of the finger constant and thus nulling the transmural pressure. -Waveform displayed on screen.
 - Automated continuous technique. -Uses Penaz technique(arterial volume clamp method). - Device tends to track the MAP in digital arteries underlying the cuff by keeping the volume of the finger constant and thus nulling the transmural pressure. -Waveform displayed on screen.")
31
Advantages: It is an attempt to improve on the rapidity of determination of NIBP Correlates well with invasive BP in patients not in shock. Disadvantages: Compression of digital veins leads to suffusion of finger, temporary numbness. Less reliable when peripheral perfusion decreased. Very sensitive to correct placement on middle phalanx.

32
Vasotrac system Most advanced BP measurement device
Vasotrac system Most advanced BP measurement device. Accurately measures SBP, DBP, MAP by waveform analysis. Continuous, non invasive. Variable pressure applied by pressure sensing mechanism directly over artery. Counterpressure in artery produces waveform.

33
Invasive BP Monitoring
Arterial cannulation with continuous pressure transduction with waveform display is the accepted reference standard for BP monitoring. Catheter over needle technique by Barr in

34
Indications for Direct Arterial BP Monitoring
Small change in arterial perfusion pressure increases patient’s risk requiring beat to beat assessment (CAD, valvular heart disease). Wide variation in BP or intravascular volume is anticipated. Frequent blood sampling, especially ABG analysis is required. Assessment of BP can’t be done by other methods. Eg. – Cardiopulmonary bypass (nonpulsatile flow), dysrhythmias, marked obesity.
. Wide variation in BP or intravascular volume is anticipated. Frequent blood sampling, especially ABG analysis is required. Assessment of BP can’t be done by other methods. Eg. – Cardiopulmonary bypass (nonpulsatile flow), dysrhythmias, marked obesity.")
35
Contraindications Local infection Coagulopathy: may result in hematoma formation. Proximal obstruction: Thoracic outlet syndrome, Coarctation of aorta. Raynaud’s syndrome and Buerger’s disease

36
Radial Artery cannulation
Various techniques: Direct cannulation Transfixation Seldinger’s technique Doppler assisted 2-D USG assisted Surgical cutdown

37
Arterial cannulation

38
Transfixation technique

39
Alternative sites for arterial pressure monitoring
Ulnar artery Brachial artery Dorsalis pedis, Posterior tibial artery( generally for pediatric patients , Neurosurgery) and superficial temporal artery. Axillary artery and Femoral artery (safe, comfortable but increased risk of atherosclerotic embolization) Ulnar art safe. Brac art longer cath pref, safe. Other periph sites incl dp pt art. Reasonable altern to radial art espec in neurosurg. Modif allens test can be performed . Axill and femor art are consid safe ,comfortable but have incr risk of atheroscl embolization
 and superficial temporal artery. Axillary artery and Femoral artery (safe, comfortable but increased risk of atherosclerotic embolization) Ulnar art safe. Brac art longer cath pref, safe. Other periph sites incl dp pt art. Reasonable altern to radial art espec in neurosurg. Modif allens test can be performed . Axill and femor art are consid safe ,comfortable but have incr risk of atheroscl embolization.")
41
Complications of arterial pressure monitoring
Distal ischemia (0.1%) Pseudoaneurysm, arteriovenous fistula. Hemorrhage, hematoma Arterial embolization Local infection, sepsis Peripheral neuropathy Misinterpretation of data (equipment misuse) Factors for ischemia-vasospas arter ds, prev arter inj , thrombocytosis, shock, high dose vasopressor , prolonged cannulation,infection. Additional rare complications mostly assoc with technic prob or confounding medical problems. Last pt mostly attributed to equipment misuse.
 Pseudoaneurysm, arteriovenous fistula. Hemorrhage, hematoma. Arterial embolization. Local infection, sepsis. Peripheral neuropathy. Misinterpretation of data (equipment misuse) Factors for ischemia-vasospas arter ds, prev arter inj , thrombocytosis, shock, high dose vasopressor , prolonged cannulation,infection. Additional rare complications mostly assoc with technic prob or confounding medical problems. Last pt mostly attributed to equipment misuse.")
42
Arterial Pressure waveform
Results from ejection of blood from the LV into aorta during systole f/b peripheral arterial runoff of SV during diastole. Systolic components follow R wave in ECG. Consists of: Steep Pressure upstroke Peak Decline

43
Downslope interrupted by dicrotic notch, then continues to decline during diastole after T wave of ECG. Dicrotic notch directly in central aorta is called incisura(rel. to closure of aortic valve). Systolic upstroke of radial artery trace msec after R wave of ECG (time to travel from heart to radial artery to transducer). MAP by area under arterial pressure wave divided by beat period. 3rd pt this reflects sum of times reqd for spread of wave from heart to periph radial art to transducer.

44
Distal Pulse Amplification Central Aorta to periphery: - Arterial upstroke becomes steeper - Systolic peak higher - Dicrotic notch appears later - Diastolic wave more prominent - End diastolic pressure becomes lower One of imp featuresof iabp waveform is phenom of As arter pulse wave travels from

45
Arteriolar level is major site of resistance to blood flow
Arteriolar level is major site of resistance to blood flow. Causes augmentation of upstream pressure pulsations because of wave reflection.

46
Elderly patients: Decreased arterial distensibility leads to: Early return of reflected pressure wave causing increasing Pulse pressure. Late systolic pressure peak. Disappearance of diastolic pressure wave.

47
Interpretation of Arterial tracings
Contains a great deal of hemodynamic information. Heart rate and rhythm: role in patients with pacemaker or electrocautery which can distort ECG. Pulse pressure: information about fluid status and valvular competence . Respiratory variation and volume status

48
Qualitative estimation of hemodynamic indices
Qualitative estimation of hemodynamic indices Contractility: rate of pressure rise during systole Stroke volume: area under aortic pressure curve Vascular resistance: presence of dicrotic notch

49
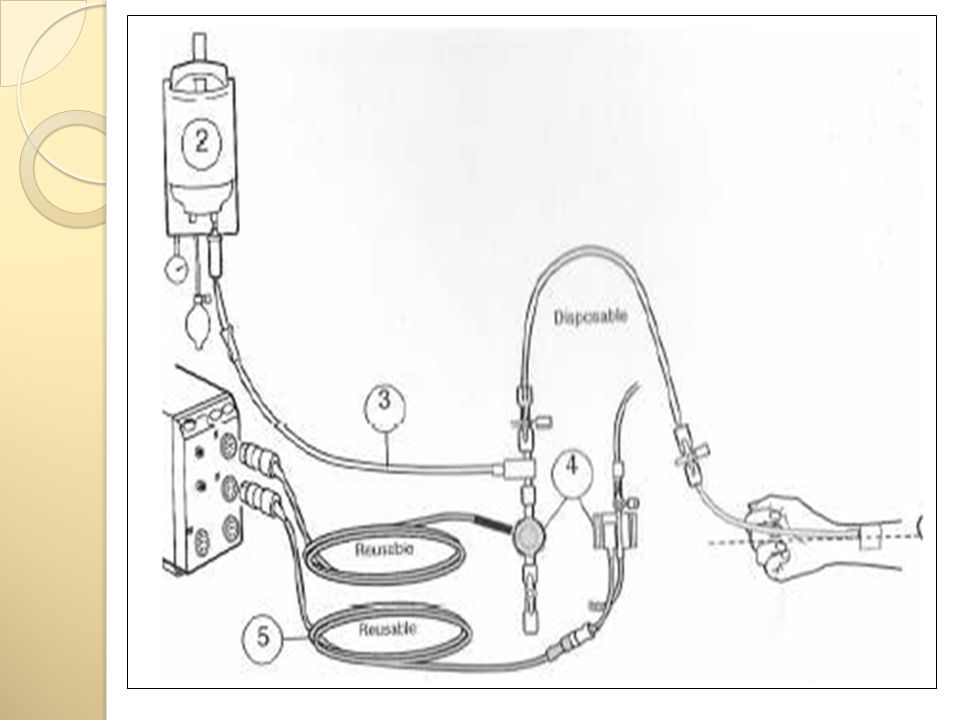
Components of IABP system
Intra-arterial cannula Coupling system Pressure transducer Infusion flushing system Signal processor, amplifier and display

51
Components of IABP measurement system
Intra arterial cannula: Short, narrow cannula (20G or smaller) made of Teflon to decrease risk of arterial thrombus formation. Risk of arterial thrombus directly proportional to diameter of cannula. Coupling system: Consists of pressure tubing, stopcocks and a continuous flushing device. Tubing should be short, wide and non-compliant (stiff) to reduce damping. Major source of distortion of arterial pressure tracings.
 made of Teflon to decrease risk of arterial thrombus formation. Risk of arterial thrombus directly proportional to diameter of cannula. Coupling system: Consists of pressure tubing, stopcocks and a continuous flushing device. Tubing should be short, wide and non-compliant (stiff) to reduce damping. Major source of distortion of arterial pressure tracings.")
52
Pressure Transducer The device that converts the Intra arterial pressure into an electrical signal. A critical part of transducer is the diaphragm which acts to link fluid wave to the electrical input. When the diaphragm is distorted by a change in pressure, voltages are altered across the variable resistors of wheatstone bridge contained in the transducer. This in turn produces change in current which is electrically converted and displayed. Most transducers are of resistance type. Has stiff, low compliance pressure sensing diaphragm. Works basically on wheatstone bridge principle.

53
Wheatstone bridge Consists of a common source of elect current and galvan that connects 2 paral branches cont 4 resistors. Strain gauge transforms strain into proport change in resistance . 4 strain gauges form 4 resistorsof ws bridge. Resist of 2 strain gauges on opp sides inc and other 2 dec. change in resis meas along with current , electr conv and displayed as systolic dias and map.

54
Infusion/ flushing system:
Plain 0.9% saline pressurized to 300 mmHg and connected to fluid filled tubing via flush system. Slow infusion at 1-3 ml/hr to maintain patency. Intermittent flushing with 2-3ml can be done. Dilute concentration of heparin (1-2 U/ml). Adverse effect- Heparin induced Thrombocytopenia Signal processor, amplifier and display: Signal relayed by pressure transducer to microprocessor which filters, amplifies, analyses and displays it as waveform of Pressure vs Time.
. Adverse effect- Heparin induced Thrombocytopenia. Signal processor, amplifier and display: Signal relayed by pressure transducer to microprocessor which filters, amplifies, analyses and displays it as waveform of Pressure vs Time.")
55
Characteristics of Pressure measurement system
Blood pressure monitoring systems are described as underdamped, second order dynamic systems. 2 important system parameters are: Natural frequency quantifies how rapidly a system oscillates. Damping coefficient quantifies the frictional forces that act on system and determine how frequently it comes to rest. Both must be estimated bedside as they influence the appearance of recorded wave and thus interpretation. Both parameters must be estimated bedside as they influence the appearance of recorded wave and thus interpretation

56
Fourier analysis Fourier Analysis:
Process of analysing a complex waveform in terms of constituent sine waves. Arterial waveform can be broken up into a series of component sine waves with different amplitudes and frequencies Arterial pressure wave consists of a fundamental wave (pulse rate) and a series of harmonic waves (smaller waves whose frequencies are multiples of fundamental freq.) Crude arterial waveform can be reconstructed with 2 sine waves, fundamental frequency and second harmonic. 6-10 harmonics required for distortion free reproduction of arterial waveforms.
 and a series of harmonic waves (smaller waves whose frequencies are multiples of fundamental freq.) Crude arterial waveform can be reconstructed with 2 sine waves, fundamental frequency and second harmonic harmonics required for distortion free reproduction of arterial waveforms.")
57
Damping: tendency of factors like friction, compliant tubing and air bubbles to absorb energy and decrease amplitude of peaks and troughs in waveform. Optimal damping: which counterbalances distorting effects of transducer tubing system with lower natural frequency. Most catheter transducer systems are underdamped but have acceptable Natural frequency (> 12 Hz). Lower the natural frequency, more narrow the range of damping coefficients can be tolerated to ensure correct reproduction of pressure waves. .
. Lower the natural frequency, more narrow the range of damping coefficients can be tolerated to ensure correct reproduction of pressure waves. .")
58
Natural frequency should be high for optimal Dynamic response .
Achieved by: Short lengths of stiff pressure tubing Limiting the number of stopcocks Remove any blood clots or air bubbles.

59
Overdamped arterial pressure waveform
Overdamped arterial pressure waveform has slurred upstroke, absent dicrotic notch and loss of fine details. Features : slurred upstroke, absent dicrotic notch and loss of fine details. Consequence : false low BP.

60
Underdamped arterial pressure waveform
Underdamped waveforms have systolic pressure overshoot and artifacts. Features: systolic pressure overshoots and artifacts Consequence : Difficult to discern dicrotic notch No significance of artifact waves

61
Calculation of Damping Coefficient

62
Effect of air bubble Cause increase in system damping
Paradoxically increase system resonance causing systolic pressure overshoot Cause increase in system damping Decrease natural frequency

63
Effect of air bubble

64
Fast Flush test Flush the system with high pressure saline or with 2-3 ml saline. Frequency determined by measuring period of one cycle of adjacent oscillation peaks. Uses : Restores the dynamic characteristics of the pressure monitoring system. Measure the Natural frequency and Damping coefficient. Used to purge the extension line of blood after arterial sampling.

65
Transducer setups Zeroing:
Done by exposing the transducer to atmospheric pressure and calibrating pressure reading to zero. Air fluid interface at level of stopcock is the zero pressure locus. Ambient atmospheric pressure should be the reference against which all intravascular pressures are measured. Last pt idea behind this is that…as atmospheric press has equal effect on both bld vsl and transducer

66
Levelling: Pressure transducer must be set at appropriate level to best estimate aortic root pressure. Usually taken to a level with patient’s heart at 5 cm posterior to the sternal angle. Calibration Current disposable transducers do not require calibration.

67
Effect of patient position on Invasive and NIBP

68
Abnormal arterial pressure waveforms

69
Arterial pressure monitoring for predicting fluid responsiveness
Dynamic markers of fluid responsiveness Useful in determining end points for fluid resuscitation. Variations in ABP during positive pressure ventilation- most widely used indicator. Systolic pressure variation Pulse pressure variation

70
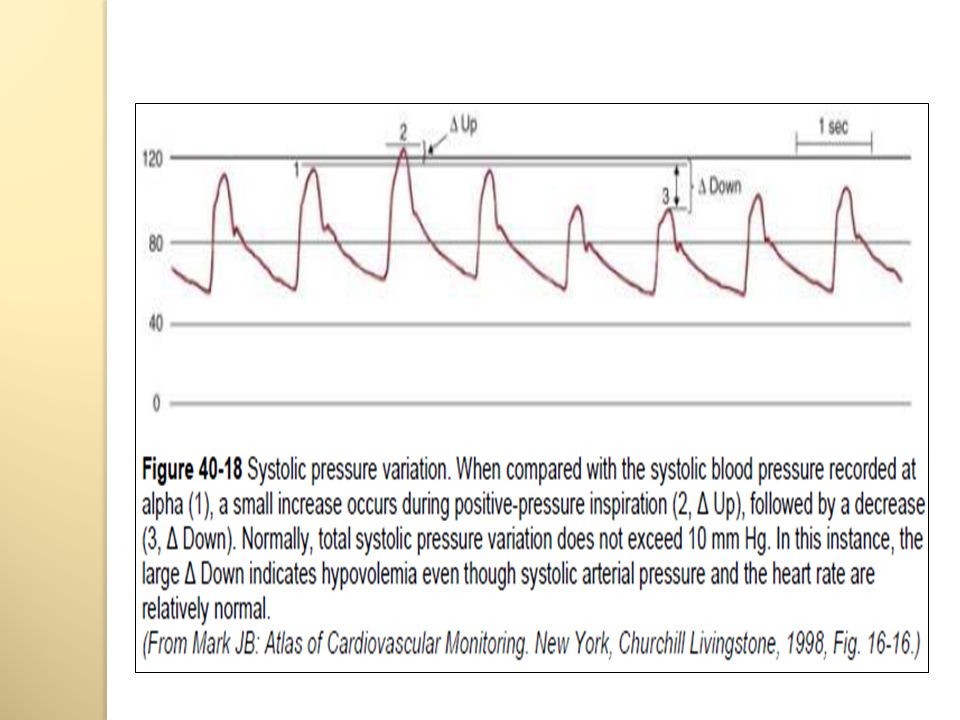
Systolic pressure variation
Positive pressure inspiration Increasing lung volume compresses pulmonary venous reservoir Blood propelled into left heart chambers LV preload increased

71
Increase in intrathoracic pressure decreases LV afterload
Increased LV Stroke volume and systemic arterial pressure Simultaneously RV preload and afterload increased

72
Decreased RV stroke volume during inspiration
During expiration, reduced RV stroke volume crosses pulmonary bed and decreases LV filling LV stroke volume and arterial BP falls. Cyclic variation known as Systolic Pressure Variation (SPV)
")
73
SPV divided into inspiratory and expiratory components by measuring increase (∆ up) and decrease (∆ down) in systolic pressure in relation to End expiratory apneic baseline pressure. Normal SPV in mechanically ventilated patient is 7-10mmHg (∆ up 2-4mmHg and ∆ down 5- 6mmHg). Hypovolemia causes drastic increase in SPV, particularly ∆ down component even if arterial BP is maintained by peripheral vasoconstriction. Large SPV may be s/o low PAWP. ∆ up may suggest afterload dependence of LV.
. Hypovolemia causes drastic increase in SPV, particularly ∆ down component even if arterial BP is maintained by peripheral vasoconstriction. Large SPV may be s/o low PAWP. ∆ up may suggest afterload dependence of LV.")
75
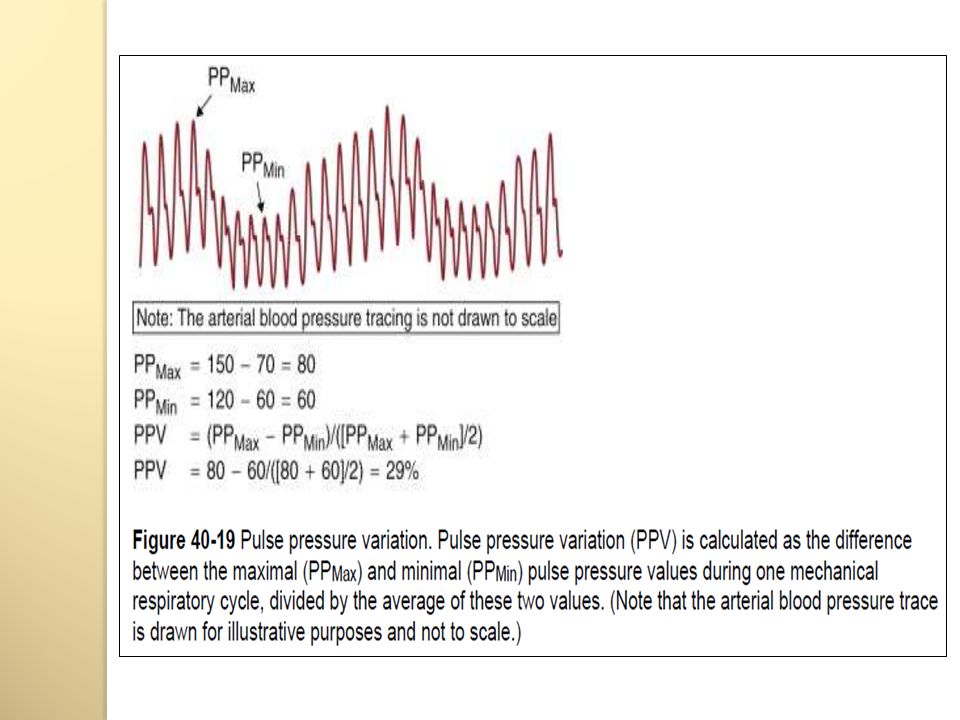
Pulse Pressure variation
Another dynamic indicator of volume responsiveness. Maximal difference in arterial pulse pressure over the course of positive pressure respiratory cycle divided by average of maximum and minimum pulse pressure. Normal not more than 13%. Other indicators: Stroke volume variation (normal 10%) Respiratory cycle induced variation in pulse plethysmogram.
 Respiratory cycle induced variation in pulse plethysmogram.")
77
Limitations of dynamic indicators
Magnitude of BP variation influenced by Tidal volume and Peak inspiratory pressure. SPV and PPV not reliable in patients with cardiac arrhythmias and changes in chest wall or lung compliance. Validated only for mechanically ventilated patients.

78
SUMMARY Continuous stethoscopy is an insensitive method for the early detection of untoward cardiovascular events. In auscultatory method flow turbulence under the cuff is used for measuring BP. Automatic measure of NIBP includes Oscillometry, Microphonic detection of korotokoffs sounds and Finapress. Oscillometry method measures MAP more effectively.

79
Direct IABP is widely used because hazards related to the technique is low, provides a continuous input of information and also detects changes in cardiovascular function and intravascular volume. The Allens test is not a reliable method to predict complications and other better alternatives include use of doppler and pulse oximeter probe. The most common route of bacterial infection in IABP set up is from the nonsterile transducer to the patient access- stopcock via health professionals fingers.

80
Liquid or gas sterilization is appropriate for transducer.
Dynamic measures of cardiac preload are better predictor of volume responsiveness than static indicators such as CVP or PCWP.

81
References Hutchison’s clinical methods. 21st edition
Miller’s Anaesthesia. 7th edition Understanding Anaesthesia equipments. Dorsch and Dorsch. 5th edition Monitoring in anaesthesia and critical care medicine. Blitt. 2nd edition The ICU book. Paul Marino. 3rd edition. Kaplan’s Cardiac Anaesthesia.

82
Thank You

Similar presentations


>")


 Pulse (P) Respiration (R) Blood pressure (BP) Pain (often called the fifth vital sign) Oxygen Saturation.>")