Download presentation
Presentation is loading. Please wait.

1
Topic no2 Ev631

2
Topig no2 Environment and Valuation:
Difference between open market price and negative value consequent on environmental impact issue on

3
Open market value The best price which might reasonably be expected to be obtained at arms' length for an interest in a property at the date of valuation of a property OPEN MARKET VALUE (OMV) is an opinion of the best price at which the sale of an interest in an asset would have been completed unconditionally for cash consideration on the date of valuation, assuming: a. a willing seller; b. that, prior to the date of valuation, there had been a reasonable period (having regard to the nature of the asset and state of the market) for the proper marketing of the interest, for the agreement of price and terms and for the completion of the sale; c. that the state of the market, level of values and other circumstances were, on any earlier assumed date of exchange of contracts, the same as on the date of valuation; d. that no account is taken of any additional bid by a purchaser with a special interest; and e. that both parties to the transaction had acted knowledgeably, prudently and without compulsion.
 is an opinion of the best price at which the sale of an interest in an asset would have been completed unconditionally for cash consideration on the date of valuation, assuming: a. a willing seller; b. that, prior to the date of valuation, there had been a reasonable period (having regard to the nature of the asset and state of the market) for the proper marketing of the interest, for the agreement of price and terms and for the completion of the sale; c. that the state of the market, level of values and other circumstances were, on any earlier assumed date of exchange of contracts, the same as on the date of valuation; d. that no account is taken of any additional bid by a purchaser with a special interest; and e. that both parties to the transaction had acted knowledgeably, prudently and without compulsion.")
4
The highest price a willing buyer would pay and a willing seller would accept, both being fully informed, and the property being exposed for sale for a reasonable period of time. The market value may be different from the price a property can actually be sold for at a given time (market price). The market value of an article or piece of property is the price that it might be expected to bring if offered for sale in a fair market; not the price that might be obtained on a sale at public auction or a sale forced by the necessities of the owner, but such a price as would be fixed by negotiation and mutual agreement, after ample time to find a purchaser, as between a vendor who is willing (but not compelled) to sell and a purchaser who desires to buy but is not compelled to take the particular article or piece of property.
. The market value of an article or piece of property is the price that it might be expected to bring if offered for sale in a fair market; not the price that might be obtained on a sale at public auction or a sale forced by the necessities of the owner, but such a price as would be fixed by negotiation and mutual agreement, after ample time to find a purchaser, as between a vendor who is willing (but not compelled) to sell and a purchaser who desires to buy but is not compelled to take the particular article or piece of property..")
5
"Market Value" in the USA is conceptually similar to "Open Market Value" in the UK. Nearly all appraisal assignments received by US (and Canadian) appraisers seek an estimate of Market Value as the "Purpose of the Appraisal." The analog to "Existing Use Value" in the UK is either "Use Value/User Value" or "Investment Value" in the USA. "Stigma" is defined as "a characteristic of a property or neighborhood that leads to avoidance behavior on the part of existing or potential occupants, owners, buyers, lessees or lenders."
 appraisers seek an estimate of Market Value as the Purpose of the Appraisal. The analog to Existing Use Value in the UK is either Use Value/User Value or Investment Value in the USA. Stigma is defined as a characteristic of a property or neighborhood that leads to avoidance behavior on the part of. existing or potential occupants, owners, buyers, lessees or lenders.")
6
NOTE To date, however, no known study has systematically surveyed the practices of appraisers experienced in the valuation of properties known or suspected to contain on-site contamination, or of properties adjacent or proximate to known or suspected sources of contamination. confronted with an assignment to value 1) a contaminated property, 2) a property that is formally and officially declared to have been "remediated," or 3) a property adjacent or proximate to a known or suspected source of contamination,
 a contaminated property, 2) a property that is formally and officially declared to have been remediated, or. 3) a property adjacent or proximate to a known or suspected source of contamination,")
7
a property known or suspected to be contaminated,
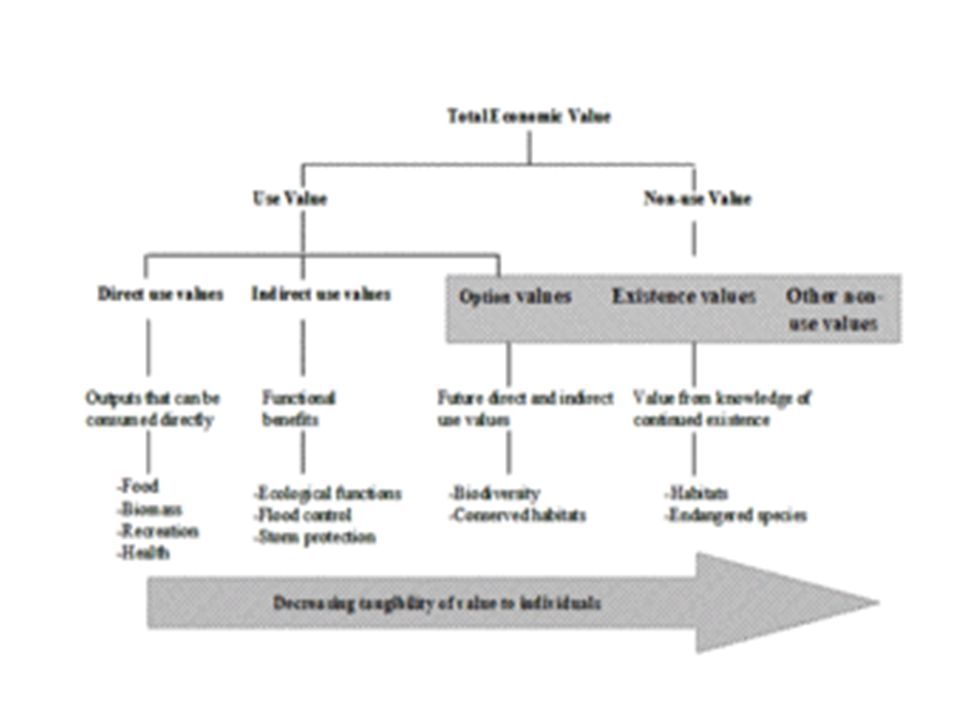
(2) a property known or assumed to have been "remediated," or 3) a property adjacent or proximate to a known or suspected source of contamination. Classifying environmental values • Use and non-use values Following the anthropocentric approach predominantly adopted in the economics literature, natural resources may then be described as assets (natural capital) the value of which stems from their service flows and their contribution to people’s welfare. Direct use values may derive from consumptive uses (e.g. fuelwood collection) and/or non-consumptive uses (e.g. hiking in the same forest), and may involve commercial (selling fuelwood or collecting visiting tolls) and/or non-commercial activities (home consumption of fuelwood or enjoyment of an open-access wilderness area). Although the physical proximity is normally thought as being an essential part of use, some authors have argued that some kinds of ‘use’ do not require the physical contact with the resource. Indirect use values, also known as functional values, derive from “the natural interaction between different ecological systems and processes; in particular, the ecological functioning of one ecosystem may affect the functioning and productivity of an adjacent system that is being exploited economically” Non-use values, undoubtedly the most elusive component of a natural resource’s total economic value, are said to arise from the psychological benefits people may derive from the mere knowledge the resource exists (existence value) 2 , or from the desire to preserve natural capital in order to pass it to future generations (bequest value).
 a property known or assumed to have been remediated, or 3) a property adjacent or proximate to a known or suspected source of contamination. Classifying environmental values. • Use and non-use values. Following the anthropocentric approach predominantly adopted in the economics. literature, natural resources may then be described as assets (natural capital) the value. of which stems from their service flows and their contribution to people’s welfare. Direct use values may derive from consumptive uses (e.g. fuelwood collection) and/or. non-consumptive uses (e.g. hiking in the same forest), and may involve commercial. (selling fuelwood or collecting visiting tolls) and/or non-commercial activities (home. consumption of fuelwood or enjoyment of an open-access wilderness area). Although the physical proximity is normally thought as being an essential part of use, some authors have argued that some kinds of ‘use’ do not require the physical contact. with the resource. Indirect use values, also known as functional values, derive from the natural. interaction between different ecological systems and processes; in particular, the. ecological functioning of one ecosystem may affect the functioning and productivity of. an adjacent system that is being exploited economically Non-use values, undoubtedly the most elusive component of a natural resource’s total. economic value, are said to arise from the psychological benefits people may derive. from the mere knowledge the resource exists (existence value) 2 , or from the desire to. preserve natural capital in order to pass it to future generations (bequest value).")
8
can be grouped into three major valuation approaches.
The first one consists of exploiting the existence of a market price for an environmental good, in order to assess its economic value. If the observable prices are not distorted, then the economic value of (marginal) environmental changes can be valued by directly using existing market prices. 8 Obviously, if the natural resource of interest provides multiple goods and services, some (many, or even all) of which are unmarketable, this valuation approach would fail to provide reliable measures of the resource’s value. The second approach (surrogate market valuation) consists of measuring the value of unmarketable environmental services by looking at the market price (or the shadow price) of related economic goods. the third approach (expressed preference approach) consists of directly asking individuals which value they attach to unmarketable environmental services, and to express their preferences towards changes in service flows. This approach is potentially able to estimate both use and non-use values, or simply - when applied in an holistic way- a natural resource’s total value.
 environmental changes can be valued by directly. using existing market prices. 8 Obviously, if the natural resource of interest provides. multiple goods and services, some (many, or even all) of which are unmarketable, this. valuation approach would fail to provide reliable measures of the resource’s value. The second approach (surrogate market valuation) consists of measuring the value of. unmarketable environmental services by looking at the market price (or the shadow. price) of related economic goods. the third approach (expressed preference approach) consists of directly asking. individuals which value they attach to unmarketable environmental services, and to. express their preferences towards changes in service flows. This approach is. potentially able to estimate both use and non-use values, or simply - when applied in. an holistic way- a natural resource’s total value.")
9
Few have identified the causes of market-value loss experienced by contaminated properties as falling under three broad categories: 1. Cost of Cleanup [sic] 2. Liability to the Public 3. Stigma After Cleanup In discussing "Stigma After Cleanup", Patchin observed that "a physical cleanup does not usually eliminate the value loss resulting from stigma...I have observed several cases in which...potential buyers remained reluctant. This reluctance has to do with all the risk and financing problems previously discussed. The result is that even a clean-up property may suffer from reduced marketability."

10
Reiterating the virtual lack of market sales transactions data for contaminated properties,
Patchin concludes that "a valuation tool that utilizes all of these [foregoing] factors is thecapitalization rate, (which) is dependent on three major factors: 1. Equity Yield Rate 2. Mortgage Terms Available 3. Anticipated Future Appreciation or Depreciation." The early valuation literature of emphasized the necessity to use the framework of Income Capitalization to identify the deductions from Unimpaired Market Value (i.e., Market Value As If Non-Contaminated), in order to estimate the Market Value of a contaminated property.
 is dependent on three major factors: 1. Equity Yield Rate. 2. Mortgage Terms Available. 3. Anticipated Future Appreciation or Depreciation. The early valuation literature of emphasized the necessity to use the framework of Income Capitalization to identify the deductions from Unimpaired Market Value (i.e., Market Value As If Non-Contaminated), in order to estimate the Market Value of a contaminated. property.")
11
That generally framework persists to the present (1998), with very few exceptions. The general framework that is identified is to estimate Unimpaired Value of the property, and then to deduct the following elements: The present worth of the estimated cost to remediate (typically obtained from environmental engineers or technicians) Present worth of reduced revenues, stemming from a combination of reductions in: Occupancy Rent Present worth of increased operating expenses, including: Increased insurance Increased interest on debt Monitoring costs anticipated after remediation Present worth of holding costs otherwise covered by reduced revenues Insurance Property taxes Repairs, maintenance
 Present worth of reduced revenues, stemming from a combination of reductions in: Occupancy. Rent. Present worth of increased operating expenses, including: Increased insurance. Increased interest on debt. Monitoring costs anticipated after remediation. Present worth of holding costs otherwise covered by reduced revenues. Insurance. Property taxes. Repairs, maintenance.")
12
Present worth is calculated as a function of the anticipated duration of the remediation period, plus the marketing period (for sale or rental) anticipated when remediation is completed. Over that period of time, the Discount Rate (or, sometimes, the Capitalization Rate) that is applied is adjusted to reflect the perception of increased risk associated with the existence (or suspicion) of on-site contamination. This results in an increased Discount Rate or Capitalization Rate for anticipated income, which is further increased by the likelihood of having to pay higher interest on debt (when debt financing is available at all) or relying on a higher proportion of equity investment, with its requirement of a higher rate of return. Anticipated losses or necessary expenses, on the other hand, are discounted at an applicable "safe rate."
 of on-site contamination. This results in an increased Discount Rate or Capitalization Rate for anticipated income, which is further increased by the likelihood of having to pay higher interest on debt (when debt financing is available at all) or relying on a higher proportion of equity investment, with its requirement of a higher rate of return. Anticipated losses or necessary expenses, on the other hand, are discounted at an applicable safe rate.")
13
Finally, from the unimpaired value estimate minus the present worth of the sum of estimated cost to remediate, estimated reduced revenues and estimated increased operating expenses and holding costs, a further deduction is made for post-remediation Stigma. Initially, that was reflected in recommended further increases in the risk rates applied to the reduced income stream. In more recent years11, sales transaction information has been available from several sources to indicate the percentage difference between the sales price of a remediated property with "closure" from a regulatory body (and occasionally indemnification from the seller) and the estimated Unimpaired Market Value of the property, as of the same date. Thus, market sales transactions data have become sufficiently numerous and available for direct market evidence to be utilized in estimating post-remediation stigma.
 and the. estimated Unimpaired Market Value of the property, as of the same date. Thus, market sales transactions data have become sufficiently numerous and available for direct market evidence to be utilized in estimating post-remediation stigma.")
14
While there is growing evidence for, and emphasis on, the use of sales of similarly contaminated properties following completion of remediation (with and without indemnification and/or "closure"), however, most US authors still recommend increasing the Capitalization Rate or Discount Rate for the identification and measurement of post-remediation Stigma. This procedure recognizes the increased risk associated with the marketing for sale or lease of a property known to have been contaminated. As the volume of available sales transactions data increases and becomes generally known, it is anticipated that this more "objective" evidence will be the major source of identifying and measuring post-remediation Stigma in the USA.

15
Finally, from the unimpaired value estimate minus the present worth of the sum of estimated cost to remediate, estimated reduced revenues and estimated increased operating expenses and holding costs, a further deduction is made for post-remediation Stigma. Initially, that was reflected in recommended further increases in the risk rates applied to the reduced income stream. In more recent years11, sales transaction information has been available from several sources to indicate the percentage difference between the sales price of a remediated property with "closure" from a regulatory body (and occasionally indemnification from the seller) and the estimated Unimpaired Market Value of the property, as of the same date. Thus, market sales transactions data have become sufficiently numerous and available in the USA (and, reportedly, Canada) for direct market evidence to be utilized in estimating post-remediation stigma.
 and the estimated Unimpaired Market Value of the property, as of the same date. Thus, market sales transactions data have become sufficiently numerous and available in the USA (and, reportedly, Canada) for direct market evidence to be utilized in estimating post-remediation stigma..")
16
While there is growing evidence for, and emphasis on, the use of sales of similarly contaminated properties following completion of remediation (with and without indemnification and/or "closure"), however, most US authors still recommend increasing the Capitalization Rate or Discount Rate for the identification and measurement of post-remediation Stigma. This procedure recognizes the increased risk associated with the marketing for sale or lease of a property known to have been contaminated. As the volume of available sales transactions data increases and becomes generally known, it is anticipated that this more "objective" evidence will be the major source of identifying and measuring post-remediation Stigma in the USA.

17
Richards' conclusions, which carry over to his Ph.D. thesis
1. Valuers need some form of environmental education, so that they might better appreciate when the value of a property may be affected by contamination, and when they should seek further advice from environmental consultants or experts.(This is directly opposite to the US consensus - and practice - that appraisers should rely on the opinions and cost estimates of licensed professional environmental engineers and technicians.) 2. The "Cost to Correct" approach provides a logical and realistic valuation basis,and help establish "best market practice." 3. When Stigma must be accounted for within valuations or calculations of contaminated land, either by adjusting the Yield Figure or Discount Rate, or by making an end deduction or allowance, "it must be remembered that any such adjustment will be inherently subjective." 4. There is a great need for improvement to the guidance available to valuers in this area (i.e., valuation of contaminated properties). 5. A market-wide database, containing details of transactions which have involved contamination, "could significantly reduce the subjectivity of adjustments made inrespect of Stigma."
 2. The Cost to Correct approach provides a logical and realistic valuation basis,and help establish best market practice. 3. When Stigma must be accounted for within valuations or calculations of contaminated land, either by adjusting the Yield Figure or Discount Rate, or by making an end deduction or allowance, it must be remembered that any such adjustment will be inherently subjective. 4. There is a great need for improvement to the guidance available to valuers in this area (i.e., valuation of contaminated properties). 5. A market-wide database, containing details of transactions which have involved contamination, could significantly reduce the subjectivity of adjustments made inrespect of Stigma.")
18
UK Practice Surveys researchers and commentators on the valuation of contaminated properties have tended to incorporate surveys of practice into their analyses of valuation procedures and techniques, most of which have culminated in recommendations for a particular approach. Dixon reported that the "cost to correct" method of analysis dominated in both the US and the UK in In 1996, Syms reported critically on the general practice of making subjective adjustments to yield ["All Risk Yield" (ARY)], rather than quantifying the capital value adjustment to account for post-remediation Stigma based on the potential purchasers perception of risk. In both 1995 and 1997, Richards (based on 50 in-depth interviews plus 5 test interviews of carefully selected valuers identified as experienced in estimating OPM of contaminated properties), also concluded that the "cost to correct" approach continues to dominate practice in the UK. In addition, Richards found that allowances for environmental Stigma were made largely through subjective adjustments of ARY. In 1997, Kennedy [20] developed a lengthy and detailed questionnaire which (after testing and amendment, were circulated to 100 potential respondents selected from a variety of recommendations and sources. Of these, 54 usable responses were received and subjected to analysis. Although the response rate was 71%, 17 of the questionnaires were returned blank.
], rather than quantifying the capital value adjustment to account for post-remediation Stigma based on the potential purchasers perception of risk. In both 1995 and 1997, Richards (based on 50 in-depth. interviews plus 5 test interviews of carefully selected valuers identified as experienced in. estimating OPM of contaminated properties), also concluded that the cost to correct approach continues to dominate practice in the UK. In addition, Richards found that allowances for environmental Stigma were made largely through subjective adjustments of ARY. In 1997, Kennedy [20] developed a lengthy and detailed questionnaire which (after testing and amendment, were circulated to 100 potential respondents selected from a variety of recommendations and sources. Of these, 54 usable responses were received and subjected to analysis. Although the response rate was 71%, 17 of the questionnaires were returned blank.")
19
Many people argue that environmental (e. g
Many people argue that environmental (e.g., land, air, and water) and natural resources (e.g., coal, trees, and fish) are, in fact, priceless. Thus, they say, it is not appropriate to consider them within the context of economic valuation. However, the world's population has proven unwilling to forgo all future economic activity to eliminate all factors that cause environmental damage. Human societies are willing to give up certain environmental assets to generate other kinds of economic gains. The value placed on environmental assets is illustrated in our choices against other competing economic needs.
 and natural resources (e.g., coal, trees, and fish) are, in fact, priceless. Thus, they say, it is not appropriate to consider them within the context of economic valuation. However, the world s population has proven unwilling to forgo all future economic activity to eliminate all factors that cause environmental damage. Human societies are willing to give up certain environmental assets to generate other kinds of economic gains. The value placed on environmental assets is illustrated in our choices against other competing economic needs.")
21
How does the valuation technique affect the decision-making?
Inclusion of non-commercial value may affect the decision on the desirability of the policy and programmes, reflecting in part of the true "value" of the environment. e.g., cost benefit analysis of an environment conservation programme

23
Types of environmental valuation techniques
Environmental valuation techniques can be broadly classified into two categories: revealed preference (RP) approaches and stated (or expressed) preference (SP) approaches. Revealed preference approaches make use of individuals' behaviour in actual or simulated markets to infer the value of an environmental good or service. For example, the value of a wilderness area may be inferred by expenditures that recreationists incur to travel to the area. Stated preference methods attempt to elicit environmental values directly from respondents using survey techniques.
 approaches and stated (or expressed) preference (SP) approaches. Revealed preference approaches make use of individuals behaviour in actual or simulated markets to infer the value of an environmental good or service. For example, the value of a wilderness area may be inferred by expenditures that recreationists incur to travel to the area. Stated preference methods attempt to elicit environmental values directly from respondents using survey techniques.")
24
What are the non-commercial values?
There are many ways to categorize the "values" attached to the environment (environmental assets). Basically they are to identify benefits from the environment that are not properly reflected in the monetary valuation. Existence value - the very existence of environmental assets are valuable. For example, existence of natural habitats of grizzly bears may be considered to be valuable, though people do not necessarily want an encounter with the bears in the wild. Bequest value - the environmental assets may benefit future generations. For example, preserving a national park may benefit future generations, although not everybody of the present generation have an intention to visit the park. Option value - one of the interpretations of option value is the assessment of value attached to an option that would be available in the future. For example, once biodiversity is lost at the expense of development, the possibility (option) of benefiting from it is gone forever.
. Basically they are to identify benefits from the environment that are not properly reflected in the monetary valuation. Existence value - the very existence of environmental assets are valuable. For example, existence of natural habitats of grizzly bears may be considered to be valuable, though people do not necessarily want an encounter with the bears in the wild. Bequest value - the environmental assets may benefit future generations. For example, preserving a national park may benefit future generations, although not everybody of the present generation have an intention to visit the park. Option value - one of the interpretations of option value is the assessment of value attached to an option that would be available in the future. For example, once biodiversity is lost at the expense of development, the possibility (option) of benefiting from it is gone forever.")
25
Economic principles suggest that the well-being of a society can be measured as the sum of all the individuals' level of well-being. This well-being, or what economists call "utility," is not derived solely from purchasing and consuming goods and services, but also from things like safety, and our physical, mental, and spiritual well-being. The fact that all these things have utility is evident in that we are willing to trade our time, effort, money, and other resources to get them. The utility or degree of satisfaction experienced by individuals, and thus society, can be quantified in terms of the "willingness to pay" for goods and services, including environmental resources. In many cases, individuals do not pay for the environmental benefits they receive. The willingness-to-pay concept is key in environmental valuation, granting analysts a framework upon which to examine and measure individual preferences. Positive preferences for environmental resources translate into an expressed or observed willingness to pay for them. Conversely, individuals are not willing to pay for environmental resources that they do not value.

26
Natural resources are also valuable in the production of other goods
Natural resources are also valuable in the production of other goods. The output of any firm is a function of several important inputs, which economists call "factors of production." The factors of production include labor, capital (such as buildings and machinery), and an array of environmental inputs. These environmental inputs include the land upon which production takes place, raw materials extracted from the environment, such as minerals and timber, and often, clean air and water. It is sometimes, but not always, possible to offset declines in the natural resources required in production processes by increasing labor and capital. However, environmental depletion and damage ultimately lead to declining input availability and reductions of output and utility.
, and an array of environmental inputs. These environmental inputs include the land upon which production takes place, raw materials extracted from the environment, such as minerals and timber, and often, clean air and water. It is sometimes, but not always, possible to offset declines in the natural resources required in production processes by increasing labor and capital. However, environmental depletion and damage ultimately lead to declining input availability and reductions of output and utility.")
27
An unregulated market leads to equilibrium price and quantity determined at the intersection of the supply, or marginal private cost (MPC), curve and the demand curve: P1, Q1. Consumers and producers enjoy the gains from this equilibrium. The consumer surplus is the difference between willingness to pay (height of the demand curve) and price: area a + b + c + d. You enjoy consumer surplus every time you buy something and get a "good deal."
 and price: area a + b + c + d. You enjoy consumer surplus every time you buy something and get a good deal.")
28
Within the environment and economic flow diagram, raw materials (R) are used as inputs into the production process (P) that creates the goods consumed by households (C). The end result of production and consumption is the creation of utility (U) or satisfaction. Thus, the function of the environment, as highlighted within the diagram, is to provide material inputs into the production process and positive amenity to humankind.
 or satisfaction. Thus, the function of the environment, as highlighted within the diagram, is to provide material inputs into the production process and positive amenity to humankind..")
29
R, is expanded to encompass two forms of natural resources: exhaustible and renewable resources (highlighted in red). Exhaustible resources (ER), which are not renewable, include oil, coal, and minerals. Renewable resources (RR), such as water and trees, may be replenished. In the diagram, "h" refers to the harvest of the resource and "y" to the sustainable yield.
, which are not renewable, include oil, coal, and minerals. Renewable resources (RR), such as water and trees, may be replenished. In the diagram, h refers to the harvest of the resource and y to the sustainable yield..")
30
The diagram is expanded in Figure of previous slide to include the generation of waste products (W) (new elements are highlighted in green). Waste products arise from processing or mining of resources. Waste products, such as the emissions and solid waste generated by industrial facilities, are also created by the production process. Final consumers also create waste by disposing of product packaging and, ultimately, the product itself. The slide next is representing this

31
The box labeled "r" represents the share of total waste that is recycled and thus put back into the production process. Bottles, paper products, cans and plastics are all products commonly recycled by households. Scrap metal and water used in industrial processing are often recycled.

32
Market Allocation of Natural Resources
The goals of consumers and producers are in conflict. Rational consumers try to achieve the highest level of utility that is possible within the limits of their budget, and rational producers try to maximize their profits. Lower prices enable consumers to purchase more of a good, thus expanding their utility. However, lower prices reduce the revenues, and thus profits, that accrue to producers. In a market economy, these conflicting goals are reconciled at a competitive market equilibrium price that balances the forces of supply and demand.

33
Demand is a schedule of how much of a good or service individuals will purchase during a specified period, depending on price and other factors. The law of demand states that as prices increase, the quantity demanded will fall, and as the price falls, more will be demanded, all other things being equal. Supply is a schedule of how much of a good or service firms supply during a specified period, depending on price and other factors. The law of supply states that as prices grow, the quantity supplied will increase, and as prices fall, firms supply less to the market.

34
Note : Consumer surplus in Figure is represented by area abc
Figure on right demonstrates how demand and supply work together to determine the price of a commodity. Other factors being unchanged, the demand curve shows the relationship between price and quantity demanded, whereas the supply curve shows the relationship between price and the quantity supplied. Note : Consumer surplus in Figure is represented by area abc Producer surplus is the difference between what a supplier is paid for a good or service and what it costs to supply, and is represented by area bcd in

35
Economists measure the net economic benefit in a market as the difference between what it costs to produce a good or service, on the one hand, and what consumers are willing to pay for it, on the other. In an efficiently functioning competitive market, the net economic benefit is divided between consumers and producers. The net economic benefit is, therefore, divided between what is known as consumer and producer surplus. Consumer surplus is the difference between what each customer is willing to pay at each point in time and the price of the good or service and is represented by the area falling above the price line and below the demand curve.

36
The total economic benefit of a sale is the sum of the consumer and producer surplus. Consumer and producer surplus is a function of both supply and demand. Figure on right demonstrates that as demand increases as represented in the outward shift in the demand curve, consumer and producer surplus is increased. Consumer surplus in Figure is represented by area gef Producer surplus is the difference between what a supplier is paid for a good or service and what it costs to supply, and is represented by area deg.

38
Consumers and producers enjoy the gains from this equilibrium
Consumers and producers enjoy the gains from this equilibrium. The consumer surplus is the difference between willingness to pay (height of the demand curve) and price: area a + b + c + d. You enjoy consumer surplus every time you buy something and get a "good deal." The producer surplus is the difference between the revenue earned on each unit (P1) and its marginal cost of production: area f + g + h (note that f includes the tiny triangle below P1 and above the MSC curve). Producer surplus is equivalent to profit without the fixed cost (e.g., monthly lease payments that don't change with output). Unfortunately, production of Q generates some harmful side (i.e., external) effects such as fewer healthy days, fewer recreation opportunities, etc: marginal external cost = MEC. If these costs are constant then the full costs to society of production of Q is the marginal social cost curve: MSC = MPC + MEC. The external costs of Q1 are equal to area c + d + e + f + g + h. (Nothing in the conclusions changes if the MEC is increasing in Q0.
 and price: area a + b + c + d. You enjoy consumer surplus every time you buy something and get a good deal. The producer surplus is the difference between the revenue earned on each unit (P1) and its marginal cost of production: area f + g + h (note that f includes the tiny triangle below P1 and above the MSC curve). Producer surplus is equivalent to profit without the fixed cost (e.g., monthly lease payments that don t change with output). Unfortunately, production of Q generates some harmful side (i.e., external) effects such as fewer healthy days, fewer recreation opportunities, etc: marginal external cost = MEC. If these costs are constant then the full costs to society of production of Q is the marginal social cost curve: MSC = MPC + MEC. The external costs of Q1 are equal to area c + d + e + f + g + h. (Nothing in the conclusions changes if the MEC is increasing in Q0.")
39
Environmental regulation is designed to get firms to "internalize the externality" by considering the external costs of production. If firms face a constant pollution tax on each unit of output so that they face production costs equivalent to the MSC curve then the new market equilibrium will be P2, Q2. The regulated product market will have a higher price and lower quantity. At the new equilibrium, consumer surplus is area a and producer surplus is h. Government revenue is area b + c + f. The deadweight loss (DWL) of the tax is d + g (poof!). However, the avoided external cost is equal to d + e + g. Therefore, the net benefit of the environmental regulation is d + e + g - d - g = e > 0 (MEC - DWL). A benefit-cost analysis would indicate that the pollution tax is an efficient policy. Now imagine that the environmental policy is command and control (and assume that abatement costs of command and control are the minimum abatement costs): firms are required to use a clean technology. In this case the producer surplus becomes area b and area c + f + h is simply the higher production costs associated with pollution abatement: the increased capital and labor devoted to pollution reduction.
 of the tax is d + g (poof!). However, the avoided external cost is equal to d + e + g. Therefore, the net benefit of the environmental regulation is d + e + g - d - g = e > 0 (MEC - DWL). A benefit-cost analysis would indicate that the pollution tax is an efficient policy. Now imagine that the environmental policy is command and control (and assume that abatement costs of command and control are the minimum abatement costs): firms are required to use a clean technology. In this case the producer surplus becomes area b and area c + f + h is simply the higher production costs associated with pollution abatement: the increased capital and labor devoted to pollution reduction.")
40
Categories of Environmental Values
(a)Direct-use values: goods and services directly consumed by users - Products (e.g., edible, ornamental, medicinal, inputs into production process) - Recreation - Waste assimilation - Research - Education (b) Indirect-use values: indirect benefits arising from ecological systems -Biological support – links to other species and habitats -Physical protection – coastal defense function -Climate regulation -Global life support – functions that aid in supporting life on Earth (c) Non-use values -Option value -Existence value Bequest motive Stewardship motive Benevolence motive (d) Intrinsic value: organisms have a worth of their own regardless of usefulness to humans
Direct-use values: goods and services directly consumed by users - Products (e.g., edible, ornamental, medicinal, inputs into production process) - Recreation - Waste assimilation - Research - Education (b) Indirect-use values: indirect benefits arising from ecological systems -Biological support – links to other species and habitats -Physical protection – coastal defense function -Climate regulation -Global life support – functions that aid in supporting life on Earth (c) Non-use values -Option value -Existence value Bequest motive Stewardship motive Benevolence motive (d) Intrinsic value: organisms have a worth of their own regardless of usefulness to humans.")
41
direct-use value + indirect-use value + non-use value +
Use values, monetary gain , are the more direct and quantifiable category of environmental values, but using part of natural resources only a portion of the total economic value of an environmental asset. Indirect-use values, non-use values, and intrinsic values are also associated with preserving environmental resources. Total economic value is represented by the following equation:Total economic value = direct-use value + indirect-use value + non-use value + intrinsic value

42
Indirect-use values associated with Environments include biological support, physical protection, climate modulation, and global life support. Non-use values are less direct, less tangible benefits to society and include option and existence values. The option value is the value an individual places on the potential future use of the resource, for example, benefits a beach would offer during future use of Environment Existence values include bequest, stewardship, and benevolence motives. Bequest value is the satisfaction gained through the ability to endow a natural resource on future generations. The stewardship motive is derived from an altruistic sense of responsibility toward the preservation of the environment and a desire to reduce environmental degradation. The benevolence motive reflects the desire to conserve an environmental resource for potential use by others. Finally, the intrinsic value of nature reflects the belief that all living organisms are valuable regardless of the monetary value placed on them by society. Table 1 presents a typology of environmental values.

43
Methods for Valuing the Environment
Environmental valuation is largely based on the assumption that individuals are willing to pay for environmental gains and, conversely, are willing to accept compensation for some environmental losses. The individual demonstrates preferences, which, in turn, place values on environmental resources. That society values environmental resources is certain; monetizing the value placed on changes in environmental assets such as coastal areas and water quality is far more complex. Environmental economists have developed a number of market and non-market-based techniques to value the environment. Figure in next slide presents some of these techniques and classifies them according to the basis of the monetary valuation, either market-based, surrogate market, or non-market-based.

45
(a) factor of production approach,
Market-Based Methods. Economists generally prefer to rely on direct, observable market interactions to place monetary values on goods and services. Markets enable economists to measure an individual's willingness to pay to acquire or preserve environmental services. In turn, consumers reveal their preferences through the choices they make in allocating scarce resources among competing alternatives. There are a number of market-based methods of environmental valuation. Below are three market-based techniques: (a) factor of production approach, b) change in producer/consumer surplus, and c) examination of defensive expenditures.
 factor of production approach, b) change in producer/consumer surplus, and. c) examination of defensive expenditures.")
46
The value of a natural resource can be monetized based on its value as a factor of production.
The output of any firm is a function of several important inputs (e.g., land, capital, natural resources), which are collectively known as "factors of production." In their role as factors of production, raw materials and environmental inputs are used in the production of other goods. When a natural resource has direct value as a factor of production and the impact of environmental degradation on future output of that resource can be accurately measured, the resultant monetary value of the decline in production or higher cost of production can be measured. This technique is methodologically straightforward; however, it is limited to those resources that are used in the production process of goods and services sold in markets. Because many goods and services produced by the environment are not sold in markets, the factor of production method generally fails to capture the total value of the resource to society.
, which are collectively known as factors of production. In their role as factors of production, raw materials and environmental inputs are used in the production of other goods. When a natural resource has direct value as a factor of production and the impact of environmental degradation on future output of that resource can be accurately measured, the resultant monetary value of the decline in production or higher cost of production can be measured. This technique is methodologically straightforward; however, it is limited to those resources that are used in the production process of goods and services sold in markets. Because many goods and services produced by the environment are not sold in markets, the factor of production method generally fails to capture the total value of the resource to society.")
47
The standard method used to measure the net economic benefit of a good or service in a market involves an examination of consumer and producer surplus. As noted in previous slides , consumer surplus is the difference between what each customer is willing to pay and the price of the good or service and is represented by the area falling above the price line and below the demand curve. Consumer surplus in Figure is represented by Area abc. Producer surplus is the difference between what a producer is paid for a good or service and what it costs to supply, and is represented by Area bcd. The total economic benefit of a sale is the sum of the consumer and producer surplus.

48
Surrogate Market Methods.
In the absence of clearly defined markets, the value of environmental resources can be derived from information acquired through surrogate markets. The most common markets used as surrogates when monetizing environmental resources are those for property and labor. The surrogate market methods discussed below are the hedonic price method and the travel cost method.

49
Examples of RP (revealed preference (RP) approaches) methods are
Hedonic Pricing Method (HPM), Travel Cost Method (TCM), and Benefit-Transfer (BT) methods.
, Travel Cost Method (TCM), and. Benefit-Transfer (BT) methods.")
50
The hedonic price method of environmental valuation uses surrogate markets for placing a value on environmental quality. The real estate market is the most commonly used surrogate in hedonic pricing of environmental values. Air, water, and noise pollution have a direct impact on property values. By comparing properties with otherwise similar characteristics or by examining the price of a property over time as environmental conditions change and correcting for all non-environmental factors, information in the housing market can be used to estimate people's willingness to pay for environmental quality.

51
The prices of two houses may differ considerably, even with the same facilities (size, same structure, etc). The prices may reflect the difference of: Access to the work-place, commercial amenities, environmental facilities such as parks, Environmental qualities of the neighbourhood Such differences may imply that people are, to some extent, making a judgement on how much (more) they will spend for the quality of environment. For example, if a person were to choose between two identical houses, (a) one situated in clean environment, (b) the other in polluted area, which one would he/she buy or rent? What if the price of (a) is 5% higher than (b)? or 50% higher? The HPM technique uses property prices to assess How much of the property value differential reflects the difference in environmental values How much people are willing to pay for an improvement of environmental quality and what the social value of the improvement is.
 they will spend for the quality of environment. For example, if a person were to choose between two identical houses, (a) one situated in clean environment, (b) the other in polluted area, which one would he/she buy or rent What if the price of (a) is 5% higher than (b) or 50% higher The HPM technique uses property prices to assess. How much of the property value differential reflects the difference in environmental values. How much people are willing to pay for an improvement of environmental quality and what the social value of the improvement is.")
52
Travel Cost Method This approach attempts to evaluate environmental asset (e.g., national park) from the viewpoint of how much time and money people are willing to spend to visit the site. If people take the trouble of long and expensive journey to the site, it may imply that the site is evaluated highly. The monetary evaluation is attempted by estimating total cost of travel to the site (transportation, entrance fee, etc.) and time factors (one way of calculation is to take proportion of the visitors' income. Major characteristics of the Travel cost approach A useful method for valuing the recreational benefits of a site Restrictive as it measures site-specific recreational value Practicality of deriving benefit estimate is questionable
 from the viewpoint of how much time and money people are willing to spend to visit the site. If people take the trouble of long and expensive journey to the site, it may imply that the site is evaluated highly. The monetary evaluation is attempted by estimating total cost of travel to the site (transportation, entrance fee, etc.) and time factors (one way of calculation is to take proportion of the visitors income. Major characteristics of the Travel cost approach. A useful method for valuing the recreational benefits of a site. Restrictive as it measures site-specific recreational value. Practicality of deriving benefit estimate is questionable.")
53
The travel cost method is employed to measure the value of a recreational site by surveying travelers on the economic costs they incur (e.g., time and out-of-pocket travel expenses) when visiting the site from some distance away. These expenditures are considered an indicator of society's willingness to pay for access to the recreational benefits provided by the site.

54
Trip Expense in Rs Number of Trips
To estimate the associated lost value of recreational benefits, the first step of a travel cost analysis would be to survey individuals about the number of trips and expenses incurred during each trip to the beach. The second step is to examine the relationship between the expense incurred and the total number of trips taken Thus, the travel cost method enables the analyst to develop an implicit demand curve for the recreational benefits offered by the site per person, which can then be multiplied by the number of people in each cost category (generally judged by estimating costs associated with various distances from the site). In turn, the demand curve can be used to measure consumer surplus and monetize the direct, use value of the site. Trip Expense in Rs Number of Trips <R20 100 R20-R40 45 R40-R60 32 R60-R80 17 R80-R100 9 >R100 4 the travel cost method does not measure non-use and intrinsic values or other sources of value, such as commercial values.
. In turn, the demand curve can be used to measure consumer surplus and monetize the direct, use value of the site. Trip Expense in Rs. Number of Trips. <R R20-R R40-R R60-R R80-R >R the travel cost method does not measure non-use and intrinsic values or other sources of value, such as commercial values.")
55
Random utility models (RUMs) are econometric models that, among other uses, permit the estimation of preferences among different recreational areas with varying characteristics. The RUM, with its ability to assess competing multiple sites with varying recreational characteristics, holds considerable appeal for economists. Consider three beaches with characteristics that vary based on location, water quality, landscape features, access, existence of lavatories, and other services. These characteristics can be transformed into discrete and continuous variables used to assess consumer preference by examining location preference and the total cost of trips taken (Table 4). Based on the data collected through surveys of various sites, the RUM estimates the probability that an individual will visit one site out of several sites based on site characteristics. Varying the quality of those characteristics (e.g., water quality, landscape features) permits the analyst to assess how recreational travelers value changes in environmental quality at particular sites. A RUM is not specific to surrogate market techniques. Rather, a RUM is an estimation procedure that can be combined with surrogate and non-market techniques used in valuing, for example, recreational areas and wetland area restoration. Travel cost studies often use RUMs; however, they may also be applied in stated preference studies that use choice experiments.
. Based on the data collected through surveys of various sites, the RUM estimates the probability that an individual will visit one site out of several sites based on site characteristics. Varying the quality of those characteristics (e.g., water quality, landscape features) permits the analyst to assess how recreational travelers value changes in environmental quality at particular sites. A RUM is not specific to surrogate market techniques. Rather, a RUM is an estimation procedure that can be combined with surrogate and non-market techniques used in valuing, for example, recreational areas and wetland area restoration. Travel cost studies often use RUMs; however, they may also be applied in stated preference studies that use choice experiments..")
56
The primary disadvantage of CVM is that it may not yield accurate results due to biases that may be introduced in the survey or through respondents' behavior. These biases include strategic bias, where the respondent's belief that his answers may be used to affect government policy leads him to intentionally understate or overstate his willingness to pay to achieve the desired policy result. The payment vehicle cited in the questionnaire may also result in bias due to an aversion to certain taxes or fees. The availability of information or misperceptions concerning environmental quality can also result in bias

57
Benefit Transfer (BT) Method
The benefit transfer (BT) method is another alternative for obtaining non-market values. This approach has been applied to value the impact of improved water quality on recreation values and public health, and to lake recreation. It involves 'transferring' values that have already been estimated for a similar good or service from another location to the current location. The approach is useful because surveys are costly in terms of time and money. Necessary conditions for a BT to be meaningful: The goods (or services) in both sites should have roughly similar characteristics; The population in both areas should be similar; and The values in the first study should not have been estimated a long time ago because preferences change over time.
 method is another alternative for obtaining non-market values. This approach has been applied to value the impact of improved water quality on recreation values and public health, and to lake recreation. It involves transferring values that have already been estimated for a similar good or service from another location to the current location. The approach is useful because surveys are costly in terms of time and money. Necessary conditions for a BT to be meaningful: The goods (or services) in both sites should have roughly similar characteristics; The population in both areas should be similar; and. The values in the first study should not have been estimated a long time ago because preferences change over time.")
58
Examples of SP( stated (or expressed) preference (SP) )methods include the Contingent Valuation Method (CVM) and Choice Modelling.
 preference (SP) )methods include the Contingent Valuation Method (CVM) and Choice Modelling.")
59
Contingent Valuation Method (CVM)
This method is a direct approach - it directly asks people what they are willing to pay for a benefit and/or what they are willing to receive by way of compensation to tolerate a cost in a hypothetical market for environmental goods/services. For example, the method will ask what people are willing to pay (WTP) for preservation of native forests, what are willing to pay for access to clean water, or what compensation they are willing to accept (WTA) if they are to lose the access to clean water.
 for preservation of native forests, what are willing to pay for access to clean water, or what compensation they are willing to accept (WTA) if they are to lose the access to clean water.")
60
Bias can occur depending on various factors. For example;
The design of survey questions (assumption set for the survey, means of payments assumed in the survey, the reference price given, etc) Vehicles (instrument) of payment (local taxes, entrance fees, surcharges on bills, higher prices etc. - people may not be indifferent to the means of the "hypothetical" payment to the environmental goods.) Methods used for the survey (face-to-face interviews, questionnaire, multiple-choice, open ended questionnaires, etc) Environmental goods people are asked to evaluate (such items as "clean water supply", "access to a public park" are easier for people to give more accurate estimate of how much people would pay, compared to items like "preservation of endangered species") Information on the particular environmental goods (Those "known" environmental goods may be valued high. If people do not know about the existence of certain endangered species, they have little idea of how much they would like to pay for preserving it) No response (Some people refuse to give any estimated valuation in monetary terms as the environment is pricelessly important. How such infinite value should be counted into the evaluation?)
 Vehicles (instrument) of payment (local taxes, entrance fees, surcharges on bills, higher prices etc. - people may not be indifferent to the means of the hypothetical payment to the environmental goods.) Methods used for the survey (face-to-face interviews, questionnaire, multiple-choice, open ended questionnaires, etc) Environmental goods people are asked to evaluate (such items as clean water supply , access to a public park are easier for people to give more accurate estimate of how much people would pay, compared to items like preservation of endangered species ) Information on the particular environmental goods (Those known environmental goods may be valued high. If people do not know about the existence of certain endangered species, they have little idea of how much they would like to pay for preserving it) No response (Some people refuse to give any estimated valuation in monetary terms as the environment is pricelessly important. How such infinite value should be counted into the evaluation )")
61
Non-Market Methods. The Contingent Valuation Method (CVM) is a non-market-based technique that elicits information concerning environmental preferences from individuals through the use of surveys, questionnaires, and interviews. When deploying the contingent valuation method, the examiner constructs a scenario or hypothetical market involving an improvement or decline in environmental quality. The scenario is then posed to a random sample of the population to estimate their willingness to pay (e.g., through local property taxes or utility fees) for the improvement or their willingness to accept monetary compensation for the decline in environmental quality. The questionnaire may take the form of a simple open-ended question (e.g., how much would you be willing to pay) or may involve a bidding process (e.g., would you accept Rs 10, would you accept Rs 20) or take-it-or-leave-it propositions. Based on survey responses, examiners estimate the mean and median willingness to pay for an environmental improvement or willingness to accept compensation for a decline in environmental quality.
 is a non-market-based technique that elicits information concerning environmental preferences from individuals through the use of surveys, questionnaires, and interviews. When deploying the contingent valuation method, the examiner constructs a scenario or hypothetical market involving an improvement or decline in environmental quality. The scenario is then posed to a random sample of the population to estimate their willingness to pay (e.g., through local property taxes or utility fees) for the improvement or their willingness to accept monetary compensation for the decline in environmental quality. The questionnaire may take the form of a simple open-ended question (e.g., how much would you be willing to pay) or may involve a bidding process (e.g., would you accept Rs 10, would you accept Rs 20) or take-it-or-leave-it propositions. Based on survey responses, examiners estimate the mean and median willingness to pay for an environmental improvement or willingness to accept compensation for a decline in environmental quality..")
62
The CVM is extremely flexible and can be used to value most any environmental asset. Further, CVM and other non-market methods are required accurately to capture non-use values. This is a significant point in a world comprised of ecosystems under great stress from human impacts, where increasing attention is being given to non-use values.

63
Major characteristics of the CVM
Relatively straightforward approach to elicit individuals' valuations of environmental assets (goods) Only method that can measure non-use values of environment (e.g. existence value) Validity and reliability of estimates are questionable due to inherent measurement biases
 Only method that can measure non-use values of environment (e.g. existence value) Validity and reliability of estimates are questionable due to inherent measurement biases.")
64
Choice Modelling Choice modelling (CM) has been used widely in the field of marketing to analyse consumer choices. In recent years, it has been used to value environmental goods and services. In this approach, respondents are presented with a series of alternatives, with each containing three or more resource use options. Usually, each alternative is defined by a number of attributes. For example, in a CM study of preserving a wilderness area the attributes could be the following: numbers of rare species present; ease of access to the area, size of area and cost to households. These attributes are varied across the various alternatives. The respondents are then required to choose their most preferred alternative. The marginal value each attribute for a given option is calculated using statistical methods.
 has been used widely in the field of marketing to analyse consumer choices. In recent years, it has been used to value environmental goods and services. In this approach, respondents are presented with a series of alternatives, with each containing three or more resource use options. Usually, each alternative is defined by a number of attributes. For example, in a CM study of preserving a wilderness area the attributes could be the following: numbers of rare species present; ease of access to the area, size of area and cost to households. These attributes are varied across the various alternatives. The respondents are then required to choose their most preferred alternative. The marginal value each attribute for a given option is calculated using statistical methods.")
65
Good Practices for integrating environmental considerations into economic decision making processes
There are two main criteria for determining the "success" of a practice. The practice must result in either: an improvement in the environment situation with at least no deterioration in the socio-economic situation, or an improvement in the socio-economic situation with at least no deterioration in the environment situation The practice must be sustainable over time and not a one-off event

66
Factors which help characterise and measure a "good practice"
Factors which help characterise and measure a "good practice". These can be classified as: Process factors participation of the community participation of resource owners/users partnerships between various actors such as government/NGO/academia/private sector degree of co-ordination and co-operation among various government departments ability to attract political interest/support exchange of information procedures for consultations for project formulation feedback and review

67
Cost/efficiency factors
economic (opportunity ) cost institution (transaction) cost exercise of due diligence Characteristics affecting replication (application) location specific culture specific level of development of country style of government degree of centralisation/decentralisation types of instruments used in country (command and control, market based, etc)
 cost. institution (transaction) cost. exercise of due diligence. Characteristics affecting replication (application) location specific. culture specific. level of development of country. style of government. degree of centralisation/decentralisation. types of instruments used in country (command and control, market based, etc)")
68
ENVIS- Subject Information under the Environmental Valuation title.
STEP 1 of the Objectives STEP 2 Questionnaire Design STEP 3 Survey of Sampled Population STEP 4 Database Creation and Data Analysis STEP 5 WTP Estimation 1a Identification of the object to be valued 2a Introduction 3a Decide the sampling technique 4a Collection and verification of data 5a WTP models choice 1b Establishment of value to be estimated and unit of measurement 2b Socio-economic information 3b Decide how, when, and where to run interviews 4b Data base creation 5b Estimation of annual individual average max WTP 1c Identification of time span of the valuation 2c Scenario formulation 3c Training of enumerators 4c Elimination of invalid questionnaires 5c Annual net benefits 1d Identification of who should be interviewed (definition of the population) 2d WTP/WTA elicitation format 3d Running the interviews 4d Derived variables building 5d Total value of environmental services
 2d WTP/WTA elicitation format. 3d Running the interviews. 4d Derived variables building. 5d Total value of environmental services.")
69
Willingness-to-pay and willingness-to-accept
Environmental values are measured in money terms through the concept of individuals’ willingness to pay (WTP) or willingness to accept (WTA) compensation for alterations in environmental conditions. Of these two, mostly for practical reasons, the WTP approach has become the most frequently applied, whilst WTA empirical studies are relatively rare. As it will be illustrated later on, WTP is measured directly, by asking people to state a WTP amount, or indirectly, by assuming that this amount can be inferred by looking at the economic costs afforded to
 or willingness to accept (WTA) compensation for alterations in. environmental conditions. Of these two, mostly for practical reasons, the WTP approach has become the most. frequently applied, whilst WTA empirical studies are relatively rare. As it will be. illustrated later on, WTP is measured directly, by asking people to state a WTP amount, or indirectly, by assuming that this amount can be inferred by looking at the economic. costs afforded to.")
70
Env Valuation Attempts to quantify and express in monetary terms the full value of environmental resources For private goods, prices reflect relative scarcity and people’s willingness to pay Prices for environmental goods do not exist or do not reflect full value of resource Nature of environmental goods and services Not well-defined (ecological functions) Unclear property rights (fish stocks, groundwater) Public goods (clean air) Economic values need to be derived
 Unclear property rights (fish stocks, groundwater) Public goods (clean air) Economic values need to be derived.")
Similar presentations


>")


