Download presentation
Presentation is loading. Please wait.

2
Sandy Baruah President and CEO Detroit Regional Chamber

3
Health Care In Transition: The Big Picture

4
Paul Keckley Former Executive Director Deloitte Center for Health Solutions

5
Ed Wolking Executive Vice President Detroit Regional Chamber

6
Handling Change: Challenges and Opportunities for Employers

7
David Lansky President and CEO Pacific Business Group on Health

8
DRAFT 2 - CBO Presentation
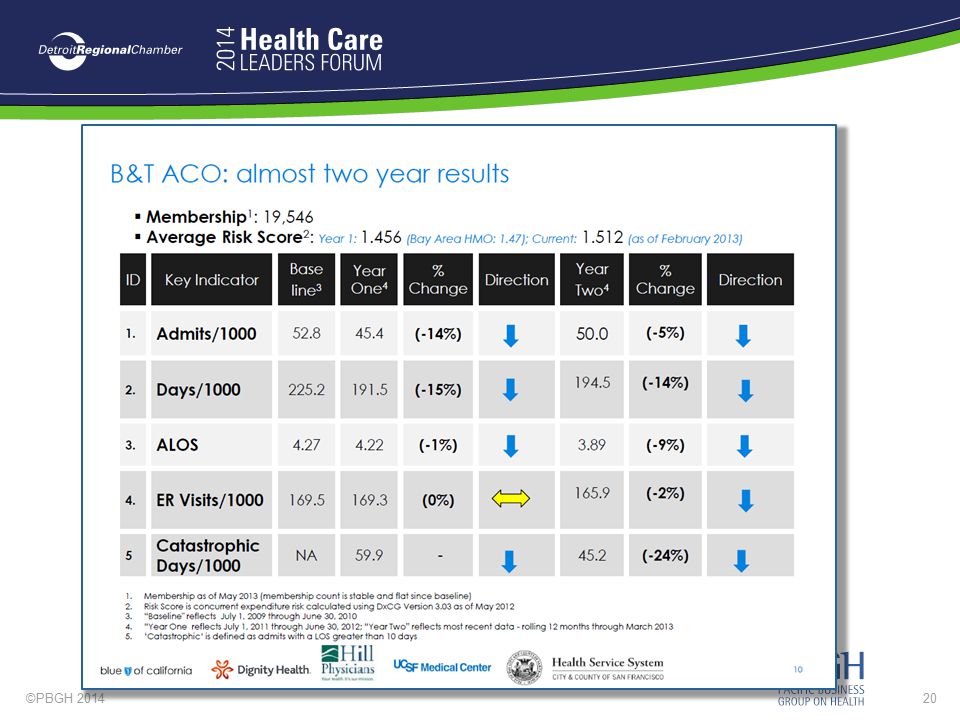
Challenges and Opportunities for Employers (and by extension, individuals and employees) Health Care Leaders Forum Detroit Regional Chamber March 12, 2014 David Lansky, PhD President and CEO
 2014 Health Care Leaders Forum Detroit Regional Chamber March 12, David Lansky, PhD. President and CEO.")
9
PBGH Members Apple Facebook Google Hewlett Packard Microsoft Oracle ….

10
Value of our $3 trillion system

11
SOURCE: Kaiser/HRET Survey of Employer-Sponsored Health Benefits, Bureau of Labor Statistics, Consumer Price Index, U.S. City Average of Annual Inflation (April to April), ; Bureau of Labor Statistics, Seasonally Adjusted Data from the Current Employment Statistics Survey, (April to April).
, ; Bureau of Labor Statistics, Seasonally Adjusted Data from the Current Employment Statistics Survey, (April to April)..")
12
Percentage of All Firms Offering Health Benefits, 1999-2013
*Estimate is statistically different from estimate for the previous year shown (p<.05). NOTE: Estimates presented in this exhibit are based on the sample of both firms that completed the entire survey and those that answered just one question about whether they offer health benefits. The percentage of firms offering health benefits is largely driven by small firms. The large increase in 2010 was primarily driven by a 12 percentage point increase in offering among firms with 3 to 9 workers. In 2011, 48% of firms with 3 to 9 employees offer health benefits, a level more consistent with levels from recent years other than The overall 2011 offer rate is consistent with the long term trend, indicating that the high 2010 offer rate may be an aberration. SOURCE: Kaiser/HRET Survey of Employer-Sponsored Health Benefits,
. NOTE: Estimates presented in this exhibit are based on the sample of both firms that completed the entire survey and those that answered just one question about whether they offer health benefits. The percentage of firms offering health benefits is largely driven by small firms. The large increase in 2010 was primarily driven by a 12 percentage point increase in offering among firms with 3 to 9 workers. In 2011, 48% of firms with 3 to 9 employees offer health benefits, a level more consistent with levels from recent years other than The overall 2011 offer rate is consistent with the long term trend, indicating that the high 2010 offer rate may be an aberration. SOURCE: Kaiser/HRET Survey of Employer-Sponsored Health Benefits,")
13
Employers considering “exit”
Source: 18th Annual Towers Watson/National Business Group on Health Employer Survey on Purchasing Value in Health Care (2013)
")
14
Savings by “Best Performing” Employers
Source: 18th Annual Towers Watson/National Business Group on Health Employer Survey on Purchasing Value in Health Care (2013)
")
15
Strategies of “Best Performing” Employers
Source: 18th Annual Towers Watson/National Business Group on Health Employer Survey on Purchasing Value in Health Care (2013)
")
16
Strategies to Improve System Performance

17
Large Employer Strategies
Benefit design with strong incentives to consumers: Tiered networks Reference pricing Centers of Excellence (travel surgery) Direct contracting: Accountable care organizations Primary care networks On-site clinics with selected networks Intensive outpatient care models (serious chronic illness) Payment reform: Price and quality transparency “value” based payments Alignment among private carriers (e.g., bundled payment) Alignment with Congress, Medicare, states (e.g., SGR fix)
 Direct contracting: Accountable care organizations. Primary care networks. On-site clinics with selected networks. Intensive outpatient care models (serious chronic illness) Payment reform: Price and quality transparency value based payments. Alignment among private carriers (e.g., bundled payment) Alignment with Congress, Medicare, states (e.g., SGR fix)")
18
Source: Robinson JC and Brown TT, “Increases in Consumer Cost Sharing Redirect Patient Volumes and Reduce Hospital Prices for Orthopedic Surgery.” Health Affairs 32(8), 2013, pp

19
Reference pricing for lower cost services
Colonoscopy Cost Per Procedure – Greater SF Bay Area MSA 12% increase in use of labs below reference price; 6% increase in low-cost imaging centers Driven by steerage to specific, named providers

21
Where we are today… Fading hope that competitive market can work to manage cost, improve quality Potential of rapid shift to defined contribution, private and public exchanges in next 5-10 years Consensus interest in value-based payment, alignment of consumer and provider incentives, greater transparency for informed decisionmaking The path is clear. Will leadership appear?

23
Fast-Changing Relationships: The Road Ahead for Employers

24
Moderator: Panelists:
Kathleen S. Neal, Director of Integrated Health Care & Disability, Chrysler Group, LLC Former Executive Director Deloitte Center for Health Solutions Panelists: John Neuberger, Director of Client Partnerships, Quad/Graphics Randy Vogenberg, Principal, Institute for Integrated Healthcare

25
Impacts of Response: The Changing Landscape for Providers

26
Carlos Jackson Senior Associate Director, Federal Relations American Hospital Association

27
American Hospital Association
The Changing Landscape for Providers Carlos Jackson American Hospital Association March 12, 2014

28
Wednesday, February 15 Naval Heritage Center 9:30 AM
ACA implementation Wednesday, February 15 Naval Heritage Center 9:30 AM

29
Implementing reform Regulatory Design Insurance reforms
High risk pools Medical loss ratios Mandates Insurance exchanges Integrated care options Bundling Accountable care organizations Medical homes Center for Medicare and Medicaid Innovation Value-based purchasing Readmissions Hospital Transparency Related to Health Costs. (Sec. 1003) Hospitals must report annually and make public a list of hospital charges for items and services, including Medicare severity diagnosis-related groups (MS DRGs). The HHS Secretary will establish the guidelines for public reporting beginning in 2010. 29
 Hospitals must report annually and make public a list of hospital charges for items and services, including Medicare severity diagnosis-related groups (MS DRGs). The HHS Secretary will establish the guidelines for public reporting beginning in")
30
CMS quality and accountability initiatives provide additional impetus to hospitals’ integration efforts. Chart 3: Timeline of CMS Value-Driven Payment Initiatives Meaningful Use (HITECH Act) Incentive Payments Only Upside/Downside Risk Penalties Only Nonpayment Accountable Care Organizations* Bundled Payments for Care Improvement* Readmission Penalties for Low Performers Hospital-Acquired Conditions** Hospital Inpatient Quality Reporting Program (P4R) Hospital Outpatient Quality Reporting Program (P4R) Hospital Value-Based Purchasing Program 2008 2009 2010 2011 2012 2013 2014 2015 2016 2017 2018 P4R: Pay-for-reporting HITECH: Health Information Technology for Economic and Clinical Health *Program is voluntary **In 2008, Medicare stopped paying for select hospital-acquired conditions (HAC). In FY 2015, Medicare will begin penalizing hospitals in the top quartile of Medicare HACs . Source: Centers for Medicare & Medicaid Services
 Incentive Payments Only. Upside/Downside Risk. Penalties Only. Nonpayment. Accountable Care Organizations* Bundled Payments for Care Improvement* Readmission Penalties for Low Performers. Hospital-Acquired Conditions** Hospital Inpatient Quality Reporting Program (P4R) Hospital Outpatient Quality Reporting Program (P4R) Hospital Value-Based Purchasing Program P4R: Pay-for-reporting. HITECH: Health Information Technology for Economic and Clinical Health. *Program is voluntary. **In 2008, Medicare stopped paying for select hospital-acquired conditions (HAC). In FY 2015, Medicare will begin penalizing hospitals in the top quartile of Medicare HACs . Source: Centers for Medicare & Medicaid Services.")
31
Physicians widely anticipate increased levels of integration with partner hospitals.
Chart 5: Percent of Physicians that Believe Physicians and Hospitals are Likely or Very Likely to become More Integrated in the Next 3 Years, by Medical Specialty, 2013 Source: Deloitte Center for Health Solutions (2013). Deloitte 2013 Survey of U.S. Physicians.
. Deloitte 2013 Survey of U.S. Physicians.")
32
Integration helps hospitals gain efficiencies through economies of scale.
Chart 6: Economies of Scale with Increasing Patient Population 1 patient 2 patients 4 patients Variable Costs* Fixed Costs Fixed costs, such as medical technologies, are spread across each patient. The more patients that need the technology, the lower the cost per patient. Variable costs, such as labor costs, scale with the number of patients. As the number of patients increases, variable labor costs can decrease over time due to new efficiencies. Source: Bond, R. (2012). American Healthcare Industrial Revolution: Economies of Scale and the Accountable Care Organization (ACO). ACODatabase.com.
. American Healthcare Industrial Revolution: Economies of Scale and the Accountable Care Organization (ACO). ACODatabase.com.")
33
The Concern Behind the Law Unintended Consequences
Current legal and regulatory barriers are a deterrent to innovative clinical integration efforts. Chart 7: Legal Barriers to Integrated Care Delivery Law What is Prohibited? The Concern Behind the Law Unintended Consequences How to Address? Antitrust (Sherman Act) Joint negotiations by providers unless ancillary to financial or clinical integration; agreements that give health care provider market power Providers may enter into agreements that either are nothing more than price-fixing, or which give them market power so they can raise prices above competitive levels Deters providers from entering into procompetititve, innovative arrangements because they are uncertain about antitrust consequences Additional guidance from antitrust enforcers to clarify when arrangements will raise serious issues; guidance is currently available for federally-designated accountable care organizations (ACOs) Ethics in Patient Referral Act (“Stark Law”) Referrals of Medicare patients by physicians for certain designated health services to entities with which the physician has a financial relationship (ownership or compensation) Physicians may have financial incentive to refer patients for unnecessary services or to choose providers based on financial reward and not the patient’s best interest Arrangements to improve patient care are banned when payments tied to achievements in quality and efficiency vary based on services ordered instead of tied to hours worked Congress should remove compensation arrangements from the definition of “financial relationships” subject to the law. Arrangement would continue to be regulated by other laws. Anti-kickback Law Payments to induce Medicare or Medicaid patient referrals or ordering covered goods or services Creates uncertainty concerning arrangements where physicians are rewarded for treating patients using evidence-based clinical protocols Congress should create a safe harbor for clinical integration programs Civil Monetary Penalty (CMP) Payments from a hospital that directly or indirectly induce a physician to reduce or limit services to Medicare or Medicaid patients Physician may have incentive to reduce the provision of necessary medical services As interpreted by the Office of the Inspector General (OIG), the law prohibits any incentive that may result in a reduction of care, even if the result is an improvement in the quality of care The CMP law should be changed to make clear it applies only to the reduction or withholding of medically necessary services IRS Tax-exempt Laws Use of charitable assets for the private benefit of any individual or entity Assets that are intended for the public benefit are used to benefit any private individual (e.g., a physician) Uncertainty about how IRS will view payments to physicians in a clinical integration program is a significant deterrent to the teamwork needed for clinical integration IRS should issue guidance providing explicit examples of how it would apply the rules to physician payments in clinical integration programs
 Joint negotiations by providers unless ancillary to financial or clinical integration; agreements that give health care provider market power. Providers may enter into agreements that either are nothing more than price-fixing, or which give them market power so they can raise prices above competitive levels. Deters providers from entering into procompetititve, innovative arrangements because they are uncertain about antitrust consequences. Additional guidance from antitrust enforcers to clarify when arrangements will raise serious issues; guidance is currently available for federally-designated accountable care organizations (ACOs) Ethics in Patient Referral Act ( Stark Law ) Referrals of Medicare patients by physicians for certain designated health services to entities with which the physician has a financial relationship (ownership or compensation) Physicians may have financial incentive to refer patients for unnecessary services or to choose providers based on financial reward and not the patient’s best interest. Arrangements to improve patient care are banned when payments tied to achievements in quality and efficiency vary based on services ordered instead of tied to hours worked. Congress should remove compensation arrangements from the definition of financial relationships subject to the law. Arrangement would continue to be regulated by other laws. Anti-kickback Law. Payments to induce Medicare or Medicaid patient referrals or ordering covered goods or services. Creates uncertainty concerning arrangements where physicians are rewarded for treating patients using evidence-based clinical protocols. Congress should create a safe harbor for clinical integration programs. Civil Monetary Penalty (CMP) Payments from a hospital that directly or indirectly induce a physician to reduce or limit services to Medicare or Medicaid patients. Physician may have incentive to reduce the provision of necessary medical services. As interpreted by the Office of the Inspector General (OIG), the law prohibits any incentive that may result in a reduction of care, even if the result is an improvement in the quality of care. The CMP law should be changed to make clear it applies only to the reduction or withholding of medically necessary services. IRS Tax-exempt Laws. Use of charitable assets for the private benefit of any individual or entity. Assets that are intended for the public benefit are used to benefit any private individual (e.g., a physician) Uncertainty about how IRS will view payments to physicians in a clinical integration program is a significant deterrent to the teamwork needed for clinical integration. IRS should issue guidance providing explicit examples of how it would apply the rules to physician payments in clinical integration programs.")
34
Hospital Squeeze Labor Government payment Life-saving technology/Rx
Older, sicker patients Redundant regulation Liability insurance Info technology Emergency readiness Government payment Private payor pressure New care delivery models Rising uninsured

36
Options for offsets and deficit reduction
Hospital Vulnerability List Options for offsets and deficit reduction Prospective coding offsets ($8 billion) Site neutral payment policies E&M code/HOPD ($10 billion) 66 additional APCs procedures ($9 billion) 12 procedures performed in ASCs ($6 billion) Hospital bad-debt reductions ($20 billion) GME reductions ($10 billion) CAH: payment reductions and qualification criteria ($2 billion) Post acute care ($70 billion) IPAB expansion ($4.1+ billion) Medicaid: State provider assessments ($22 billion) Medicaid DSH “rebasing”
 Site neutral payment policies. E&M code/HOPD ($10 billion) 66 additional APCs procedures ($9 billion) 12 procedures performed in ASCs ($6 billion) Hospital bad-debt reductions ($20 billion) GME reductions ($10 billion) CAH: payment reductions and qualification criteria ($2 billion) Post acute care ($70 billion) IPAB expansion ($4.1+ billion) Medicaid: State provider assessments ($22 billion) Medicaid DSH rebasing")
37
Impact of site neutral payment options
Medicare Margins for Hospital Outpatient Department Services and Projected with MedPAC Proposed Cuts E&M Only E&M and 66 E&M, 66 and 12 Source: Medicare Payment Advisory Commission, December 2012 meeting materials and June Report to Congress.

38
President’s FY 2015 Budget $414 Billion in Medicare and Medicaid Cuts
Key hospital provisions Replace remaining sequestration with other savings Reduce GME by $14.6 billion (proposes $5.23 billion for 13,000 new residency slots through a new competitive GME program) Strengthen IPAB ($12.9 billion) $112 billion in post-acute cuts (site-neutral SNF/IRF, 60% rule, reduces updates) Phase out Medicare bad-debt payments by $30.8 billion Rebase Medicaid disproportionate share hospitals in FY 2024 for savings of $3.26 billion Critical Access Hospitals: 101% to 100% and 10 mile designation ($2.4 billion reduction)
 Strengthen IPAB ($12.9 billion) $112 billion in post-acute cuts (site-neutral SNF/IRF, 60% rule, reduces updates) Phase out Medicare bad-debt payments by $30.8 billion. Rebase Medicaid disproportionate share hospitals in FY 2024 for savings of $3.26 billion. Critical Access Hospitals: 101% to 100% and 10 mile designation ($2.4 billion reduction)")
40
The Two-Midnight Rule CMS will generally consider hospital admissions spanning two midnights as appropriate for payment under the inpatient prospective payment system (PPS). In contrast, hospital stays of less than two midnights will generally be considered outpatient cases, regardless of clinical severity. 1
. In contrast, hospital stays of less than two midnights will generally be considered outpatient cases, regardless of clinical severity. 1.")
41
On the Horizon: What’s Around the Corner for Providers?

42
Moderator: Panelists:
Laura Appel, Vice President of Federal Policy and Advocacy, Michigan Health & Hospital Association Panelists: Gina Buccalo, MD, Chief Medical Officer, Partners in Care Carlos Jackson, Senior Associate Director, Federal Relations, American Hospital Association Michael Madden, President and CEO, The Physician Alliance

43
Lunch and Networking

45
Challenges for the Government – The Federal Response

46
Tevi Troy President The American Health Policy Institute

47
Perspectives of a Healthcare Policy Maker
Tevi Troy, President The American Health Policy Institute

48
Perspectives of an insider
Policy makers inside government have different perspectives from those in the private sector. They are often equally competent but they're looking at things from a different angle have different bosses and different constituencies to satisfy. In addition they are subject to different rules. The APA governs how regulations are determined and puts the development of regulations in a very tight stricture.

49
Perspectives of an insider
One of the challenges in developing the website was that policymakers had to use federal contractors, a universe with a high bar to entry, using "cost-plus" reimbursement, and requiring certifications of compliance with OFCCP, acquisition requirements, and other federal standards. It is true that policymakers come with results that differ from one of those in the private sector would have come up with, but much of this stems from the different perspective and the different rules the government imposes, as well as their lack of private sector experience.

50
Coping with a Challenging and Uncertain Regulatory Environment
Health care faces significant policy challenges. Health care environment rife with regulatory uncertainty. Post-elections/Supreme Court/mandate delay/Shutdown fight, regulatory landscape and employer responses will determine the disposition of the ACA more than Congress in the short term.

51
OBAMA ADMINISTRATION’S TOP ISSUES Foreign Policy & Defense
Immigration Science Energy & Environment Education Faith-Based Initiatives Social Security Economic Recovery Science Civil Rights Oceanic Policy Transportation Poverty HIV/AIDS Healthcare Reform Technology Disabilities Taxes Seniors Sportsmen Foreign Policy & Defense Veterans Service Arts Rural Family Ethics Women Child Advocacy Urban Policy

52
OBAMA ADMINISTRATION’S TOP ISSUES: Healthcare Reform
Increasing costs 1960: healthcare 5% of GDP 2011: healthcare 17.9% of GDP - $2.7 trillion 2021 (projected), $4.8 trillion % of GDP Government expected to spend $2.4 trillion (50% of healthcare spending)
, $4.8 trillion % of GDP. Government expected to spend $2.4 trillion (50% of healthcare spending)")
53
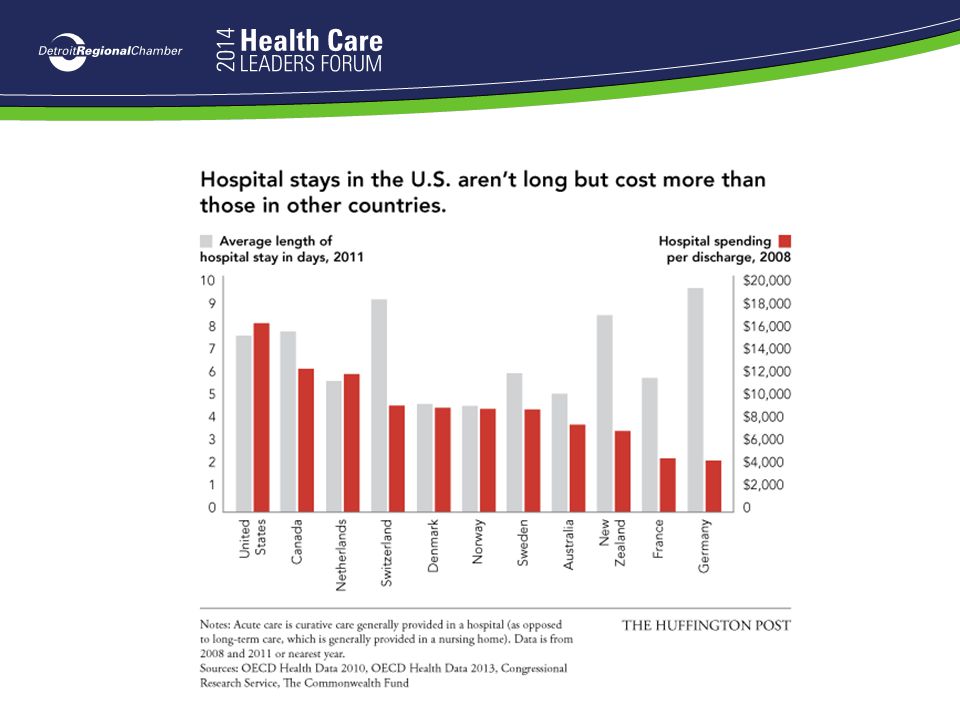
US Health Care Costs US Average annual cost of health care was $8,233 per capita x Japan’s in 2010 U.S. households spent 6% of their annual incomes on health costs U.S. performs more expensive diagnostic tests, such as MRI’s and CT’s On the other hand, the U.S. does not have an excessive number of doctors or hospital beds relative to its population Similarly, duration of hospital stays is not above average

54
2030 Baby Boomer Projections
In 2030: The over 65 population will be at 72,091,915 (19% of the overall U.S. population) - 40,228,712 million in 2010 (13% of overall U.S. population) Over 21 million will be considered obese Approx. 14 million will be living with diabetes
 - 40,228,712 million in 2010 (13% of overall U.S. population) Over 21 million will be considered obese. Approx. 14 million will be living with diabetes")
55
Breakdown of National Health Care Expenditures: 1965-2010
Source: Office of the Actuary of the Center for Medicare and Medicaid Services

56
Before Reform Became Law…
5 different committees 3 House 2 in Senate Two Houses of Congress House Floor Senate Floor Conference In Senate Reconciliation (51 votes) or Regular Order (60) Presidential Signature
 or Regular Order (60) Presidential Signature.")
60
Analysis of CHT Timeline
Type Pre-enactment Upon enact- ment 6 months post enact- By Jan 1, 2011 1 year post enact- 1 year post enactment to Jan 31, 2011 Jan1, 2012-Dec 31, 2013 Total Percent of total Medicare 7 29 44 11 34 24 163 35 Medicaid 5 3 4 2 17 9 CHIP 1 Public health 6 79 HHS Taxes 10 12 Insurance 21 51 Long-term care <1 IHS 68 86 18 150 33 65 28 22 75 469 100 32 14 16

61
How did we get here? Intense effort to micromanage
The Affordable Care Act (ACA) has required almost 20,000 pages of regulations, elaborating on the original 2,700 page law. Can be very specific. Consider Section 4102 of the ACA, which states: "The secretary shall develop oral healthcare components that shall include tooth-level surveillance.” Not necessarily welcome: 51% of doctors percent felt that the law would have a negative impact on their relationships with their patients
 has required almost 20,000 pages of regulations, elaborating on the original 2,700 page law. Can be very specific. Consider Section 4102 of the ACA, which states: The secretary shall develop oral healthcare components that shall include tooth-level surveillance. Not necessarily welcome: 51% of doctors percent felt that the law would have a negative impact on their relationships with their patients.")
62
Outlook of the next four years
ACA will not be overturned before 2017 Implementation challenges greater than expected, but do not change the central dynamic: Democrats will never admit full extent of the law’s shortcomings Republicans will never call the law a success even if it works as promised How should people judge the law?

63
Judging the Law Evaluate the law based on its 3 main goals
Universal coverage “Bending the cost curve” The guarantee of the ability to keep current plan

64
Promise: Universal Coverage
Ranging number of uninsured, between 30 – 47 million people Moral imperative to cover people Most expansive definitions of the uninsured that President Obama used included both illegal immigrants, as well as individuals, who were already eligible for public assistance, but not partaking in it

65
Promise: “Bending the cost curve”
President Obama claimed he would reduce premium costs by $2,500 for a family of four There is tension between the goal of universal coverage and the effort to bend the cost curve

66
Promise: “If you like your health care you can keep it.”
Became standard response to the public’s skepticism of the ACA President Obama mentioned it nearly every time he spoke of the law Some sources say he said it hundreds of times The promise was to ensure Americans that the law would not affect 85% of Americans that already had health insurance

67
Other metrics to evaluate
ACA imposes $1.1 trillion in new taxes over the first 10 years Employers are trying to stay under 50 employees, or 30 hr threshold Health care market has been one of the only sectors continuing to hire during the recession In September 2013 there were more layoffs among health-care providers than in any other industry

68
Legislation - GOP Alternative
Executive Compensation: A Best Practice and Public Policy Overview Legislation - GOP Alternative Senate Republican Proposal Keeps most popular provisions of the ACA Guaranteed issue, coverage of dependents to age 26, no lifetime limits Repeals more than a dozen ACA taxes and the employer mandate Provides continuous coverage protection for pre-existing conditions Gives tax credits to people who are not employed at large companies Limits tax exclusion of employer provided health benefits to 65 percent of plan costs.

69
American Health Policy Institute
Executive Compensation: A Best Practice and Public Policy Overview American Health Policy Institute American Health Policy Institute AHPI is a non-partisan 501 (c)(3) think tank focused on health care policy and the employer-based system. AHPI will be looking at: how the ACA affects employers; what employers are doing about ACA; and policy recommendations. The first study from AHPI will be on employers costs under ACA
(3) think tank focused on health care policy and the employer-based system. AHPI will be looking at: how the ACA affects employers; what employers are doing about ACA; and policy recommendations. The first study from AHPI will be on employers costs under ACA.")
70
Going forward? Democrats are adamant the law stay in place.
Republicans are adamant the law goes. This dynamic means there is no pathway for real improvement of changes during the remainder of the Obama administration Employers need to chart a path forward, recognizing that they will get little help from Washington. This requires two steps: Creating health care plans that work for employers and employees within the current structure Laying the groundwork now that will have to come in the future administration

72
Transparency: The Root of all Reform

73
Jay Want, MD Principal Want Healthcare, LLC

74
The Transparency Remedy
Will seeing what you’re buying increase value?

75
Searching for the cure to health care costs…

76
Units X Price = Cost, right?
Quick Quiz: What causes American Health Care to be more expensive than HC in other countries? We uses more stuff, i.e., it’s a units problem, mostly. The stuff we use is higher priced, i.e., it’s a price problem, mostly. Both in roughly equal measure.

80
Source:Physician fees and salaries in the US and other countries
September 8, 2011 at 2:18 pm Aaron Carroll The Incidental Economist; data from /hlthaff Health Aff September 2011 vol. 30 no. 9

81
How did it get this way? Fee for service= accountability for activity, not for outcomes Industry consolidation for two decades = oligopoly formation Third party payer system: those who use the service and provide the service don’t pay for the service = moral hazard

82
Where current reform schemes work
Units Pay for performance Nonpayment for readmissions Bundles Capitation Prices Benefit design, e.g. reference pricing Price transparency

83
Providing Answers to: Consumers… Businesses… Providers and Facilities…
“How much will my knee MRI cost and what are my best options?” “How do I compare to my peers and demonstrate value?” “How does cost, utilization and quality compare between public and private payers?” Businesses… Legislators and Policy Experts… “Which health plan provides the best value providers for our premium?” Providing Answers to: 83

84
State Statewide or partial geographic area Statutory or voluntary Provides consumer focused reporting Currently collecting data? Currently doing any kind of public reporting? 1. Maine Statewide Statutory Yes 2. NH 3. VT 4. MA 5. MD 6. KS No 7. UT 8. TN 9. MN No (reports are not public) 10. Colorado 11. Oregon 12. Wisconsin Partial Voluntary 13. Washington State
 10. Colorado. 11. Oregon. 12. Wisconsin. Partial. Voluntary. 13. Washington State.")
85
Status of state APCDs 11 statewide, statutory APCDs, including Colorado, that have collected data. There are two states that have voluntary data for part of the state (WI, WA). Oregon has not issued any reports yet, so that is why the count is often “10 APCDs.” Seven states have issued reports at one time or another. (ME, NH, VT, MA, MD, KS, UT). Five states allow data release: ME, NH, VT, MA, CO Three states do consumer focused reporting: ME, NH, MA and soon CO
. Oregon has not issued any reports yet, so that is why the count is often 10 APCDs. Seven states have issued reports at one time or another. (ME, NH, VT, MA, MD, KS, UT). Five states allow data release: ME, NH, VT, MA, CO. Three states do consumer focused reporting: ME, NH, MA and soon CO.")
86
86

87
Highlights from New Release

88
88

89
89

90
Snapshot Reports Highlighting Variation

91
Will market forces regulate prices?
Motivated purchasers/consumers Benefit design, high deductible Reference pricing strategies Transparent pricing Transparent and relevant quality Willing competitors Centers of excellence strategies Pearlanne, can you turn into a diagram, say four circles that interrelate?

92
CMS moving toward greater transparency
CMS NEWS Feb. 21, 2014 Quality Data Added to Physician Compare WebsitePatients Get More Information to Help Find a Doctor Today, the Centers for Medicare & Medicaid Services (CMS) announced that for the first time, quality measures have been added to Physician Compare, a website that helps consumers search for information about hundreds of thousands of physicians and other health care professionals. The site helps consumers make informed choices about their care.
 announced that for the first time, quality measures have been added to Physician Compare, a website that helps consumers search for information about hundreds of thousands of physicians and other health care professionals. The site helps consumers make informed choices about their care.")
93
What you’d want to make prices real and accurate
Paid amounts, not charges Large database so results are statistically significant Acuity adjustment methodology that doesn’t penalize providers who take care of sicker patients

94
Take Homes While we have room to improve on how much HC we use, we’re not that different from others in this regard Where we do differ is that our prices are much higher for the same services While much of HC cost containment to date has been focused on lowering utilization (units used), we must focus attention on prices as well
, we must focus attention on prices as well.")
95
Take Homes One of the ways we might get better pricing is more transparency APCDs offer the chance to get the biggest datasets available Oligopolies generally oppose transparency, as they are designed to maintain higher prices and to avoid price competition

96
Ed Wolking Executive Vice President Detroit Regional Chamber

97
Leapfrog Hospital Recognition Program (LHRP)
")
98
2013 Michigan Hospitals

99
Top Hospitals in MICHIGAN - 2013
Recognition for top performing hospitals - Leapfrog Hospital Survey Top Hospital (hospitals coded as Urban) DMC Detroit Receiving Hospital and University Health Center Mercy Health Saint Mary's Top Children’s Hospital DMC Children's Hospital Of Michigan Top Rural Hospital (includes Critical Access Hospitals) OSF St. Francis Hospital & Medical Group Spectrum Health Kelsey Hospital
 DMC Detroit Receiving Hospital and University Health Center. Mercy Health Saint Mary s. Top Children’s Hospital. DMC Children s Hospital Of Michigan. Top Rural Hospital (includes Critical Access Hospitals) OSF St. Francis Hospital & Medical Group. Spectrum Health Kelsey Hospital.")
100
Regional Initiatives: Detroit and Michigan-Miles to Go Before We Sleep?

101
Moderator: Panelists:
Kirk Roy, Vice President, Office of National Health Reform, Blue Cross Blue Shield of Michigan Panelists: Kate Kohn-Parrott, President and CEO, Greater Detroit Area Health Council Christopher Priest, Senior Strategy Advisor, Office of the Governor

103
Roundtables and Networking

Similar presentations


 implements broad, historic changes to U.S. health care Expanded access to health insurance and care.>")


