Download presentation
Presentation is loading. Please wait.

1
What’s New in Diabetes Maeve C. Durkan MBBS , FACP , Mmed.Ed
Consultant in Diabetes, Endocrinology & Metabolism

2
New Drugs …. Incretins & Pancreatitis/ Pancreatic Cancer Old Drugs … Cardiovascular Safety trials …

4
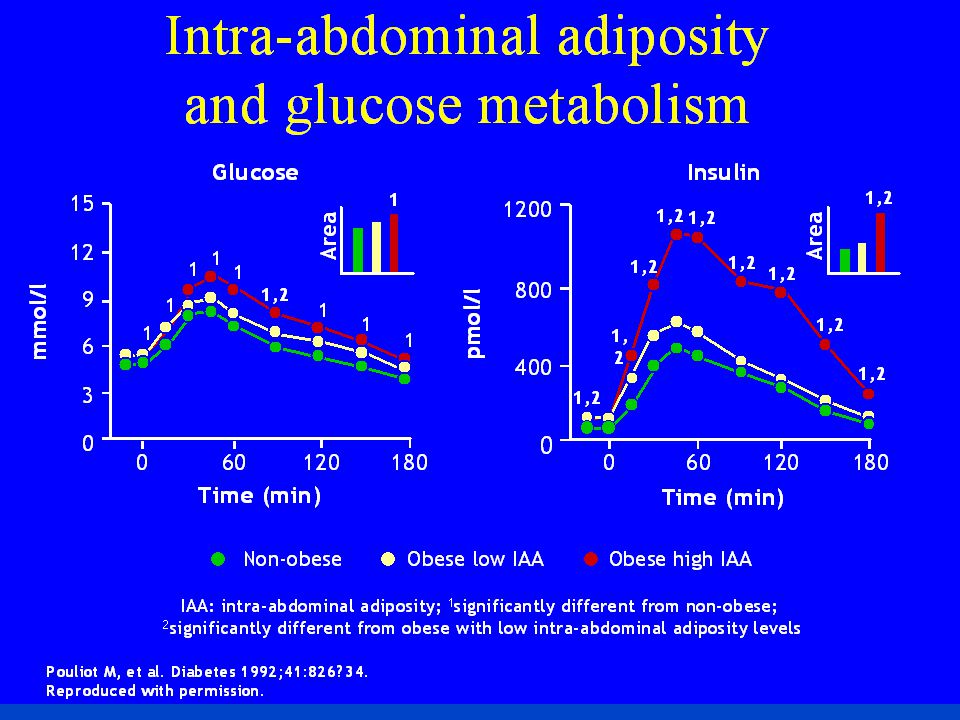
Fat Topography IS/ IR High TG High FFA TG FFA Intramuscular Fat
Subcutaneous Fat Intrahepatic Fat Harold Bays, Lawrence Mandarino, and Ralph A. DeFronzo Role of the Adipocyte, Free Fatty Acids, and Ectopic Fat in Pathogenesis of Type 2 Diabetes Mellitus: Peroxisomal Proliferator-Activated Receptor Agonists Provide a Rational Therapeutic Approach J. Clin. Endocrinol. Metab., Feb 2004; 89: Intra-arterial Fat Intraabdominal Fat Artery Rad 11/3/99 Bays H, Mandarino L, DeFronzo RA. J Clin Endocrinol Metab. 2004;89: 4

5
Stages of T2DM in relationship to B cell function
Impaired glucose tolerance 100 75 50 25 Years from Diagnosis ß-Cell Function (%) Postprandial hyperglycemia DM2 phase I DM2 phase II DM2 phase III 50% of ß-cell function is already lost at diagnosis Elevated PPG occurs before diagnosis Tibaldi J, Rakel RE. Int J Clin Pract 2007; 61 (4):
 Postprandial hyperglycemia. DM2 phase I. DM2 phase II. DM2. phase III. 50% of ß-cell function is already lost at diagnosis. Elevated PPG occurs before diagnosis. Tibaldi J, Rakel RE. Int J Clin Pract 2007; 61 (4):")
6
UKPDS: Glycemic Control With Monotherapy Worsens Over Time
Monotherapy With Insulin, Sulfonylurea (SU), or Metformin 9 8 UKPDS: Glycemic Control With Monotherapy Worsens Over Time A UKPDS study primarily compared the 411 overweight patients assigned conventional treatment and 342 overweight patients assigned intensive treatment with metformin, as designated in the protocol. A secondary analysis compared the 342 overweight patients allocated to metformin with 951 overweight patients allocated to intensive blood-glucose control with chlorpropamide (n=265), glibenclamide (n=277), or insulin (n=409).1 Data for the cohort followed for up to 10 years are shown here. In all the therapeutic groups, a gradual rise in HbA1C levels occurred after an initial response that lowered the HbA1C levels.1 Median HbA1c (%) 7 Conventional (n=200) Chlorpropamide (n=129) Glibenclamide (n=149) Metformin (n=181) Insulin (n=199) 6 3 6 9 Years from randomization Newly diagnosed overweight patients with type 2 diabetes. Data shown are medians for cohorts of patients followed for up to 10 years. Patient numbers shown are at 10 years. Conventional therapy = diet alone; UKPDS = UK Prospective Diabetes Study Adapted with permission from UKPDS Group. Lancet 1998;352:854–865. Reference: 1. UKPDS Group. Effect of intensive blood-glucose control with metformin on complications in overweight patients with type 2 diabetes (UKPDS 34). UK Prospective Diabetes Study (UKPDS) Group. Lancet 1998;352:854–865.
, or Metformin UKPDS: Glycemic Control With Monotherapy Worsens Over Time. A UKPDS study primarily compared the 411 overweight patients assigned conventional treatment and 342 overweight patients assigned intensive treatment with metformin, as designated in the protocol. A secondary analysis compared the 342 overweight patients allocated to metformin with 951 overweight patients allocated to intensive blood-glucose control with chlorpropamide (n=265), glibenclamide (n=277), or insulin (n=409).1 Data for the cohort followed for up to 10 years are shown here. In all the therapeutic groups, a gradual rise in HbA1C levels occurred after an initial response that lowered the HbA1C levels.1. Median HbA1c (%) 7. Conventional (n=200) Chlorpropamide (n=129) Glibenclamide (n=149) Metformin (n=181) Insulin (n=199) Years from randomization. Newly diagnosed overweight patients with type 2 diabetes. Data shown are medians for cohorts of patients followed for up to 10 years. Patient numbers shown are at 10 years. Conventional therapy = diet alone; UKPDS = UK Prospective Diabetes Study. Adapted with permission from UKPDS Group. Lancet 1998;352:854–865. Reference: 1. UKPDS Group. Effect of intensive blood-glucose control with metformin on complications in overweight patients with type 2 diabetes (UKPDS 34). UK Prospective Diabetes Study (UKPDS) Group. Lancet 1998;352:854–865.")
7
What did we get ? What so we want ?
Past Options Now Limited choice Weight gain Hypoglycemia risk approaching target Β cell fatigue Loss durability Complications More choice Weight loss / neutrality Less hypoglycemia risk approaching targets Β cell preservation ! Durability Complications *

8
DURABILITY OF GLYCEMIC CONTROL WITH SULFONYLUREAS
1 Glyburide Glyburide Glimepiride SU Glyburide GLY Alvarsson (n=39) SU Alvarsson (n=48) Gliclazide RECORD (n=272) Change in HbA1c (%) Glyburide Hanefeld (n=250) Charbonnel (n=313) -1 Gliclazide UKPDS (n=1,573) Chicago (n=230) ADOPT (n=1,441) PERISCOPE (n=181) Tan (n=297) -2 1 2 3 4 5 6 10 TIME (years) 8
 SU. Alvarsson (n=48) Gliclazide. RECORD (n=272) Change in HbA1c (%) Glyburide. Hanefeld (n=250) Charbonnel (n=313) -1. Gliclazide. UKPDS (n=1,573) Chicago (n=230) ADOPT (n=1,441) PERISCOPE (n=181) Tan (n=297) TIME (years) 8.")
9
Mortality & HbA1c Targets
ACCORD , High risk, Diabetes Duration 8-10years VADT 1791, High risk, Diabetes Duration 11.5 years ADVANCE 11,140 Moderate risk*, Diabetes Duration 8 year STENO 160, Low risk, Short Duration UKPDS 3867, Low risk*, Newly diagnosed DCCT 1441, Low risk, Diabetes Duration (1-15 years)
")
10
UKPDS / DCCT-EDIC Early glycemic control = Cardiac mortality benefit
Macrovascular/cardiovascular benefit lost > 12 yr ‘Legacy Effect ’ ‘Metabolic Memory’

11
Anti-Diabetic Agents Primary Sites of Action of Oral Antidiabetic Drugs (OADs) -glucosidase inhibitors Sulfonylureas/ meglitinides/ Incretins* Biguanides Thiazolidinediones Carbohydrate breakdown/ absorption Insulin secretion Glucose output Insulin resistance Insulin resistance Kobayashi M. Diabetes Obes Metab 1999; 1 (Suppl. 1): S32–S40. Nattrass M & Bailey CJ. Baillieres Best Pract Res Clin Endocrinol Metab 1999; 13: 309–329.
: S32–S40. Nattrass M & Bailey CJ. Baillieres Best Pract Res Clin Endocrinol Metab 1999; 13: 309–329.")
12
New Drugs in Pipeline SGLT2 Inhibitors Canagliflozin Dapagliflozin
Empagliflozin GLP1 Inhibitors Lixizenatide ( Prandial GLP1) Dulaglutide ( Once weekly) GLP1 Inhibitors in DM1 Basal Insulins ….
 Dulaglutide ( Once weekly) GLP1 Inhibitors in DM1. Basal Insulins ….")
13
Glucose Reabsorption: Proximal Tubule
Glomerulus filters Proximal tubule reabsorbs S1 segment of proximal tubule ~90% glucose reabsorbed Facilitated by SGLT2 Distal S3 segment of proximal tubule ~10% glucose reabsorbed Facilitated by SGLT1 Collecting duct Several classes and types of mediators facilitate glucose transport in the renal tubules Sodium-coupled glucose transporters (SLGTs) transport glucose across the renal tubule membrane, away from the urine SGLT2 is located in the S1 segment of the proximal tubule and facilitates reabsorption of 90% of the glucose it filters SGLT1 is in the distal S3 segment of the proximal tubule and facilitates reabsorption of the remaining 10% Bakris GL, et al. Kidney Int. 2009;75: Silverman M, Turner RJ. In: Windhager EE, ed. Handbook of Physiology, Vol. II. New York, NY: Oxford University Press; 1992: No glucose in filtrate SGLT: sodium glucose transporter Silverman M, Turner RJ. In: Windhager EE, ed. Handbook of Physiology, Vol. II. New York, NY: Oxford University Press; 1992: Bakris GL, et al. Kidney Int. 2009;75:
 transport glucose across the renal tubule membrane, away from the urine. SGLT2 is located in the S1 segment of the proximal tubule and facilitates reabsorption of 90% of the glucose it filters. SGLT1 is in the distal S3 segment of the proximal tubule and facilitates reabsorption of the remaining 10% Bakris GL, et al. Kidney Int. 2009;75: Silverman M, Turner RJ. In: Windhager EE, ed. Handbook of Physiology, Vol. II. New York, NY: Oxford University Press; 1992: No glucose in filtrate. SGLT: sodium glucose transporter. Silverman M, Turner RJ. In: Windhager EE, ed. Handbook of Physiology, Vol. II. New York, NY: Oxford University Press; 1992: Bakris GL, et al. Kidney Int. 2009;75:")
14
Normal physiology of renal glucose homeostasis

15
SGLT2 inhibitors reduce renal glucose reabsorption

16
SGLT2 : Potential Role DM2 at any level
Monotherapy in metformin intolerance Combination therapy with OAD’s Combination therapy with insulin DM1 as adjunct therapy

17
SGLT2 …Salutory Effects
Body weight & Body composition change with fat mass & central body fat SBP Clear difference in uncontrolled hypertension. 24 hour ambulatory BP sub 3months ( SBP & DBP) Uric acid levels * Lipids ..Clear in LDL & HDL ( 6-12%)
 Uric acid levels * Lipids ..Clear in LDL & HDL ( 6-12%)")
18
SGLT2 Inhibitors Pros Cons UTI & Genital tract infections
LDL (unclear mechanism) HDL (unclear mechanism) No CV signal yet Canvas Limited to CKD ( eGFR>45) Reversible shift in GFR Easily added to anything, and/or insulin in DM1 & 2 Simple & dose response Concomitant weight loss SBP & DBP reduction HbA1c reduction No hypoglycemia
 HDL (unclear mechanism) No CV signal yet. Canvas. Limited to CKD ( eGFR>45) Reversible shift in GFR. Easily added to anything, and/or insulin in DM1 & 2. Simple & dose response. Concomitant weight loss. SBP & DBP reduction. HbA1c reduction. No hypoglycemia.")
19
SGLT2 & Insulin 20-30% reduction in insulin doses
Still achieving HbA1c targets in hypoglycemic risk as one approaches targets

20
CV Safety & CV trials Empagliflozin :EMPA-REG ( 7000 patients)
Dapagliflozin :DECLARE ( patients) Capagliflozin :CANVAS ( 4300 patients)* Metanalysis …. Dapagliflozin ( 14 trials) Canagliflozin ( 9 trials)
 Capagliflozin :CANVAS ( 4300 patients)* Metanalysis …. Dapagliflozin ( 14 trials) Canagliflozin ( 9 trials)")
21
UKPDS: Glycemic Control With Monotherapy Worsens Over Time
Monotherapy With Insulin, Sulfonylurea (SU), or Metformin 9 8 UKPDS: Glycemic Control With Monotherapy Worsens Over Time A UKPDS study primarily compared the 411 overweight patients assigned conventional treatment and 342 overweight patients assigned intensive treatment with metformin, as designated in the protocol. A secondary analysis compared the 342 overweight patients allocated to metformin with 951 overweight patients allocated to intensive blood-glucose control with chlorpropamide (n=265), glibenclamide (n=277), or insulin (n=409).1 Data for the cohort followed for up to 10 years are shown here. In all the therapeutic groups, a gradual rise in HbA1C levels occurred after an initial response that lowered the HbA1C levels.1 Median HbA1c (%) 7 Conventional (n=200) Chlorpropamide (n=129) Glibenclamide (n=149) Metformin (n=181) Insulin (n=199) 6 3 6 9 Years from randomization Newly diagnosed overweight patients with type 2 diabetes. Data shown are medians for cohorts of patients followed for up to 10 years. Patient numbers shown are at 10 years. Conventional therapy = diet alone; UKPDS = UK Prospective Diabetes Study Adapted with permission from UKPDS Group. Lancet 1998;352:854–865. Reference: 1. UKPDS Group. Effect of intensive blood-glucose control with metformin on complications in overweight patients with type 2 diabetes (UKPDS 34). UK Prospective Diabetes Study (UKPDS) Group. Lancet 1998;352:854–865.
, or Metformin UKPDS: Glycemic Control With Monotherapy Worsens Over Time. A UKPDS study primarily compared the 411 overweight patients assigned conventional treatment and 342 overweight patients assigned intensive treatment with metformin, as designated in the protocol. A secondary analysis compared the 342 overweight patients allocated to metformin with 951 overweight patients allocated to intensive blood-glucose control with chlorpropamide (n=265), glibenclamide (n=277), or insulin (n=409).1 Data for the cohort followed for up to 10 years are shown here. In all the therapeutic groups, a gradual rise in HbA1C levels occurred after an initial response that lowered the HbA1C levels.1. Median HbA1c (%) 7. Conventional (n=200) Chlorpropamide (n=129) Glibenclamide (n=149) Metformin (n=181) Insulin (n=199) Years from randomization. Newly diagnosed overweight patients with type 2 diabetes. Data shown are medians for cohorts of patients followed for up to 10 years. Patient numbers shown are at 10 years. Conventional therapy = diet alone; UKPDS = UK Prospective Diabetes Study. Adapted with permission from UKPDS Group. Lancet 1998;352:854–865. Reference: 1. UKPDS Group. Effect of intensive blood-glucose control with metformin on complications in overweight patients with type 2 diabetes (UKPDS 34). UK Prospective Diabetes Study (UKPDS) Group. Lancet 1998;352:854–865.")
22
Physiologic Glucose Control
Incretins Modulate Insulin and Glucagon to Decrease Blood Glucose During Hyperglycemia Meal Muscle Peripheral glucose uptake Increased insulin (beta cells) Adipose tissue Glucose Dependent GIP Gut Incretins Modulate Insulin and Glucagon to Decrease Blood Glucose Levels During Hyperglycemia This schematic summarizes the pathways related to the observed effects of glucagon-like peptide-1(GLP-1) and glucose-dependent insulinotropic polypeptide (GIP) on insulin and GLP-1 on glucagon. Following a meal, the release of incretins is stimulated: GLP-1 from L cells located primarily in the distal gut (ileum and colon) and GIP from K cells in the proximal gut (duodenum).1 Together, these incretins enhance the insulin response of the pancreatic beta cells to an oral glycemic challenge.1 GLP-1 helps suppress glucagon secretion from pancreatic alpha cells when glucose levels are elevated.2-5 The subsequent insulin-induced increase in glucose uptake by muscles and other tissues and the reduced glucose output (the result of increased insulin and decreased glucagon) from the liver result in better physiologic control of glucose levels.2-5 GLP-1 Pancreas Physiologic Glucose Control Glucose Dependent Decreased glucagon (alpha cells) Liver Glucose production GLP-1=glucagon-like peptide-1; GIP=glucose-dependent insulinotropic polypeptide. Brubaker PL et al. Endocrinology 2004;145:2653–2659; Zander M et al. Lancet 2002;359:824–930; Ahren B. Curr Diab Rep 2003;3:365–372; Buse JB et al. In Williams Textbook of Endocrinology. 10th ed. Philadelphia, Saunders, 2003:1427–1483; Drucker DJ. Diabetes Care 2003;26:2929–2940. References Drucker DJ. Enhancing incretin action for the treatment of type 2 diabetes. Diabetes Care 2003;26:2929–2940 Brubaker PL, Drucker DJ. Minireview: Glucagon-like peptides regulate cell proliferation and apoptosis in the pancreas, gut, and central nervous system. Endocrinology 2004;145: 2653–2659. Zander M, Madsbad S, Madsen JL et al. Effect of 6-week course of glucagon-like peptide 1 on glycaemic control, insulin sensitivity, and β-cell function in type 2 diabetes: A parallel-group study. Lancet 2002;359:824–830. Ahrén B. Gut peptides and type 2 diabetes mellitus treatment. Curr Diab Rep 2003;3:365–372. Buse JB, Polonsky KS, Burant CF. Type 2 diabetes mellitus. In: Larsen PR, Kronenberg HM, Melmed S et al, eds. Williams Textbook of Endocrinology. 10th ed. Philadelphia: Saunders, 2003:1427–1483.
 Adipose tissue. Glucose. Dependent. GIP. Gut. Incretins Modulate Insulin and Glucagon to Decrease Blood Glucose Levels During Hyperglycemia. This schematic summarizes the pathways related to the observed effects of glucagon-like peptide-1(GLP-1) and glucose-dependent insulinotropic polypeptide (GIP) on insulin and GLP-1 on glucagon. Following a meal, the release of incretins is stimulated: GLP-1 from L cells located primarily in the distal gut (ileum and colon) and GIP from K cells in the proximal gut (duodenum).1. Together, these incretins enhance the insulin response of the pancreatic beta cells to an oral glycemic challenge.1 GLP-1 helps suppress glucagon secretion from pancreatic alpha cells when glucose levels are elevated.2-5. The subsequent insulin-induced increase in glucose uptake by muscles and other tissues and the reduced glucose output (the result of increased insulin and decreased glucagon) from the liver result in better physiologic control of glucose levels.2-5. GLP-1. Pancreas. Physiologic Glucose Control. Glucose. Dependent. Decreased glucagon. (alpha cells) Liver. Glucose. production. GLP-1=glucagon-like peptide-1; GIP=glucose-dependent insulinotropic polypeptide. Brubaker PL et al. Endocrinology 2004;145:2653–2659; Zander M et al. Lancet 2002;359:824–930; Ahren B. Curr Diab Rep 2003;3:365–372; Buse JB et al. In Williams Textbook of Endocrinology. 10th ed. Philadelphia, Saunders, 2003:1427–1483; Drucker DJ. Diabetes Care 2003;26:2929–2940. References. Drucker DJ. Enhancing incretin action for the treatment of type 2 diabetes. Diabetes Care 2003;26:2929–2940. Brubaker PL, Drucker DJ. Minireview: Glucagon-like peptides regulate cell proliferation and apoptosis in the pancreas, gut, and central nervous system. Endocrinology 2004;145: 2653–2659. Zander M, Madsbad S, Madsen JL et al. Effect of 6-week course of glucagon-like peptide 1 on glycaemic control, insulin sensitivity, and β-cell function in type 2 diabetes: A parallel-group study. Lancet 2002;359:824–830. Ahrén B. Gut peptides and type 2 diabetes mellitus treatment. Curr Diab Rep 2003;3:365–372. Buse JB, Polonsky KS, Burant CF. Type 2 diabetes mellitus. In: Larsen PR, Kronenberg HM, Melmed S et al, eds. Williams Textbook of Endocrinology. 10th ed. Philadelphia: Saunders, 2003:1427–1483.")
23
GLP-1 restores insulin and glucagon responses in a glucose-dependent manner in type 2 diabetes
Adapted from Nauck MA et al. Diabetologia 1993;36:741–4. Type 2 diabetes patients, n=10 †GLP-1(7–36 amide) infused at 1.2 pmol/kg/min for 240 min *p<0.05 C-peptide (nmol/L) Glucagon (pmol/L) Time (min) 17.5 15.0 12.5 10.0 7.5 5.0 2.5 0.0 3.0 2.0 1.5 1.0 0.5 30 25 20 15 10 5 – Infusion * GLP-1† Saline Glucose (mmol/L) GLP-1 Restores Insulin and Glucagon Responses in a Glucose-Sensitive Manner in Patients with T2DM The glucose-dependent effects of glucagon-like peptide-1 (GLP-1) on insulin and glucagon responses were demonstrated in a study of type 2 diabetes mellitus (T2DM) patients with poor metabolic control.1 Ten patients with T2DM in whom diet and medications had yielded unsatisfactory glycemic control (HbA1c ± 1.7%) underwent intravenous infusion of saline (placebo) or GLP-1(7–36 amide) (infused at 1.2 pmol/kg/min for 240 minutes) in the fasting state. GLP-1 infusion led to a significant drop in plasma glucose (left-hand graph) compared with the effect of saline solution. Insulin levels in response to the GLP-1 infusion, measured as C-peptide (middle graph), rose significantly during the initial phase when glucose was in the higher range. As glucose level asymptotically approached normal range, the insulin level concomitantly dropped despite continuous GLP-1 infusion. Glucagon (right-hand graph) levels were significantly reduced in response to higher glucose levels; glucagon levels then increased as the glucose level asymptotically approached normal range despite continuous GLP-1 infusion. These findings suggest that GLP-1 stimulates sensitivity of pancreatic α- and β-cells to secrete glucagon and insulin, respectively, in a glucose-dependent manner. This slide thus illustrates why GLP-1 is an effective means of addressing post-prandial glucose excursions Reference Nauck MA, et al. Normalization of fasting hyperglycaemia by exogenous glucagon-like peptide 1 (7-36 amide) in type 2 (non-insulin-dependent) diabetic patients. Diabetologia. 1993; 36: 741–744. –
 infused at 1.2 pmol/kg/min for 240 min. *p<0.05. C-peptide (nmol/L) Glucagon (pmol/L) Time (min) – Infusion. * GLP-1† Saline. Glucose (mmol/L) GLP-1 Restores Insulin and Glucagon Responses in a Glucose-Sensitive Manner in Patients with T2DM. The glucose-dependent effects of glucagon-like peptide-1 (GLP-1) on insulin and glucagon responses were demonstrated in a study of type 2 diabetes mellitus (T2DM) patients with poor metabolic control.1. Ten patients with T2DM in whom diet and medications had yielded unsatisfactory glycemic control (HbA1c 11.6 ± 1.7%) underwent intravenous infusion of saline (placebo) or GLP-1(7–36 amide) (infused at 1.2 pmol/kg/min for 240 minutes) in the fasting state. GLP-1 infusion led to a significant drop in plasma glucose (left-hand graph) compared with the effect of saline solution. Insulin levels in response to the GLP-1 infusion, measured as C-peptide (middle graph), rose significantly during the initial phase when glucose was in the higher range. As glucose level asymptotically approached normal range, the insulin level concomitantly dropped despite continuous GLP-1 infusion. Glucagon (right-hand graph) levels were significantly reduced in response to higher glucose levels; glucagon levels then increased as the glucose level asymptotically approached normal range despite continuous GLP-1 infusion. These findings suggest that GLP-1 stimulates sensitivity of pancreatic α- and β-cells to secrete glucagon and insulin, respectively, in a glucose-dependent manner. This slide thus illustrates why GLP-1 is an effective means of addressing post-prandial glucose excursions. Reference. Nauck MA, et al. Normalization of fasting hyperglycaemia by exogenous glucagon-like peptide 1 (7-36 amide) in type 2 (non-insulin-dependent) diabetic patients. Diabetologia. 1993; 36: 741–744. –")
24
Choice of GLP-1 receptor agonist: short acting versus long acting
The pharmacological profile and half-life of a GLP-1 receptor agonist influences its effects on postprandial and basal (fasting) glycaemia SHORT ACTING GLP-1 receptor agonists eg. Lixisenatide OD, Exenatide BD LONG ACTING GLP-1 receptor agonists eg. Liraglutide OD, Exenatide QW or Effect on FPG Effect on PPG Effect on FPG Effect on PPG Speaker Notes It is becoming increasingly apparent that the GLP-1 receptor agonist class can be subdivided into 2 types which result in different effects on fasting and postprandial glucose levels: As a consequence of their pharmacological profiles, prandial GLP-1 receptor agonists such as exenatide and lixisenatide, have a greater effect on lowering postprandial glucose levels, than they do fasting glucose levels. Similarly as a consequence of their pharmacological profile and more protracted half lives Non-prandial GLP-1 receptor agonists such as liraglutide and once weekly exenatide have relatively greater effects on fasting plasma glucose levels. Reference Fineman MS, et al. GLP-1 based therapies: differential effects on fasting and postprandial glucose. Diabetes Obes Metab. 2012;14(8): Annotation Fineman. Diabetes Obes Metab.January.2012/p1/lines A6-A8; p9/c2/table 3 FPG = fasting plasma glucose PPG = postprandial glucose Fineman MS et al. Diabetes Obes Metab 2012;14:675-88
 glycaemia. SHORT ACTING GLP-1 receptor agonists. eg. Lixisenatide OD, Exenatide BD. LONG ACTING GLP-1 receptor agonists. eg. Liraglutide OD, Exenatide QW. or. Effect on FPG. Effect on PPG. Effect on FPG. Effect on PPG. Speaker Notes. It is becoming increasingly apparent that the GLP-1 receptor agonist class can be subdivided into 2 types which result in different effects on fasting and postprandial glucose levels: As a consequence of their pharmacological profiles, prandial GLP-1 receptor agonists such as exenatide and lixisenatide, have a greater effect on lowering postprandial glucose levels, than they do fasting glucose levels. Similarly as a consequence of their pharmacological profile and more protracted half lives Non-prandial GLP-1 receptor agonists such as liraglutide and once weekly exenatide have relatively greater effects on fasting plasma glucose levels. Reference. Fineman MS, et al. GLP-1 based therapies: differential effects on fasting and postprandial glucose. Diabetes Obes Metab. 2012;14(8): Annotation. Fineman. Diabetes Obes Metab.January.2012/p1/lines A6-A8; p9/c2/table 3. FPG = fasting plasma glucose PPG = postprandial glucose. Fineman MS et al. Diabetes Obes Metab 2012;14:")
25
Short Acting GLP-1 receptor agonist1**
Complementary actions on FPG and PPG may provide additional HbA1c control + Short Acting GLP-1 receptor agonist1** Basal Insulin* FPG PPG FPG PPG HbA1c 7.0% mmol/mol Speaker Notes In order to deliver optimal blood glucose control targets, both fasting and post prandial blood glucose levels need to be addressed3. Basal insulin is an effective means of targeting fasting plasma glucose 2, while the addition of a prandial GLP-1 receptor agonist represents an ideal complementary therapy in combination with optimally titrated basal insulin1,2, in order to provide additional improvements in Hba1c. Indeed, Targeting FPG with basal insulin in patients insufficiently controlled (HbA1c <7%) on oral agents has been shown to markedly increase the relative contribution of postprandial glucose to overall glycaemia from 20–24% to 59–69%4. Thus, in terms of achieving HbA1c targets, a focus on postprandial glucose may become increasingly relevant at lower (but still suboptimal) HbA1c levels5. Furthermore, postprandial glucose may also be an important determinant of diabetes-related complications both independently and through a contribution to overall glycaemia6. References Fineman MS et al. GLP-1 based therapies: differential effects on fasting and postprandial glucose. Diabetes ObesMetab. 2012;14(8): Buse JB et al. Use of twice-daily exenatide in basal insulin–treated patients with type 2 diabetes. Ann Intern Med. 2011;154(2): Standards of medical care in diabetes—2012. Diabetes Care. 2012;35(Suppl 1):S11-S63. Riddle M et al. Contributions of basal and postprandial hyperglycemia over a wide range of A1C levels before and after treatment intensification in type 2 diabetes. Diabetes Care. 2011;34: Monnier L et al. Contributions of fasting and postprandial plasma glucose increments to the overall diurnal hyperglycemia of type 2 diabetic patients: variations with increasing levels of HbA1c. Diabetes Care 2003; 26: 881–885 Ceriello A et al. International Diabetes Federation guideline for management of post-meal glucose: a review of recommendations. Diabet. Med. 2008; 25: 1151–1156. Annotations Buse.Ann Intern Med.December.2011/p103/c2/lines 1-6 Buse.Ann Intern Med.December.2011/p108/c1/lines 19-21 Buse.Ann Intern Med.December.2011/p108/c2/lines 1-10 Buse.Ann Intern Med.December.2011/p110/c1/lines 3-21 * Insulin glargine ** Exenatide 10 mcg BD Primary outcome: HbA1c decreased by 1.74% with exenatide and 1.04% with placebo (between-group difference -0.69%, p<0.001)2 FPG = fasting plasma glucose; PPG = postprandial glucose 1Fineman MS et al. Diabetes Obes Metab 2012;14:675-88 2Buse JB et al. Ann Intern Med 2011;154:103-12
 on oral agents has been shown to markedly increase the relative contribution of postprandial glucose to overall glycaemia from 20–24% to 59–69%4. Thus, in terms of achieving HbA1c targets, a focus on postprandial glucose may become increasingly relevant at lower (but still suboptimal) HbA1c levels5. Furthermore, postprandial glucose may also be an important determinant of diabetes-related complications both independently and through a contribution to overall glycaemia6. References. Fineman MS et al. GLP-1 based therapies: differential effects on fasting and postprandial glucose. Diabetes ObesMetab. 2012;14(8): Buse JB et al. Use of twice-daily exenatide in basal insulin–treated patients with type 2 diabetes. Ann Intern Med. 2011;154(2): Standards of medical care in diabetes—2012. Diabetes Care. 2012;35(Suppl 1):S11-S63. Riddle M et al. Contributions of basal and postprandial hyperglycemia over a wide range of A1C levels before and after treatment intensification in type 2 diabetes. Diabetes Care. 2011;34: Monnier L et al. Contributions of fasting and postprandial plasma glucose increments to the overall diurnal hyperglycemia of type 2 diabetic patients: variations with increasing levels of HbA1c. Diabetes Care 2003; 26: 881–885. Ceriello A et al. International Diabetes Federation guideline for management of post-meal glucose: a review of recommendations. Diabet. Med. 2008; 25: 1151–1156. Annotations. Buse.Ann Intern Med.December.2011/p103/c2/lines 1-6. Buse.Ann Intern Med.December.2011/p108/c1/lines Buse.Ann Intern Med.December.2011/p108/c2/lines Buse.Ann Intern Med.December.2011/p110/c1/lines * Insulin glargine ** Exenatide 10 mcg BD. Primary outcome: HbA1c decreased by 1.74% with exenatide and 1.04% with placebo (between-group difference -0.69%, p<0.001)2. FPG = fasting plasma glucose; PPG = postprandial glucose. 1Fineman MS et al. Diabetes Obes Metab 2012;14: Buse JB et al. Ann Intern Med 2011;154:")
26
New GLP1 Lixizenatide ( Lyxiuma) Prandial GLP1
Combination with basal insulin in DM2 Reduced insulin doses Reduced FPG & PPG Greater attainment A1c targets Less hypoglycemia Similar outcome c/w prandial insulin

27
Lixisenatide: prefilled fixed-dose pen
10 mcg There are two different pens for the different doses Pens are coloured coded for the different doses Green for the 10 mcgs Purple for the 20 mcgs dose In addition, the pens have ridges on so that people who are sight impaired can distinguish between the two for safety 20 mcg

28
New GLP1 (once weekly)..Delaglutide
Colourless HbA1c reductions simliar to Exentauide LAR No reconstitution

29
GLP1 analogues in DM1 Liraglutide : Pilot study
10 weeks only ; Pilot study No adverse outcomes 20-30% reduction Insulin doses ( Basal) Greater attainment HbA1c Less hypoglycemia Less weight gain EASD 2013
 Greater attainment HbA1c. Less hypoglycemia. Less weight gain. EASD")
30
GLP1 analogs & DM1 Krieger et al., Diab Care
29 patients, Liraglutide , 8 weeks, CGM insulin dose, weight, hypos, time in hypo Varanasi et al, Eur J Endo 2011 14 patients , 8 for 24weeks Liraglutide , insulin dose, weight, time in hyperglycemia Harrison et al , J Invest Med 2013 Liraglutide in11 patients on insulin pump , insulin dose Kuhadiye et al, Endo practice DM1 , Liraglutide & CSII

31
DPP IV Inhibitors & DM1 Vildagliptin Sitagliptin
Farngren et al, JCEM 2012 ( 28 patients, DM1 2-20years, 8weeks) Sitagliptin Ellis et al , Diabe Med 2011 ( DM years, 8 weeks )
 Sitagliptin. Ellis et al , Diabe Med 2011 ( DM years, 8 weeks )")
32
Pancreatitis Cigarette smoking …Dose dependent effect
500 drugs reported ..60 confirmed on rechallenge Metabolic causes: Obesity, ETOH, High Tg, Obesity DM2 alone confers fold risk

33
DPPIV (Gliptins) & Pancreatitis
Acute Pancreatitis Drug Arm Placebo Arm Alogliptin (EXAMINE) 5380 NEJM , Oct 3, 2013 12 8 Numeracy ns Saxagliptin ( Savor TIMI 53) 16,459 NEJM Oct 3, 2013 17 9 Monitoring Lipase/ Amylase ? No role currently Patients in whom to avoid prescription ? Chronic pancreatitis Alcohol excess
 NEJM , Oct 3, Numeracy ns. Saxagliptin ( Savor TIMI 53) 16,459. NEJM Oct 3, Monitoring Lipase/ Amylase No role currently. Patients in whom to avoid prescription Chronic pancreatitis. Alcohol excess.")
34
GLP1 Drugs & Pancreatic Cancer
McGovern , 2011 Butler et al, Diab Med 2013

35
DPPIV (Gliptins) & Pancreatic Cancer
Acute Pancreatitis Drug Arm Placebo Arm Liraglutide Dose dependent increase beta cell mass at 52 weeks ( female only), but no dose increase after 87 week Alogliptin ( EXAMINE) 5380 Same pancreatic cancer Same (51 any cancer) 55 any cancer Saxagliptin ( Savor TIMI 53) 16000 5 pancreatic cancer c/w 12 placebo Same (327 any cancer) 362 any cancer
, but no dose increase after 87 week. Alogliptin ( EXAMINE) Same pancreatic cancer. Same (51 any cancer) 55 any cancer. Saxagliptin ( Savor TIMI 53) pancreatic cancer c/w 12 placebo. Same (327 any cancer) 362 any cancer.")
36
Cardiovascular Safety & Benefit
Glucophage Sulphonylureas Pioglitazone/ Rosiglitazone Insulin DPPIV Inhibitors GLP1 agonists

37
What about the Old Days ?Metformin
UKPDS ….5102 patients Newly diagnosed 3876 Randomized to diet, insulin, sulphonylurea 753 ( Body weight >20%)…diet or metformin Target FBS <15, interim change to < 6 1st trial 1997….vs. diet , RR reduction cv event 36% But : Underpowered & number 342 HR 0.84 , p = 0.052 30 years 2012 …HR 0.85, p 0.014
…diet or metformin. Target FBS <15, interim change to < 6. 1st trial 1997….vs. diet , RR reduction cv event 36% But : Underpowered & number 342. HR 0.84 , p = years 2012 …HR 0.85, p")
38
What about the Old Days ? Sulphonylurea
Phung et al , Diab Med 2012 SU ..RR 1.27 ( Cardiac death) SU...RR (Cardiac event) SU compared with Metformin ….RR 1.26 ( Cardiac Death) ….RR 1.10 ( Cardiac event)
 SU...RR 1.10 (Cardiac event) SU compared with Metformin ….RR 1.26 ( Cardiac Death) ….RR 1.10 ( Cardiac event)")
39
DPPIV (Gliptins) & Heart Failure*
Acute Pancreatitis Drug Arm Placebo Arm P value Alogliptin (EXAMINE) High Risk / ACS 12 (0.4%) 11.3% (10 event) 8 (0.3%) 11.8% (10 event) Top quintile ProBNP ns Saxagliptin ( Savor TIMI 53) 16000 3.5% (613/7.3% 10event) 2.8% 609/7.2% 10 event) Vildagliptin No excess CHF, but LV volume increase TECOS critical
 High Risk / ACS. 12 (0.4%) 11.3% (10 event) 8 (0.3%) 11.8% (10 event) Top quintile ProBNP. ns. Saxagliptin ( Savor TIMI 53) % (613/7.3% 10event) 2.8% 609/7.2% 10 event) Vildagliptin. No excess CHF, but LV volume increase. TECOS critical.")
40
DPPIV (Gliptins) & Microalbuminuria
Acute Pancreatitis Drug Arm Placebo Arm Alogliptin (EXAMINE) Reduced progression Saxagliptin ( Savor TIMI 53) 16000 Significant reduction in progression* and more improved
 Reduced progression. Saxagliptin ( Savor TIMI 53) Significant reduction in progression* and more improved.")
41
DPPIV (Gliptins) & Hypoglycemia
Acute Pancreatitis Drug Arm Alogliptin (EXAMINE) 5389 Linked to Su therapy c/w placebo Saxagliptin ( Savor TIMI 53) 16 , 492 Linked to SU therapy c/w placebo Especially with A1c <7%
 Linked to Su therapy c/w placebo. Saxagliptin ( Savor TIMI 53) 16 , 492. Linked to SU therapy c/w placebo. Especially with A1c <7%")
Similar presentations


 HbA1c – IFFC (mmol/mol) 6.042 6.548 7.053 7.559 8.064 9.075.>")


