Download presentation
Presentation is loading. Please wait.

1
Addressing Health Literacy and Health Communication in Diabetes and Obesity
Russell L. Rothman MD MPP Associate Professor, Internal Medicine & Pediatrics Director, Center for Health Services Research Chief, Internal Medicine/Pediatrics Section Co-Director, Community Engaged Research, VICTR Associate Director, Center for Diabetes Translational Research Vanderbilt University Medical Center Thank you. It is a pleasure to be here with you this morning. I am going to give a brief overview of our Center for Health Services Research and then focus on research that we have been doing that examine the role of health literacy and health communication in patient care.

2
Disclosed no conflict of interest.
Presenter Disclosure Disclosed no conflict of interest.

3
Why inadequate diabetes care?
Community Cultural beliefs Access to Care Access to Diet Access to Exercise Environmental Factors System Insurance/Financing Focus on Acute Care Lack of EMR Bureaucracy Quality Patient Physiology/genetics SES factors Knowledge/Attitudes/Beliefs Behaviors/ Adherence Health Literacy Provider Knowledge Attitudes/Beliefs Behaviors Incentives Health Communication Skills

4
Increasing Concern about Literacy and Numeracy Skills
Ok, I would now like to transition to discussing my own research related to Health Literacy and health Communication. Some of you may be aware that literacy issues are of increasing concern in this country.

5
Literacy is a Complex Skill
Cultural and Conceptual Knowledge Speaking Reading Numeracy Listening Writing Print Literacy Oral Literacy Literacy actually consists of numerous components including listening and speaking skills – which are one’s oral literacy, writing andreading skills – or print literacy, and numeracy – or ones math skills. IOM, Health Literacy, 2004

6
Poor Health Literacy is Common
Health literacy: “the capacity to obtain, process, and understand basic health information and services needed to make appropriate health decisions.” Over 90 million Adult Americans have poor literacy skills and over 110 million have poor quantitative skills Difficulty navigating health system, understanding materials and recommendations, performing self-care, etc. And Health Litearcy is defined as the “the capacity to obtain, process, and understand basic health information and services needed to make appropriate health decisions” In 1992 and in 2003 the US Dept of Education did a national study which found that over 90 million americans have difficulties with literacy and over 110 million have poor quantitative or numeracy skills. The avg american only reads at the 8th-9thgrade level, and their math skills are typically worse. As you can imagine, having poor literacy and numeracy skills is particualrly challenging when trying to navigate our health care system – which is getting more and more complex and which is asking patients to do more and more to take care of themselves.

7
Numeracy is an Important Component
“The ability to understand and use numbers and math skills in daily life” Calculations, deduction/logic, interpretation of graphs/labels, time, probability, etc. Highly correlated with literacy, but not perfect Numeracy skills are particularly important in health care where we ask patients to understand risk and probability, read food labels, understand medicaiton dosing and other issues. And our research group did some of the seminal research on the role of numeracy in health. We defined numeracy as “the ability to understand and use numbers and math skills in daily life” While most people think of numeracy as being about calcualtions, it also includes a host of other skills including deduction/logic, interpretation of graphs/labels, time, probability, etc. And while patient literacy is highly correlated with numeracy it is not perfect. There are a lot of people with adequate literacy skills, but poor numeracy skills. Like Calvin in this old Calvin and Hobbs cartoon – they had a hard time with math back in elementary school – and now they are very intimidated when they see numbers. They break out in a sweat, they get anxious – and here we are in health care talking with people and asking them to do a lot of math! Calvin and Hobbs, Bill Watterson, Universal Press Syndicate, Released on: Friday, Oct 10th 1986. Rothman et al, J Health Comm, 2009

8
Why is literacy important in health care and research?
Patients with low literacy have: Trouble reading prescriptions, following medical instructions Trouble understanding educational materials Trouble interpreting and applying numbers to health situations Trouble consenting to research or procedures Difficulty answering survey items or other measures Difficulty following research protocols

9
Why is numeracy important in health care?
Patients with low numeracy may have trouble: Understanding dosages of medications Understanding the timing of when to take medications or have them refilled Interpreting nutritional information Understanding volume status Interpreting blood sugars, adjusting insulin Understanding risks and probability

10
What it is like for patients…

11
Many Outcomes Associated with Literacy
Behaviors Breastfeeding Behavioral problems Adherence to medication Smoking, Substance abuse Knowledge Food label and portion size understanding Birth control knowledge Emergency department instructions Asthma knowledge Hypertension knowledge Health Outcomes/Services General health status Hospitalization Mortality Emergency department use Depression Diabetes control HIV control Prostate Cancer Stage BMI Mammography Pap smear, STD Screening Immunizations Cost Over the past decade there have been a series of predominantly cross sectional studies, including many by our group that have now shown that literacy is significantly associated with health behaviors, health knowledge, and even health outcomes. For example, studies have shown that poor health literacy is associated with increased risk for hospitalization and even mortality. Most of these studies have shown that literacy is important even after adjusting for covariates such as education level, SES, age, income, and other factors. DeWalt, JGIM 2004 McCormack, Annals of Internal Medicine 2011

12
Literacy/Numeracy & Diabetes
Literacy skills needed: Knowledge of disease prevention and disease Understanding of educational materials Performance of self-management tasks Interaction with medical system Numeracy skills needed: Understanding of risk and probability Understanding weight status Understanding medications Understanding nutrition information Understanding exercise Interpreting glucose and other measures Studies have shown that diabetes patients with low literacy can have worse knowledge of their diabetes, worse blood sugar control, and higher diabetes related complications. Numeracy may be particularly important for patients with diabetes. Patients with diabetes need to use numbers on a daily basis for such tasks as: Glucose monitoring Carbohydrate counting Adjusting insulin based on blood sugar Adjusting insulin based on carbohydrates Insulin pump adjustment

13
Literacy and Diabetes Outcomes
Schillinger, JAMA, 2002

14
Numeracy and Food Labels
One of the next studies we did, was a study to examine how patients understand food labels. As you can see food labels are actually very dense – with a lot of complicated information. Understanding of food labels can be particularly important for followlojgn a good diet- especially for patients with diabetes

15
Study Design Design: Cross sectional survey
Setting: Primary care clinic Instruments: Demographics Food Label Usage and Attitudes Assessed literacy with REALM Assessed numeracy with WRAT3 26 item food label survey Rothman et al, AM J Prev Med, November 2006

16
Demographics Variable (n=200) Avg (SD) or Percent Age 43 (15) Female
72% African American 25% Family Income < $20,000 Private Insurance 75% HS education or less 33% Chronic Illness requiring dietary restriction 41% BMI (n=151) 30 (7) Reads Food Labels 89%
 30 (7) Reads Food Labels. 89%")
17
Literacy, Numeracy, Food Labels
Variable (n=200) Percent Literacy (REALM) <= 8th Grade 23% Numeracy (WRAT) <= 8th Grade 63% Food Label Score (Range 30% - 100%) 69% (19%) Internal Reliability (KR 20) 0.87
 Percent. Literacy (REALM) <= 8th Grade. 23% Numeracy (WRAT) <= 8th Grade. 63% Food Label Score (Range 30% - 100%) 69% (19%) Internal Reliability (KR 20)")
18
Calculating Fiber Intake
How many grams of dietary fiber are in 5 candies? Correct Response: 1 gram Percent Correct 66 %

19
Nutrition Score by Characteristics
Variable (n=200) Mean Nutrition Score (SD) p value Age < 65 ≥ 65 yrs 70 (21) 59 (19) 0.04 Gender Female Male 67 (21) 74 (20) Race White Black Other 74 (19) 57 (18) 77 (18) <0.0001 Private Insurance Yes No 73 (20) Chronic Illness* 65 (20) 72 (20) BMI < 30 ≥ 30 73 (21) 66 (20)
 Mean Nutrition Score (SD) p value. Age. < 65. ≥ 65 yrs. 70 (21) 59 (19) Gender. Female. Male. 67 (21) 74 (20) Race. White. Black. Other. 74 (19) 57 (18) 77 (18) < Private Insurance. Yes. No. 73 (20) Chronic Illness* 65 (20) 72 (20) BMI. < 30. ≥ (21) 66 (20)")
20
Nutrition Score Correlations
Higher performance on the food label survey was significantly correlated with: Higher education (r=0.44) Higher income (r=0.56) Higher literacy (r=0.52) Higher numeracy (r=0.67)
 Higher income (r=0.56) Higher literacy (r=0.52) Higher numeracy (r=0.67)")
21
Conclusions Patient comprehension of food labels was fair.
Comprehension was worse when patient needed to apply serving sizes, or perform multi-step math. Comprehension was worse for patients who were obese or had chronic illness Comprehension was highly correlated with math and literacy skills

22
Literacy, Numeracy, Food Labels
This study generated a lot of press – including a story on CNN, the NY Times, the Tennessea, and over 200 other newspapers, televion, and other media outlets. Our hope is that this study will encourage providers to be more careful in what they recommend to their patients, and this study has also opened a dialogue for us with the FDA about the design of current food lavels and how to make them easier for people to understand.

23
Portion Size Study Enrolled 164 pts
20 Years Ago Today Enrolled 164 pts Asked to serve “single serving” of 4 items, and then told to serve actual amount (in oz or grams) 2/3 had inaccurate estimation of portion sizes Poor estimation linked with literacy and numeracy 500 calories 1,025 calories 333 calories 590 calories 85 Calories 250 Calories Huizinga et al, Am J of Prev Med, 2009
 2/3 had inaccurate estimation of portion sizes. Poor estimation linked with literacy and numeracy. 500 calories. 1,025 calories. 333 calories. 590 calories. 85 Calories. 250 Calories. Huizinga et al, Am J of Prev Med,")
24
Numeracy and Diabetes

25
Diabetes and Numeracy Study
Design: Cross sectional survey Setting: Endocrine and Primary Care Clinics Instruments: Demographics A1C and Meter Downloads Assessed literacy with REALM Assessed math skills with WRAT3 Diabetes Knowledge (DKT), Self Care (SSCA) Assess diabetes numeracy with DNT Cavanaugh et al, Annals of Internal Medicine, 2009
, Self Care (SSCA) Assess diabetes numeracy with DNT. Cavanaugh et al, Annals of Internal Medicine,")
26
Demographics Variable (n=398) Number (%) or Mean (SD) Age, yrs (SD)
54.2 (12.9) Female, No. (%) 202 (51) Race, No. (%) White Black Other 249 (63) 134 (34) 14 ( 3) Education, No. (%) ≤ High School or GED Some college College or more 168 (43) 115 (29) 109 (28) Literacy Status (REALM), No (%) ≤ -8th grade ≥ High School 124 (31) 273 (69) Numeracy Skills (WRAT), No (%) ≤ 8th grade 276 (69) 122 (31) Type 2 Diabetes (%) 341 (86) On Insulin (%) 241 (61) A1C (SD) 7.6 (1.7)
 Female, No. (%) 202 (51) Race, No. (%) White. Black. Other. 249 (63) 134 (34) 14 ( 3) Education, No. (%) ≤ High School or GED. Some college. College or more. 168 (43) 115 (29) 109 (28) Literacy Status (REALM), No (%) ≤ -8th grade. ≥ High School. 124 (31) 273 (69) Numeracy Skills (WRAT), No (%) ≤ 8th grade. 276 (69) 122 (31) Type 2 Diabetes (%) 341 (86) On Insulin (%) 241 (61) A1C (SD) 7.6 (1.7)")
27
Overall DNT Results Mean score 61% (SD 25%) Range 5%-100%
Internal Reliability: 0.95 Trouble Spots Interpreting serving sizes Fractions or decimals Applying multi-step regimens (ex. sliding scale and carb-ratios) Applying titration instructions
 Applying titration instructions.")
28
Serving Size If you ate the entire bag of chips, how many total grams of carbohydrate would you eat? Correct Response: 63 gms Correct: 44%

29
Monitoring Your target blood sugar is between 60 and 120. Please circle the values below that are in the target range (circle all that apply): 55 145 118 Correct Response: Circle 118 only Percent Correct: 74% Here are a few sample questions: In this question, we told patients: Your target blood sugar is between 60 and 120. Please circle the values below that are in the target range (circle all that apply): So – patients should only cirlcle 118. However, only 74% of patients answered this correclt.y So 25% of patients could not perofmr a skill that we consider fundamental to daily diabetes care- to understand their glucose meter.
: So – patients should only cirlcle 118. However, only 74% of patients answered this correclt.y So 25% of patients could not perofmr a skill that we consider fundamental to daily diabetes care- to understand their glucose meter.")
30
Insulin Correction Scale (I)
You are told to follow the sliding scale shown here. The sliding scale indicates the amount of insulin you take based upon your blood sugar levels: How you frame something to a patient can make a big difference. So for example, if you show patients a table and ask them to calculate how much insuliun to take for a certain BG – most patients can do this just fine, Percent Correct: 85%

31
Insulin Correction Scale (II)
After seeing the Doctor, you are given the following instruction to lower a high blood sugar level before a meal: “ Starting with a blood sugar of 120, take 1 unit of Humalog insulin for each 50 points of blood sugar.” How much insulin should you take for a blood sugar of 375? 43. ANSWER _________ units Percent Correct: 37% (accept 5-6units) If on the other hand, you were to give people instructions- such as these: Starting with a blood sugar of 120, take 1 unit of Humalog insulin for each 50 points of blood sugar.” This is a much more challenging thing for a patient to do – and patients really struggled with this. But these instructions were actually being used in some of our clinics before we did this study.
 If on the other hand, you were to give people instructions- such as these: Starting with a blood sugar of 120, take 1 unit of Humalog insulin for each 50 points of blood sugar. This is a much more challenging thing for a patient to do – and patients really struggled with this. But these instructions were actually being used in some of our clinics before we did this study.")
32
DNT and other measures Higher DNT scores are sig. correlated with higher: education (r=0.51) literacy (r=0.50) math skills (r=0.64) diabetes knowledge (r=0.78) Frequency of glucose monitoring (r=0.21) and lower: A1C (r= -0.08, p =0.11) In multivariate analysis, each 10 point increase in DNT score was correlated with a 0.1 point decrease in A1C (p<0.05).
 diabetes knowledge (r=0.78) Frequency of glucose monitoring (r=0.21) and lower: A1C (r= -0.08, p =0.11) In multivariate analysis, each 10 point increase in DNT score was correlated with a 0.1 point decrease in A1C (p<0.05).")
33
Conclusions Performance on DNT was fair/poor
Disconnect between what is taught and what patients can do. Performance on DNT was correlated with literacy and math skills. Performance on DNT was also correlated with A1C, when adjusted for other covariates.

34
Communicating: What can you do?
Use low literacy and picture based materials Individualize education Teach concepts in a simplified manner Use teach back technique Address cultural issues Shared goal setting

35
Sample Low Literacy Materials

36
Teaching Concepts Limit advice to key concepts. Focus on behaviors and actions Focus on one concept at a time; partition information Use concrete terms and examples Make info culturally relevant and personal Avoid Jargon! Practice patient centered communication and shared goal setting

37
Teachback technique Clinician Explains New Concept Patient Recalls and Comprehends Clinician Clarifies and Tailors Explanation Clinician Reassesses Patient Recall and Comprehension Clinician Assesses Patient recall and Comprehension New Concept: Health Information, Advice, or Change in Management Adherence Schillinger, Arch Int Med, 2003

38
Cultural Challenges Language Family Structure Health Beliefs
Use Language Appropriate Handouts Use a translator! Family Structure Multiple caregivers Health Beliefs Dissonance from the “biomedical model” Campinha-Bacote, 2003 38

39
Shared Goal Setting Let patient or family initiate
Practice “reflective” listening” Provide affirmation of positive behaviors Show empathy for challenges Choose goal that is realistic and attainable Can offer a few choices and settle on goals together Roll with resistance (don’t challenge patients who resist change; instead ask them to come up with solutions) Assess their confidence in achieving the goal Be concrete Set a time for accomplishing goal Let them know it is up to them to make change! Promote a “you can do it” approach!
 Assess their confidence in achieving the goal. Be concrete. Set a time for accomplishing goal. Let them know it is up to them to make change! Promote a you can do it approach!")
40
Literacy Interventions
Our group has also been on the forefront of performing randomized trials to evaluate the role of addressing literacy and health communication to improve patient outcomes.

41
Initial Diabetes Intervention
6 Month Follow-Up 1 Year Follow-Up Baseline 105 Control 99 Control 95 Control 217 Patients with T2DM Initial Pharmacist Session R 112 Interv. 105 Interv. 98 Interv. THE RESULTS… From February 2001 to April 2002, 217 patients were randomized. Of these 105 patients were controls and 112 patients received the intensive intervention. At 6 months, we have complete f/u data for almost 95% of eligible patients, and at 12 months we have complete follow up for close to 90%

42
Intervention Diabetes Education Evidence-based medication algorithms
Database to track and manage patient outcomes Diabetes Care Coordinator Addressed literacy by using: Individualized verbal education Low literacy material Teaching concepts in a simplified manner “Teach back” techniques to confirm learning In the intervention group, Clinical pharmacists, who were also certified diabetes educators, provided diabetes education, applied Evidence based medication Algorithms and used a Data base to track and manage patient outcomes. In addition, the pharmacists addressed literacy by using: individualized verbal education, using low literacy materials, teaching concepts in a simplified manner, and having patients “teach back” information to confirm learning.

43
Significant Clinical Improvements at 12 months
Variable Control (n=95) Intervention (n=98) Difference A1C (%) -1.2% -2.1% 0.9% (0.8,1.0) SBP (mmHg) +2.3 -6.9 9.2 (2.3,16.1) DBP (mmHg) +1.2 -3.6 4.8 (1.1,8.6) ASA (mmHg) +6% +47% 41% (25-55) T. Chol. (mg/dL) -12 -27 15 (-4, 35) At 12 months follow up we saw significant clinical improvements between the Control and Intervention Groups. As seen in this table, We saw close to a 1% improvement in A1C, over 9 points improvement in SBP,almost 5 points in DBP, and over 40% points increase in aspirin use. We saw a modest reduction in cholesterol, and this did not reach statistical significance. {delete control and intervention columns?} Rothman AM J Med, 2005
 Intervention. (n=98) Difference. A1C (%) -1.2% -2.1% 0.9% (0.8,1.0) SBP (mmHg) (2.3,16.1) DBP (mmHg) (1.1,8.6) ASA (mmHg) +6% +47% 41% (25-55) T. Chol. (mg/dL) (-4, 35) At 12 months follow up we saw significant clinical improvements between the Control and Intervention Groups. As seen in this table, We saw close to a 1% improvement in A1C, over 9 points improvement in SBP,almost 5 points in DBP, and over 40% points increase in aspirin use. We saw a modest reduction in cholesterol, and this did not reach statistical significance. {delete control and intervention columns } Rothman AM J Med,")
44
Literacy was an Important Factor
We were the first to demonstrate the importance of addressing literacy in a randomized Trial. In this study we examined the role of literacy as part of a comprehenive intervention for patients with type 2 diabetes. For the study we randomized patients to get usual care, or to get a comprehensive intervention that included addressing the problem of low literacy by proviidng low literacy oriented education materials, indiviudalized educaiton, and using communication skills that are helpful for patients with poor litearcy skills. we found that patients who received our comprehensive intervention (shown in red) had signficant improvement in their blood sugar compared to the control patients. However, when we stratified by patient literacy status, we found that patients with higher literacy only did slightly better, but patient with low literacy actually did a lot better. So this study suggested that addressing literacy could really improve care for patients with lower literacy. However, because this was a very comprehensive intervention – where we were doing many different things to the patients we were unable to ascertain how much of the improvement was specifically related to our literacy oriented interventions. So, after this study we embarked on several additional studies to better examine the role of literacy, and particularly numeracy in our patients ability to care for their diabetes…. High Literacy Patients Low Literacy Patients
 had signficant improvement in their blood sugar compared to the control patients. However, when we stratified by patient literacy status, we found that patients with higher literacy only did slightly better, but patient with low literacy actually did a lot better. So this study suggested that addressing literacy could really improve care for patients with lower literacy. However, because this was a very comprehensive intervention – where we were doing many different things to the patients we were unable to ascertain how much of the improvement was specifically related to our literacy oriented interventions. So, after this study we embarked on several additional studies to better examine the role of literacy, and particularly numeracy in our patients ability to care for their diabetes…. High Literacy Patients. Low Literacy Patients.")
45
Diabetes and Numeracy RCT
We developed a new educational toolkit that addressed literacy and numeracy issues.

46
DLNET Toolkit Simplified medication instructions
Text at 5th grade reading level Color coding Pictures for key concepts Step-by-step instructions Simplified medication instructions Practice skills worksheets The toolkit included many approaches known to improve patient understanding for both patients with normal and low literacy or numeracy skills. We then perform performed 2 randomized trials where we trained health care providers in improved health communication skills and gave them our toolkit to help manage patients with diabetes. 46 Wolff K et al. The Diab Educ 2009 46

47
Study Demonstrates Value of Addressing Health Literacy
*P = 0.03 This study, pubished in Diabetes Care, showed that while the study was active in the first 3 months we were able to significantly improve glycemic control at the 2 intervention groups compared to control groups that recevied comprehensive diabetes disease management. We have since shared our Toolkit with providers all over the country and even the world. *Adjusting for age, gender, race, type of diabetes, income level, site of intervention and baseline DNT score and Hba1c levels 47 Cavanaugh KL et al. Diabetes Care 2009 47

48
Diabetes Nutrition Education Study (DINES)
We followed this up with another study where we specifically examined the role of Certified Diabetes Education, and of different approaches to Nutrition Education. Patients were randomized to a control group receiving standard education vs a group that received CDE with a focus on a simplified plate method for nutrition education, or a group that received CDE with a focus on the more numeracy intensive carb counting approach to nutrition.

49
Carb Counting vs Plate Method
49

50
Results Demonstrate Value of Simpler Diabetes Education
At the end of the study, we demonstrated that patients with both low and high numeracy skills who got CDE had more improvement in A1C than those in the Control Condition. And among those in the plate method group, both low and high numeracy patients did better. But in the Carb counting group only the high numeracy patients did significantly better. So this study demonstrated that it might be beneficial to provide a simpler approach to most patients, or at least to avoid carb counting with those who have lower numeracy skills.

51
New Standards for Diabetes Education
Diabetes Care, 2012, in press

52
PRIDE Study PaRtnering to Improve Diabetes Education
Goal to address health communication issues to improve diabetes care in middle TN Collaboration between TN Dept. of Health, Vanderbilt, and Meharry 5 year NIDDK R18 study Cluster RCT with 10 Clinics and 400 diabetes patients Develop a sustainable model for improved diabetes care Currently we are further studying the role of addressing literacy and numeracy and other health communication issues in a 5 year cluster randomized trial here in middle TN. This study is a partnership with the TN Dept of Health and we are working in 10 State health department clinics in Middle TN. We have trained over 150 health care providers including MD, NP, RN, RD as part of this study…

53
Pride Materials And we have developed a robust array of toolkit materials in English and Spanish for providers to use with their diabetes patients to help manage diabetes and set realistic goals.

54
HIT approaches for Diabetes
Web-based and mobile phone intervention to promote problem solving skills and self-care in adolescents with diabetes Use of electronic patient portal to address medication adherence Our group has also been engaged with several informatics based interventions – particularly with the use of web-based, mobile-based, and text messaging intervetntions for our adolescents with diabetes, and the use of our electronic patient portal.

55
Childhood Obesity 1 in 4 preschoolers in the US are overweight/obese
Overweight in infancy associated with increased risk for overweight in adulthood Weight gain in first few months of life associated with increased CV risks in adulthood “Obesogenic” behaviors start early in infancy and are very common!

56
Pediatric Obesity Prevention
Over 26% of all preschoolers are overweight or obese Study involves Vanderbilt, UNC, NYU, UMiami and 865 English and Spanish speaking families addressing health literacy and numeracy to prevent early childhood obesity Trained pediatric residents in health communication skills Provide toolkit of materials to use with families (Greenlight) We are also leading a national study that is addressing literacy and health communication in early childhood obesity prevention. We have enrolled 870 English and Spanish speaking families starting at 2 months of age, and are trying to prevent Obesity Devlopment by age 2, because nationaly over 20% of pre-schoolers are overweight, and in our pediatric resident clinics about 50% of our 2 year olds are overweight. For this study we have trained over 200 pediatric residents in improved communication skills.
 We are also leading a national study that is addressing literacy and health communication in early childhood obesity prevention. We have enrolled 870 English and Spanish speaking families starting at 2 months of age, and are trying to prevent Obesity Devlopment by age 2, because nationaly over 20% of pre-schoolers are overweight, and in our pediatric resident clinics about 50% of our 2 year olds are overweight. For this study we have trained over 200 pediatric residents in improved communication skills.")
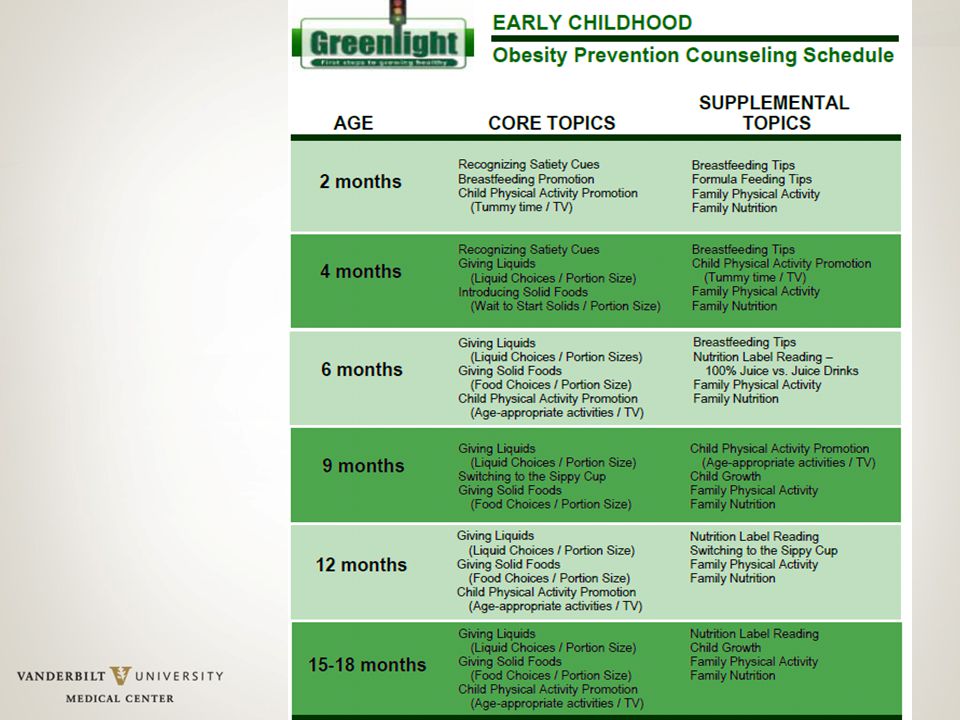
57
Greenlight Toolkit Materials
1-2 Booklets per Well Child Visit 1 CORE booklet focused on key behaviors 1-3 SUPPLEMENTAL booklets (Provider Chooses) Booklets are 2-6 pages and end with goal setting Designed to be used interactively during the visit Available in English and Spanish
 Booklets are 2-6 pages and end with goal setting. Designed to be used interactively during the visit. Available in English and Spanish.")
59
Baseline Demographics
Child Characteristics Mean (SD) or n (%) Child Age, weeks 9.3 (1.8) Child Gender, Male 429 (49) Child weight at 2 months (kg) 5.36 (0.78) Parent Characteristics Parent Age, years 27.7 (6.1) Relationship to Child, Mother 839 (95. 6) Parent Non-US Born 428 (49.0) Parent Race/Ethnicity Hispanic White, non-Hispanic Black, non-Hispanic Other, non-Hispanic 436 (50) 154 (18.0) 239 (27.0) 46 (5.0) Parent Language, Spanish 303 (35.0) Parent Education, Less than HS Graduate 227 (26.1) Income (annual) <$10,000 $10,000-$19,999 $20,000-$39,999 >$40,000 268 (31) 229 (27.0) 204 (24.0) 137 (15.9) WIC 729 (85%) Medicaid 740 (85%) # of Adults in home, >1 782 (90.0) # of Children in home, >1 524 (60.2)
 or n (%) Child Age, weeks. 9.3 (1.8) Child Gender, Male. 429 (49) Child weight at 2 months (kg) 5.36 (0.78) Parent Characteristics. Parent Age, years (6.1) Relationship to Child, Mother. 839 (95. 6) Parent Non-US Born. 428 (49.0) Parent Race/Ethnicity. Hispanic. White, non-Hispanic. Black, non-Hispanic. Other, non-Hispanic. 436 (50) 154 (18.0) 239 (27.0) 46 (5.0) Parent Language, Spanish. 303 (35.0) Parent Education, Less than HS Graduate. 227 (26.1) Income (annual) <$10,000. $10,000-$19,999. $20,000-$39,999. >$40, (31) 229 (27.0) 204 (24.0) 137 (15.9) WIC. 729 (85%) Medicaid. 740 (85%) # of Adults in home, > (90.0) # of Children in home, > (60.2)")
60
Obesogenic Behaviors are Common
Behaviors at 2 month visit Total (n=863) Type of Feeding Formula only Mostly formula, and some breast milk Equal formula and breastmilk Mostly breast milk, and some formula Breast milk only 385 (44.6) 127 (14.7) 11 (1.3) 175 (20.3) 165 (19.1) Sweet drinks 26 (3.0) Early introduction of solids 98 (11.6)
 Type of Feeding. Formula only. Mostly formula, and some breast milk. Equal formula and breastmilk. Mostly breast milk, and some formula. Breast milk only. 385 (44.6) 127 (14.7) 11 (1.3) 175 (20.3) 165 (19.1) Sweet drinks. 26 (3.0) Early introduction of solids. 98 (11.6)")
61
Behaviors at 2 months Infant feeding style and practices
In last 2 weeks, how often put to sleep while drinking a bottle At most sleep times Sometimes, at least once a day Sometimes, but not every day Never 108 (12.5) 119 (13.8) 143 (16.6) 491 (57.0) I try to get my child to finish her breast milk or formula Always Most of the time Half of the time Seldom or infrequently 324 (37.6) 149 (17.3) 75 (8.7) 103 (11.9) 211 (24.5) When my baby cries, I immediately feed him/her 175 (20.3) 184 (21.4) 176 (20.4) 207 (24.0) When my child has a bottle, I prop it up 31 (3.7) 24 (2.9) 37 (4.4) 102 (12.2) 643 (76.8)
 119 (13.8) 143 (16.6) 491 (57.0) I try to get my child to finish her breast milk or formula. Always. Most of the time. Half of the time. Seldom or infrequently. 324 (37.6) 149 (17.3) 75 (8.7) 103 (11.9) 211 (24.5) When my baby cries, I immediately feed him/her. 175 (20.3) 184 (21.4) 176 (20.4) 207 (24.0) When my child has a bottle, I prop it up. 31 (3.7) 24 (2.9) 37 (4.4) 102 (12.2) 643 (76.8)")
62
Behaviors at 2 months Physical Activity-related Practices
Tummy time, minutes, d (Median, Inter-quartile range) 12.5 [ ] Tummy time 30 minutes or more <30 minutes 288 (33.5) 571 (66.5) Television Exposure, minutes [interquartile range] 346 [60-480] Television watching, minutes [interquartile range] 25 [ ] Television watching Any None 429 (49.8) 432 (50.2) I watch TV while feeding my baby Always Most of the time Half of the time Seldom or infrequently Never 72 (8.4) 101 (11.7) 223 (25.9) 252 (29.2) 214 (24.8)
 12.5 [ ] Tummy time. 30 minutes or more. <30 minutes. 288 (33.5) 571 (66.5) Television Exposure, minutes [interquartile range] 346 [60-480] Television watching, minutes [interquartile range] 25 [ ] Television watching. Any. None. 429 (49.8) 432 (50.2) I watch TV while feeding my baby. Always. Most of the time. Half of the time. Seldom or infrequently. Never. 72 (8.4) 101 (11.7) 223 (25.9) 252 (29.2) 214 (24.8)")
63
Racial/Ethnic Differences
Hispanic Black, non-Hispanic Other, non-Hispanic Outcome, N Overall p-value for Race/Ethnicity AOR, [95% CI] p-value More formula than BM, 820 0.029 0.70 [0.43, 1.17] 0.174 1.31 [0.82, 2.10] 0.261 0.65 [0.33, 1.26] 0.199 Bottle to bed, 819 0.003 1.05 [0.61, 1.78] 0.867 1.97 [1.25, 3.12] 0.004 2.26 [1.12, 4.57] 0.023 Finish BM/formula, 820 0.012 1.93 [1.20, 3.11] 0.007 1.62 [1.09, 2.41] 0.018 0.88 [0.46, 1.68] 0.698 Immediately feed, 819 1.24 [0.78, 1.96] 0.362 1.05 [0.70, 1.57] 0.821 3.08 [1.65, 5.74] <0.001 Bottle propping, 797 0.002 2.47 [1.25, 4.88] 0.009 3.05 [1.71, 5.43] 2.26 [0.92, 5.58] 0.076 TV while feeding, 820 0.014 1.04 [0.66, 1.63] 0.872 1.29 [0.87, 1.92] 0.213 0.46 [0.24, 0.86] 0.015 Active TV Watching, 819 0.006 0.88 [ ] 0.595 1.58 [ ] 0.034 0.57 [0.28, 1.19] 0.133 Tummy Time, 817 0.083 0.62 [0.40, 0.97] 0.037 0.86 [0.58, 1.28] 0.447 0.53 [0.28, 1.003] 0.051 Perrin et al, Pediatrics, 2014

64
Literacy and Behaviors
AOR* (Low Lit vs Adeq. Literacy) 95% CI p-value Feeding Practices: Diet content-related Type of feeding: More formula than BM 805 2.0 0.01 Feeding Practices: Feeding style-related Gets child to finish BM or formula 1.3 0.3 Immediately feeds when baby cries 804 1.8 Props the bottle 782 0.049 Watches TV while feeding baby 0.8 0.5 Does not let child decide how much to eat 1.1 Physical activity-related behaviors Television watching Television watching: Any 0.03 Tummy time: None 802 2.2 0.008 *Controlling for child gender, child out of home care, WIC status; parent age, race/ethnicity, language; number of adults in the home, number of children in the home, income; recruitment site Yin et al, J Pediatrics, 2014
 95% CI. p-value. Feeding Practices: Diet content-related. Type of feeding: More formula than BM Feeding Practices: Feeding style-related. Gets child to finish BM or formula Immediately feeds when baby cries Props the bottle Watches TV while feeding baby Does not let child decide how much to eat Physical activity-related behaviors. Television watching. Television watching: Any Tummy time: None *Controlling for child gender, child out of home care, WIC status; parent age, race/ethnicity, language; number of adults in the home, number of children in the home, income; recruitment site. Yin et al, J Pediatrics,")
65
Conclusions Low literacy and numeracy common
Even patients with good literacy and numeracy can struggle to navigate our complex system and perform self-care! Patients with lower literacy/numeracy have worse knowledge, behavior, and outcomes Interventions that use low literacy materials and improved communication skills can improve outcomes!

66
Acknowledgements UNC Vanderbilt/ Meharry Eliana Perrin MD MPH
Joanne Propst-Finkle JD Alice Ammerman PhD RD Michael Pignone MD MPH Darren DeWalt MD MPH Morris Weinberger PhD John Buse MD PhD CDE Robb Malone PharmD CDE Betsy Bryant PharmD CDE Victoria Hawke RD Britton Crigler BS, James Joyner BA Miami/Stanford Lee Sanders MD MPH Vivian Franco MPH Lee Sanders, MD, MPH Anna Maria Patino Fernandez, PhD Daniela Quesada, MPH Sheah Rarback, RD Sarah Messiah, PhD Lourdes Forster, MD Vanderbilt/ Meharry Tom Elasy MD MPH, Robert Dittus MD MPH Kerri Cavanaugh MD MPH, Mimi Huizinga MD MPH Dianne Davis RD CDE, Becky Gregory RD CDE Ken Wallston PhD. Phil Ciampa MD Ayumi Shintani PhD, Tebeb Gebretsadik MPH Disha Kumar BS, Jessica Sparks BA, Ryan Housam BA, Hilary Weiss BS, Kirbee Bearden Shari Barkin MD MHs Kathleen Wolf MSN, FNP-BC, ADM-BC Sunil Kripalani MD Heidi Silver RD PhD Richard White MD (Meharry) NYU Shonna Yin MD MSc Linda van Schaick PhD MaryJo Messito MD Elaine Galland RD Benard Dreyer, MD Alan Mendelsohn, MD Previous Funding Support: RWJ Clinic Scholars Program, UNC Department of Medicine, Vanderbilt Diabetes Center, Vanderbilt DRTC, Vanderbilt Center for Health Services Research, Pfizer Clear Health Communication Initiative, ADA (Novo Nordisk), K23/R03, AADE Current Funding Support: NIDDK (R18), NICHD (R01), NCATS (VICTR), NIDDK (P30), PCORI
 NYU. Shonna Yin MD MSc. Linda van Schaick PhD. MaryJo Messito MD. Elaine Galland RD. Benard Dreyer, MD. Alan Mendelsohn, MD. Previous Funding Support: RWJ Clinic Scholars Program, UNC Department of Medicine, Vanderbilt Diabetes Center, Vanderbilt DRTC, Vanderbilt Center for Health Services Research, Pfizer Clear Health Communication Initiative, ADA (Novo Nordisk), K23/R03, AADE. Current Funding Support: NIDDK (R18), NICHD (R01), NCATS (VICTR), NIDDK (P30), PCORI.")
67
Questions

Similar presentations