Download presentation
Presentation is loading. Please wait.

1
Review For Quiz on Pie Charts
Constructing Pie Charts Deconstructing Pie Charts Select Vocabulary from Surveys & Variables

2
Deconstructing Pie Charts
4/14/2017 What is a Pie Chart? A pie chart or __________________________ ______________________________________ What is another name for a Pie Chart? _____________________________________ Categorical or Qualitative Quantitative or Numerical 7 Deconstructing Pie Charts

3
Deconstructing Pie Charts
4/14/2017 What is a Pie Chart? A pie chart or circle graph has sectors that visually display proportional parts of a total set of data that share a common variable Another name: Circle Graph Categorical or Qualitative Quantitative or Numerical 7 Deconstructing Pie Charts

4
4 Pie Chart Characteristics
Deconstructing Pie Charts 4/14/2017 4 Pie Chart Characteristics Help________________________________ ___________________________________. Help _________________________________ ____________________________________. Especially useful _____________________. Most effective when ____________________ ____________________________________. Categorical or Qualitative Quantitative or Numerical 7 Deconstructing Pie Charts

5
4 Pie Chart Characteristics
Deconstructing Pie Charts 4/14/2017 4 Pie Chart Characteristics Help an audience understand distribution of data quickly and easily. Help to see how a total is divided into categories Especially useful with categorical data Most effective when the number of segments is 10 or fewer Categorical or Qualitative Quantitative or Numerical 7 Deconstructing Pie Charts

6
Reviewing Variable Types
Deconstructing Pie Charts 4/14/2017 Reviewing Variable Types __________ (or __________) Categorical or Qualitative Quantitative or Numerical 7 Deconstructing Pie Charts
 Categorical or Qualitative. Quantitative or Numerical. 7 Deconstructing Pie Charts.")
7
Variable Vocabulary: Variables Come in 2 Varieties
Deconstructing Pie Charts 4/14/2017 Variable Vocabulary: Variables Come in 2 Varieties Categorical (or Qualitative) Quantitative (or Numerical) Categorical or Qualitative Quantitative or Numerical 7 Deconstructing Pie Charts
 Quantitative (or Numerical) Categorical or Qualitative. Quantitative or Numerical. 7 Deconstructing Pie Charts.")
8
Types of Quantitative Variables

9
Types of Quantitative Variables

10
Reviewing _________ Variables. 6 Characteristics
Deconstructing Pie Charts 4/14/2017 Reviewing _________ Variables. 6 Characteristics Recorded usually _________________ Records which of several ___________ _____________ belongs to Count data in each ________, but ______________ should not ________ it Can calculate ____________________ Includes all _____________________ Graphing:______________________ 7 Deconstructing Pie Charts

11
Categorical Variables
Deconstructing Pie Charts 4/14/2017 Categorical Variables Recorded usually with words Records which of several groups an individual belongs to Count data in each group, but you logically should not average it Can calculate %age distributions Includes all yes/no questions Graphing: best illustrated with a pie chart 7 Deconstructing Pie Charts

12
2 Types of Quantitative Variables
Deconstructing Pie Charts 4/14/2017 2 Types of Quantitative Variables __________ If the Q variable is a set of isolated points on the number line, we call it this (i.e., it’s a number but it only comes in certain values). Can be counted __________ If the Q variable forms an entire interval along the number line, we call it this (i.e., it’s a number & it can be any value). Can be measured Discrete Continuous 7 Deconstructing Pie Charts
. Can be counted. __________ If the Q variable forms an entire interval along the number line, we call it this. (i.e., it’s a number & it can be any value). Can be measured. Discrete. Continuous. 7 Deconstructing Pie Charts.")
13
2 Types of Quantitative Variables
Deconstructing Pie Charts 4/14/2017 2 Types of Quantitative Variables Discrete If the Q variable is a set Quantitative of isolated points on the number line, we call it this (i.e., it’s a number but it only comes in certain values). Can be counted Continuous If the Q variable forms an entire Quantitative interval along the number line, we Variable call it this (i.e., it’s a number & it can be any value). Can be measured Variable Discrete Continuous 7 Deconstructing Pie Charts
. Can be counted. Continuous If the Q variable forms an entire Quantitative interval along the number line, we Variable call it this. (i.e., it’s a number & it can be any value). Can be measured. Variable. Discrete. Continuous. 7 Deconstructing Pie Charts.")
14
Vocabulary from Surveys
Define a Population in a statistical sense: _______________________________ Define Data in a statistical sense: ________________________________

15
Vocabulary from Surveys
1. Define a Population in a statistical sense: A population is an entire collection of individuals or objects about which information is desired. 2. Define Data in a statistical sense Data are numbers collected in a particular context. During a survey, the interviewer collects it. It always has units.

16
Vocabulary from Surveys
What is good data? _______________________________ What is bad data? ________________________________

17
Vocabulary from Surveys
1. Good Data in a statistical sense Good Data is the result of intelligent effort and good random sampling methods. 2. Bad Data in a statistical sense Bad Data are the result of laziness, lack of understanding, the desire to mislead others or bad sampling methods.

18
Deconstructing Pie Charts
4/14/2017 End Review for Quiz 7 Deconstructing Pie Charts

19
Deconstructing Pie Charts
4/14/2017 Classwork & Homework Use the terms you’ve learned to deconstruct pie charts Answer some the ‘usual’ questions about the nature of the survey using the data and your powers of analysis. 7 Deconstructing Pie Charts

21
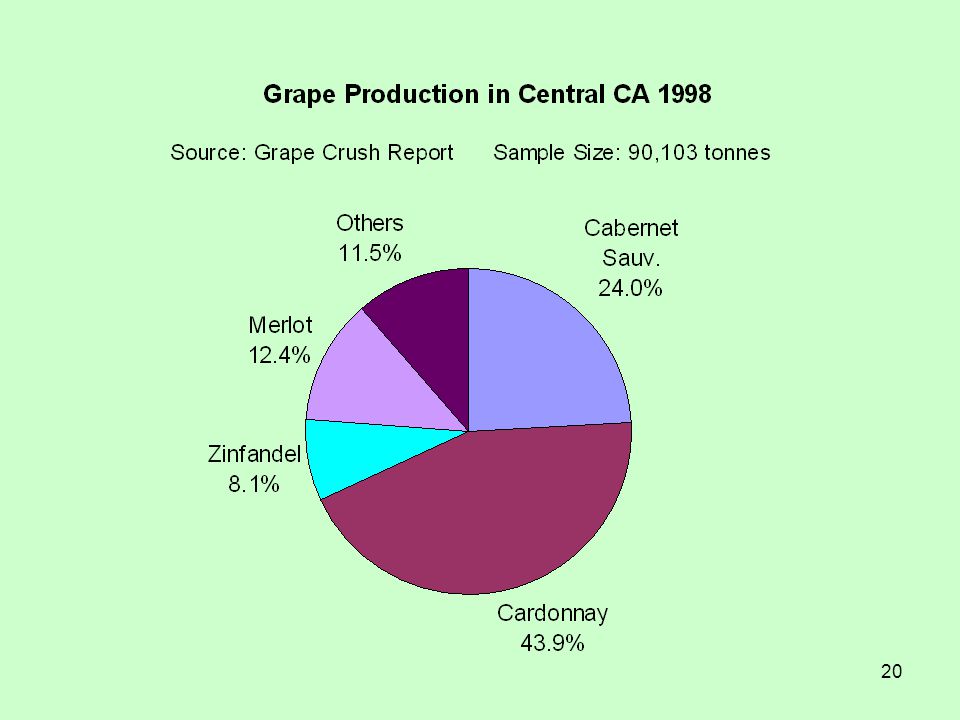
Grape Crush Survey

22
Grape Crush Survey

24
Deconstruction of Pie College Profs Time

25
Deconstruction of Pie College Profs Time

26
Answering ?s About Profs
What is question to answer? What is the population? Describe the sample: numbers, units other description Variables? Q or C? Units or 2 categories Conclusions?

27
Answering ?s About Profs
What is question to answer? In teaching What is the population? Typical college professors Describe the sample: numbers, units other description ‘an average’ college professor Variables? Q or C? Time; Categorical Units or 2 categories Teaching, consulting, research, growth, comm serv, etc Conclusions? Most time is spent in teaching

28
Broadband Market Share

29
Broadband Companies

30
Broadband Companies

31
Quiz #102 Test Taking Strategies
What you need: Graphing Calculator Protractor Compass Pencil Eraser HW to the HW Box How you take test: Answer Vocabulary Then do #2 Deconstruction Then do #1 Construction of graph WATCH THE TIME— This test is longer

Similar presentations


 Variable: Any characteristic.>")


. Day….. 1.Circle GraphsCircle Graphs 2.SurveysSurveys 3.Bias and Unbiased SurveysBias and Unbiased Surveys 4.Population.>")


