Download presentation
Presentation is loading. Please wait.

1
Director of Application Support Services
Raman Spectroscopy for Rapid Material Identification in the Pharmaceutical Industry April 12, 2013 Katherine Bakeev, PhD Director of Application Support Services B&W Tek Newark, DE USA

2
What is the need? Pharmaceutical companies must meet worldwide PIC/S initiatives, local Pharmacopeia and the US Food and Drug Administration’s regulations on Good Manufacturing Practice (GMP) There has been a trend of increasing product contamination incidents, product recalls and facility shutdowns Companies must develop and implement improved analytics to check the identity, integrity and quality of ingredients and products Implementation of 100% testing of raw materials is coming! to the US (and has been adopted in Europe) PIC/S Pharmaceutical Inspection Cooperation Scheme
 There has been a trend of increasing product contamination incidents, product recalls and facility shutdowns. Companies must develop and implement improved analytics to check the identity, integrity and quality of ingredients and products. Implementation of 100% testing of raw materials is coming! to the US (and has been adopted in Europe) PIC/S Pharmaceutical Inspection Cooperation Scheme.")
3
2012: Japan and Korea applied for membership
Taiwan PIC/S is the abbreviation and logo used to describe both the Pharmaceutical Inspection Convention (PIC) and the Pharmaceutical Inspection Co-operation Scheme (PIC Scheme) operating together in parallel. The PIC Scheme commenced operating on 2 November 1995 in conjunction with PIC which had already been operating since 1970 (see "Background on PIC"). Thus PIC/S became operational in November 1995. The need to form the PIC Scheme became necessary when it was realised that an incompatibility between PIC and European law did not permit individual EU countries that were members of PIC to sign agreements with other countries seeking to join PIC. Only the European Commission was permitted to sign agreements with countries outside Europe, and the Commission itself was not a member of PIC. Therefore, a less formal and more flexible cooperation scheme was developed to continue and enhance the work of PIC. Instead of being a legal treaty between countries (ie. like PIC), the PIC Scheme is a cooperative arrangement between Health authorities. PIC and the PIC Scheme, operating together as PIC/S, provide an active and constructive co-operation in the field of GMP (Good Manufacturing Practice). The purpose of PIC/S is to facilitate the networking between participating authorities and the maintenance of mutual confidence, the exchange of information and experience in the field of GMP and related areas, and the mutual training of GMP inspectors. New Zealand 2012: Japan and Korea applied for membership
 and the Pharmaceutical Inspection Co-operation Scheme (PIC Scheme) operating together in parallel. The PIC Scheme commenced operating on 2 November 1995 in conjunction with PIC which had already been operating since 1970 (see Background on PIC ). Thus PIC/S became operational in November The need to form the PIC Scheme became necessary when it was realised that an incompatibility between PIC and European law did not permit individual EU countries that were members of PIC to sign agreements with other countries seeking to join PIC. Only the European Commission was permitted to sign agreements with countries outside Europe, and the Commission itself was not a member of PIC. Therefore, a less formal and more flexible cooperation scheme was developed to continue and enhance the work of PIC. Instead of being a legal treaty between countries (ie. like PIC), the PIC Scheme is a cooperative arrangement between Health authorities. PIC and the PIC Scheme, operating together as PIC/S, provide an active and constructive co-operation in the field of GMP (Good Manufacturing Practice). The purpose of PIC/S is to facilitate the networking between participating authorities and the maintenance of mutual confidence, the exchange of information and experience in the field of GMP and related areas, and the mutual training of GMP inspectors. New Zealand. 2012: Japan and Korea applied for membership.")
4
Industry Trends and Requirements
Incremental Regulatory Control for Incoming Material Identification PIC/S recommendations on complete traceability of incoming materials GMP is expanding to new products Global Supply Chain Companies are moving toward a more delocalized supply chain Problems associated with supplier quality assurance and transportation Quality Assurance and Cost Reduction Increase analytical capabilities Reduce operational cost Optimize operational efficiencies

5
100% Raw Material Inspection
Why do we need to perform 100% container Identity Testing?

6
GMP for Raw Material Identification
EU GMP and PIC/S GMP Guide Chapter 5. Production 5.30 There should be appropriate procedures or measures to assure the identity of the contents of each container of starting material. Annex 8 -Sampling of starting and packaging materials 2. Starting Materials The identity of a complete batch of starting materials can normally only be ensured if individual samples are taken from all the containers and an identity test performed on each sample. This means: Europe requires 100% container testing

7
GMP for Raw Material Identification
US FDA 21 CFR requires testing of raw materials: 21 CFR (d)- “At least one test shall be conducted to verify the identity of each component of a drug product. Specific identity tests, if they exist, shall be used.” Raw materials are quarantined until identity verified Raw materials must meet predetermined specifications US FDA Compliance Program Guidance Manual Program (Drug Manufacturing Inspections-FDA CP ) Material systems: at least one specific identity test is conducted on each lot of each component Dietary Supplement GMPs US 21 CFR 111 21 CFR (a)(1)(i) Conduct at least one appropriate test or examination to verify the identity of any component that is a dietary ingredient
- At least one test shall be conducted to verify the identity of each component of a drug product. Specific identity tests, if they exist, shall be used. Raw materials are quarantined until identity verified. Raw materials must meet predetermined specifications. US FDA Compliance Program Guidance Manual Program (Drug Manufacturing Inspections-FDA CP ) Material systems: at least one specific identity test is conducted on each lot of each component. Dietary Supplement GMPs US 21 CFR CFR (a)(1)(i) Conduct at least one appropriate test or examination to verify the identity of any component that is a dietary ingredient.")
8
US FDA Warning Letter Review- Identity Tests
Xian Libang Pharmaceutical Co., Ltd., China. (Jan 28, 2010) 1. Failure of your quality unit to ensure that materials are appropriately tested and the results are reported. Your firm used the IR spectra for one lot to approve and release two subsequent incoming lots. This practice is unacceptable and raises serious concerns regarding the integrity and reliability of the laboratory analyses conducted by your firm. It is essential that at least one test be conducted to verify the identity of each lot of incoming material. In addition, the laboratory control records should include complete documentation of all raw data generated during each test, including graphs, charts and spectra from laboratory instrumentation. Requirement-development of methods/libraries with well-characterized materials
 1. Failure of your quality unit to ensure that materials are appropriately tested and the results are reported. Your firm used the IR spectra for one lot to approve and release two subsequent incoming lots. This practice is unacceptable and raises serious concerns regarding the integrity and reliability of the laboratory analyses conducted by your firm. It is essential that at least one test be conducted to verify the identity of each lot of incoming material. In addition, the laboratory control records should include complete documentation of all raw data generated during each test, including graphs, charts and spectra from laboratory instrumentation. Requirement-development of methods/libraries with well-characterized materials.")
9
Regulatory Expectations for Spectroscopic-based Methods
The Pharmaceutical Inspection Convention and Pharmaceutical Inspection Co-operation Scheme (jointly referred to as PIC/S) are two international instruments between countries and pharmaceutical inspection authorities, which provide together an active and constructive co-operation in the field of GMP.
 are two international instruments between countries and pharmaceutical inspection authorities, which provide together an active and constructive co-operation in the field of GMP.")
10
Issues and Customer Concerns
Can Raman help my project? What are the differences between Raman and NIR? Should I really perform 100% container ID test? What are my options? Do I need to validate the Raman method? If yes, what are the requirements for method validation? What is next after the Raman ID becomes a routine method? Do I need to know the filing expectations from regulatory agencies (JP/EMA/FDA..)? Can vendors provide GMP support & related documents?
 Can vendors provide GMP support & related documents")
11
Advantages of Raman Spectroscopy
These materials cannot be identified by Raman, FTIR or NIR

12
Raman can measure through packaging: broad class
Bottles Manufacturer Thickness Amber Glass VWR 3 mm Clear Glass (A) I-Chem 2 mm Clear Glass (B) High Density Polyethylene (HDPE) 1 mm Teflon FEP Nalgene Polystyrene Uline Vials Kimball Clear Glass Bags Polypropylene (PP) 2 mil Low-Density Polyethylene (LDPE)
 I-Chem. 2 mm. Clear Glass (B) High Density Polyethylene (HDPE) 1 mm. Teflon FEP. Nalgene. Polystyrene. Uline. Vials. Kimball. Clear Glass. Bags. Polypropylene (PP) 2 mil. Low-Density Polyethylene (LDPE)")
13
Raman Applications in Pharma
ID Identification of raw materials (building up an extensive library of Raman spectra); This is the application for NanoRam Quantitative analysis Quantitative determination of active substances in different formulations; Polymorphism Supporting polymorphic screenings (polymorphs have different solubility rates, thereby impacting the effective dosing); Process (PAT) Supporting chemical development process scale-up (as process steps are modified and refined to ascertain whether the desired chemical is being produced or not, and the rate at which it is formed).
; This is the application for NanoRam. Quantitative analysis. Quantitative determination of active substances in different formulations; Polymorphism. Supporting polymorphic screenings (polymorphs have different solubility rates, thereby impacting the effective dosing); Process (PAT) Supporting chemical development process scale-up (as process steps are modified and refined to ascertain whether the desired chemical is being produced or not, and the rate at which it is formed).")
14
Raman vs non Raman Feature FTIR Raman NIR Selectivity Interference
Very high; fundamental vibrations Very high; fundamental vibrations Low; broad, overlapping bands requiring chemometric models Interference Strong absorption of glass, plastics, water No issues with aqueous solutions; not sensitive to physical form of samples Influence from water; signal impacted by particle size, hardness, Sampling Sample prep may be needed; direct compressed sample contact for ATR No sample prep; measure through transparent or translucent containers; effective in the presence of solutions Can measure through glass, quartz; large sample area needed Method Development Can be by visual examination or library matching Sharp, distinctive spectral peaks can be used for accurate identification Analysis typically requires chemometrics; low selectivity Device Packaging Can be bulky and weigh > 2 kg; low battery life Handheld. Light weight (1 kg); > 4 hour battery life Bulky. Over 3 kg; low battery life 4/14/2017
; > 4 hour battery life Bulky. Over 3 kg; low battery life. 4/14/")
15
Benefits of Handheld Raman for ID Testing
Reduced material movement – directly implement in warehouse, loading dock, fewer accidents/reduced manpower Easy and simple operations- simple training & improves manpower usage Reduce chemical exposure – scan through packaging materials & maximize personnel safety Fewer lab delays reduce cycle time – on-time production & higher throughput Free up laboratory instruments – increases lab capacity Reduced transcription – fewer errors; lower personnel and equipment overhead; control costs

16
Method Development- Special Considerations for Raman Technique
Fluorescence interference/presence of impurities Baseline shifts and background signal Laser power Confirm that the sample is not being altered. Adjustable laser power from mW. Sample-position sensitivity Use of appropriate sampling accessory.

17
The Measurement Challenges- Measure Through Plastic Packaging
Implementation advantages of spectroscopic methods No cross-contamination (the material inside the bag) Safe and easy to implement Can be implemented in warehouse, docking area or lab But…challenges exist if using NIR technique Spectral profiles include packaging absorptions Packaging interferences may reduce the specificity of the method when identify similar materials The library requires assessment or change if the bag changes, i.e., not suitable for multiple suppliers of same materials Packaging could have multiple layers, with different colors or materials
 Safe and easy to implement. Can be implemented in warehouse, docking area or lab. But…challenges exist if using NIR technique. Spectral profiles include packaging absorptions. Packaging interferences may reduce the specificity of the method when identify similar materials. The library requires assessment or change if the bag changes, i.e., not suitable for multiple suppliers of same materials. Packaging could have multiple layers, with different colors or materials.")
18
NIR Spectra of API (Plastic bag contribution)
.4 .6 .8 1 1.2 1.4 1.6 1.8 8500 8000 7500 7000 6500 6000 5500 5000 4500 Wavenumber (cm-1) NIR Spectra of material –with plastic bag Two layer PE bag One layer PE bag Two Layers PE bag has higher NIR intensity as compared to One-Layer PE bag. No PE bag (pure sample) Required to evaluate the method specificity in the presence of bag!
 NIR Spectra of material –with plastic bag. Two layer PE bag. One layer PE bag. Two Layers PE bag has higher NIR intensity as compared to One-Layer PE bag. No PE bag (pure sample) Required to evaluate the method specificity in the presence of bag!")
19
Raman Spectra of API (Plastic bag effect)
200 400 600 800 1000 1200 1400 1600 1800 2000 2200 2400 900 2700 3600 4500 5400 6300 7200 8100 9000 9900 Raman shift [cm-1] Intensity No significant spectral absorption from PE bag Two layer bag One layer bag No bag

20
Raman has greater specificity than NIR
Same finished tablet measured by NIR and Raman- note sharp, distinct peaks in Raman 4/14/2017

21
Regulatory Standards Compliance
21 CFR Part 11 Electronic Records; Electronic Signatures 21 CFR Part Laser and Laser Systems US Pharmacopeia <1120> Raman Spectroscopy European Pharmacopeia Ch guidelines for Raman Spectroscopy ASTM (2007) Standard Guide for Raman Shift Standards for Wavelength Calibration
 Standard Guide for Raman Shift Standards for Wavelength Calibration.")
22
Validation Qualification
Process of providing documented evidence that something does what it is intended to do Process, system, method Qualification Inspection, testing and documentation review Is a part of the validation process which verifies module and system performance prior to being placed in routine use Equipment/instrument

23
Analytical Method Development
Prerequisites for analytical method validation-Six “M”s Man Machine Methods qualified calibrated characterized robust documented skilled qualified suitable Quality of the analytical method Qualified Material Vibrations Time Irradi- ation Analysts´ support Tempe- rature Quality Humidity Supplies Material Milieu Management

24
Analytical Instrument Qualification
USP <1058> Analytical Instrument Qualification

26
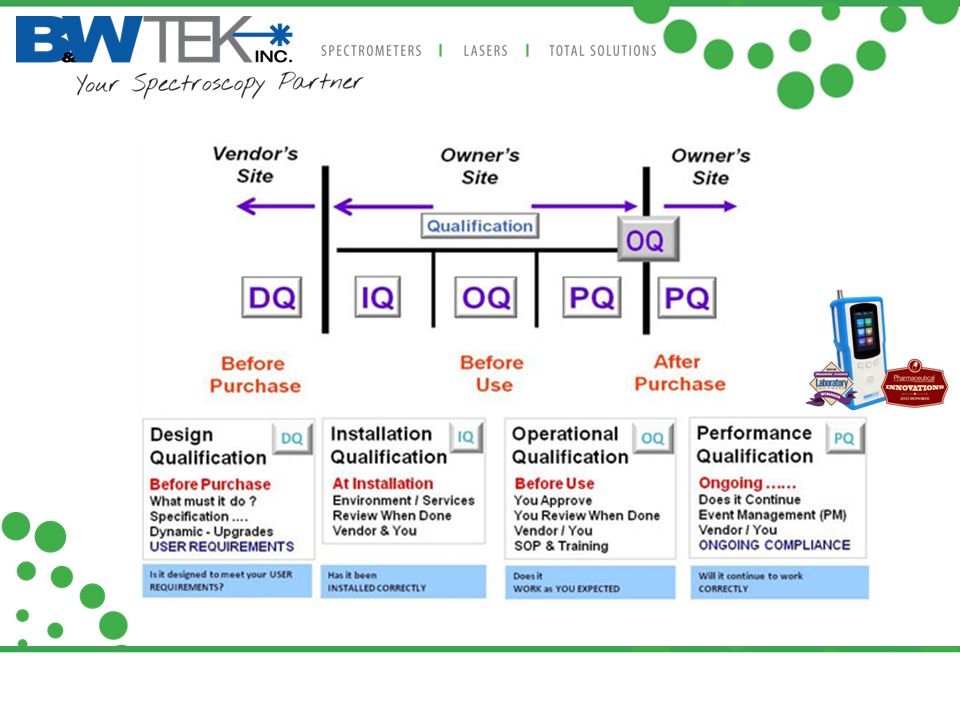
DQ/IQ/OQ and PQ Documents for NanoRam

27
Calibration Validation: part of the PQ
Self check: by performing calibration validation using ASTM 1840 ref material: Polystyrene Calibration Validation: part of the PQ Standard spectra of the following materials Reference spectra on : 1. naphthalene (Mallinckodt #94848) 2. 1,4 bis (2-methylstyryl) benzene (BMB) (Aldrich #25,740-0) 3. sulfur (Aldrich #41,498-0) /50 (v/v) toluene/acetonitrile (Mallinckrodt Analytical Reagents) acetamidophenol (active ingredients of Tylenol) (Aldrich A730-2) 6. benzonitrile (Baker B883-07) 7. cyclohexane (Mallinckrodt Analytical Reagents) 8. polystyrene (Aldrich #18,243-5)
 2. 1,4 bis (2-methylstyryl) benzene (BMB) (Aldrich #25,740-0) 3. sulfur (Aldrich #41,498-0) 4. 50/50 (v/v) toluene/acetonitrile (Mallinckrodt Analytical Reagents) 5. 4-acetamidophenol (active ingredients of Tylenol) (Aldrich A730-2) 6. benzonitrile (Baker B883-07) 7. cyclohexane (Mallinckrodt Analytical Reagents) 8. polystyrene (Aldrich #18,243-5)")
28
Near Infrared already established for ID
Provides guidance on qualitative and quantitative analysis. Samples used in ID methods should be authenticated by appropriate means (certificate of analysis or relevant testing).
.")
29
Spectroscopic-based Identity Method
The methods/libraries must be developed and can then be run on routine basis 2. Threshold p-value 0.05 based on PCA of 20 spectra Method development Measure 3-10 Batches; NanoRam uses 20 spectra 3. Build & Test Method Trained analysts

30
Spectroscopic-based Identity Method
Sample analysis 1. Access method 2. Scan sample 3. Identify material Operators

31
ID Method Development- Flowchart
Define intended purpose & scope Choose sampling accessory that will be used Authentic (or released) samples For library one spectrum of each sample is scanned Collect samples for methods Powder in vial, in real package… Any anomalies or outliers ? The sources of variations (if any) Scan barcode and samples; visual evaluation of scan Tablet: Two faces scans/per tablet Sample spectrum added to method being created; 20 spectra needed Add sample to method Capsule: better to remove capsule shell (if possible) Method created after data collected For library method development see NanoRam users manual section 6.4 The method on the NanoRam is automatically created after the 20 scans are collected. A user does not need to follow the steps of rigorous chemometric model building (as required with NIR). The data are normalized, and a second derivative applied. A PCA model of the 20 scans is developed, and model rank based on 90% explained variance of the data. In the Identification Mode samples are then projected onto the Method model, and if they fall within the 95% confidence of the PCA model (0.05 p value), they PASS the method ID. For method the p value is used as pass/fail criteria. Default setting p>0.05 is defined under Settings Threshold can be modified during method development to decrease overlap of materials. ID Method validation
 samples. For library one spectrum of each sample is scanned. Collect samples for methods. Powder in vial, in real package… Any anomalies or outliers The sources of variations (if any) Scan barcode and samples; visual evaluation of scan. Tablet: Two faces scans/per tablet. Sample spectrum added to method being created; 20 spectra needed. Add sample to method. Capsule: better to remove capsule shell (if possible) Method created after data collected. For library method development see NanoRam users manual section 6.4. The method on the NanoRam is automatically created after the 20 scans are collected. A user does not need to follow the steps of rigorous chemometric model building (as required with NIR). The data are normalized, and a second derivative applied. A PCA model of the 20 scans is developed, and model rank based on 90% explained variance of the data. In the Identification Mode samples are then projected onto the Method model, and if they fall within the 95% confidence of the PCA model (0.05 p value), they PASS the method ID. For method the p value is used as pass/fail criteria. Default setting p>0.05 is defined under Settings. Threshold can be modified during method development to decrease overlap of materials. ID Method validation.")
32
Raman Method Development
Raman bands are distinct and can be easily related to chemical structure -very good for fingerprinting. Conduct a feasibility test: To ensure sufficient sensitivity for compounds to be included in the reference library (very weak scatterers) Minimize fluorescence interference/impurities Laser powers and exposure times confirm that the sample is not being altered Sampling Appropriate sample accessory Collect valid representative samples Understand the sources of variations Glass vial and packaging materials’ variability Material lot-to-lot variability Supplier variations Need to evaluate the performance on testing numerous lots of material
 Minimize fluorescence interference/impurities. Laser powers and exposure times. confirm that the sample is not being altered. Sampling. Appropriate sample accessory. Collect valid representative samples. Understand the sources of variations. Glass vial and packaging materials’ variability. Material lot-to-lot variability. Supplier variations. Need to evaluate the performance on testing numerous lots of material.")
33
Raman Method Development
Raman bands are distinct and can be easily related to chemical structure -very good for fingerprinting. Raman spectral data collection Measure through containers and plastic bags with appropriate accessory; contribution from the packaging components are usually very minor System automatically determines scan time to give sufficient Raman signal for each sample Collect 20 scans for each method – best to use different lots Identification Method The method is based on the 20 scans of the material A multivariate model of the spectra (PCA) with Hotelling’sT2 limit determined (95% confidence; p = 0.05) p-value used as Pass/Fail criterion
 with Hotelling’sT2 limit determined (95% confidence; p = 0.05) p-value used as Pass/Fail criterion.")
34
Tools for different verification modes of materials.
Identification vs. defined method with p-value (significance level) Investigation for unknown samples: HQI In general, we recommend the use of p-value for ID (identification mode). The HQI (Investigation mode) may be considered an additional tool for validation.
 Investigation for unknown samples: HQI. In general, we recommend the use of p-value for ID (identification mode). The HQI (Investigation mode) may be considered an additional tool for validation.")
35
Results from NanoRam Identification: Pass/Fail
sample identity verified by comparison to defined method; p-value used as pass criterion Investigation: Match/No Match sample matched by correlation (HQI) to materials that are in the libraries available on the system
 to materials that are in the libraries available on the system.")
36
When running IDENTIFICATION and sample fails, there may show some potential hits.
If an identification fails, the system will automatically run an investigation to suggest potential matches for reference purpose.

37
Analytical Method Validation
Do we need to perform method validation of spectroscopic-based techniques ?

38
Japan Pharmacopoeia XVI (JP 16)
")
39
ICH Q2 Analytical Method Validation

40
Spectroscopic Method Validation
Method Building Identification Method and operation preset settings Notes should include ref to samples Samples At least 3 lots (best to use more lots) Authentic (or released) samples If only 1 set is available is ok, method can be revisited at a later stage. (+) Positive Controls (one per product) – not being used in development (-) Negative Controls-similar materials Method Validation specificity Internal External (+, -) Robustness* One Positive Control per product, uses materials used for method development One to three Positive Controls One Negative Control * Robustness is not required from USP <1225> & ICH Q2(R1). In practice it is better to assess the variations of sampling techniques during early method development
 Authentic (or released) samples. If only 1 set is available is ok, method can be revisited at a later stage. (+) Positive Controls (one per product) – not being used in development. (-) Negative Controls-similar materials. Method Validation. specificity Internal. External (+, -) Robustness* One Positive Control per product, uses materials used for method development. One to three Positive Controls One Negative Control. * Robustness is not required from USP <1225> & ICH Q2(R1). In practice it is better to assess the variations of sampling techniques during early method development.")
41
Proximity Matrix www.bwtek.com
Proximity Matrix: Testing of all the materials in Identification Mode using specific methods generated by each of the reference materials Method Materials Method A Method B Method C Method D Method E Material A PASS Fail Material B Material C Material D Material E Provides an overview to illustrate which chemicals may produce: False Positive False Negative good signal bad signal… Green …no problem Yellow… carefull, potential issue red… detail studied is required p-value > 0.05 < 0.05 < 10-3 < 10-6 zero

42
Method Validation for Qualitative analysis (ID)
It is important to test methods to ensure correct PASS of known good materials and correct FAIL of materials known to not be what the method was developed for Our OQ and PQ procedures include tests for this – ensuring that there are not false positives or false negatives from the methods Validation requires risk assessment and should be done at a level commensurate with the risk that an incorrect result carries Focus on minimizing possible harm to patient.

43
Method Validation Depending on the criticality of the Raman method, steps for checking the method validity should be done on a periodic basis A method performance test can include running a check sample by the Raman method and testing the results versus the compendial method used as reference for the method development PQ is done to test instrument performance at regular intervals

44
Spectroscopic Method:Iterative Nature
Intended use Based on science Configuration/Sampling Spectral-pretreatment Sample selection Calibration/validation sets Mainte-nance Collection Method Validation Develop-ment Data storage Continuous performance verification Method update Re-validation Raman Spectroscopy Method developed on NanoRam with defined settings Chemometric/statistical methods/ algorithms Protocol & report Validation elements

45
Raman Method- Beyond Routine Analysis: Change Control & OOS
Out of Specifications- ID Failure Periodic Performance Review Method and Library Update

46
Raman Analytical Method Maintenance
VMP for Raman methods Raman Method Maintenance New Raman Method Method Modifications Method Review Emergency Review (OOS etc) Method Development Critical Method Elements (Leading to Verification) PC/Software Instrumentation Periodic Reviews (short/long term) Materials change Standards Annual Review Extensive Review Acceptance limits Operator
 Method Development. Critical Method Elements (Leading to Verification) PC/Software. Instrumentation. Periodic Reviews (short/long term) Materials change. Standards. Annual Review. Extensive Review. Acceptance limits. Operator.")
47
Raman Routine Analysis- More Details
Similar to QC methods, but… ID results - Out of Specification Follow internal SOPs, investigate root causes Instrument or operating errors? Variations of material sources or grades? Change Control Risk assessment of incidents (e.g. laser, accessory, change of packaging material) Periodic Performance Verification (PQ) Should be run at regular intervals (or N batches) Event trigger: changes of hardware/software, change of material supplier or results trends
 Periodic Performance Verification (PQ) Should be run at regular intervals (or N batches) Event trigger: changes of hardware/software, change of material supplier or results trends.")
48
Standard Operating Procedures (SOPs)
Guidance for Raman ID Method Development: B&W Tek doc available SOPs for Raman General Operation: NanoRam User Manual Procedures that describe how to use the system: NanoRam User Manual SOPs for Raman Calibration and Maintenance, including relocation performance check : annual system recertification SOPs for Raman System Disaster Recovery User’s internal SOPs for Change control plan- Hardware/software upgrade Change of sampling module (e.g., point and shoot to vial holder). SOPs for Raman Method Performance Verification Periodic performance verification PQ SOPs for Method and Library update Conditions and decision to launch a method update Requirements for electronic data archival
. SOPs for Raman Method Performance Verification. Periodic performance verification PQ. SOPs for Method and Library update. Conditions and decision to launch a method update. Requirements for electronic data archival.")
49
Regulatory Expectations for Spectroscopic-based Methods
The Pharmaceutical Inspection Convention and Pharmaceutical Inspection Co-operation Scheme (jointly referred to as PIC/S) are two international instruments between countries and pharmaceutical inspection authorities, which provide together an active and constructive co-operation in the field of GMP.
 are two international instruments between countries and pharmaceutical inspection authorities, which provide together an active and constructive co-operation in the field of GMP.")
50
Raman Related Documents (1)
Pharmacopeia United States Pharmacopeia (USP34/NF29) General Chapter <1120> Raman Spectroscopy European Pharmacopeia (Ph Eur 7.0) Raman Spectroscopy Pharmacopeia of the People‘s Republic of China (2010)- Raman Spectroscopy 拉曼光谱法指导原则 EMA Guidance – effective Oct 1, 2012 EMA/CHMP/QWP/811210/2009-Final Guideline on Real Time Release Testing (formerly Guideline on Parametric Release) …may utilize process analytical technology (PAT) tools e.g. near infrared spectroscopy (NIR) and Raman spectroscopy
 General Chapter <1120> Raman Spectroscopy. European Pharmacopeia (Ph Eur 7.0) Raman Spectroscopy. Pharmacopeia of the People‘s Republic of China (2010)- Raman Spectroscopy 拉曼光谱法指导原则. EMA Guidance – effective Oct 1, EMA/CHMP/QWP/811210/2009-Final Guideline on Real Time Release Testing (formerly Guideline on Parametric Release) …may utilize process analytical technology (PAT) tools e.g. near infrared spectroscopy (NIR) and Raman spectroscopy.")
51
Raman Related Documents (2)
ASTM E (2007) Standard Guide for Raman Shift Standards for Spectrometer Calibration ASTM E (2007) Standard Practice for Testing the Performance of Scanning Raman Spectrometers ASTM E Standard Guide for Testing the Resolution of a Raman Spectrometer US FDA Advancing Regulatory Science at FDA: A Strategic Plan (August 2011): Section 2. Develop new analytical methods: a) Investigate feasibility and value of using emerging and improved analytical technologies like Nuclear Magnetic Resonance (NMR), mass spectrometry, or near infrared or Raman spectroscopy for evaluating product quality of pharmaceutical agents, and evaluate whether these technologies should replace existing methods;
 Standard Guide for Raman Shift Standards for Spectrometer Calibration. ASTM E (2007) Standard Practice for Testing the Performance of Scanning Raman Spectrometers. ASTM E Standard Guide for Testing the Resolution of a Raman Spectrometer. US FDA Advancing Regulatory Science at FDA: A Strategic Plan (August 2011): Section 2. Develop new analytical methods: a) Investigate feasibility and value of using emerging and improved analytical technologies like Nuclear Magnetic Resonance (NMR), mass spectrometry, or near infrared or Raman spectroscopy for evaluating product quality of pharmaceutical agents, and evaluate whether these technologies should replace existing methods;")
52
Raman Method–How do you make a regulatory filing?
Changes US FDA EU (new) NIR/Raman based analytical method (new or alternative method) API: starting material, intermediate FP: excipient, product Annual Report PAS (if high risk to quality)* Type IB as “other changes to a test procedure (including replacement or addition). Changes requiring prior approval Change in test procedure for the immediate packaging or reagents (low quality risk) of the API & FP Type IA Minor variation- Not requiring immediate notification 1.Real-Time Release Test 2.Introduction of new or extension of existing Design Space PAS (Post Approval Supplement) Type II Major var. Significant impact on Q/S/E Reference only- Need to consult with specific Regulatory Affairs contact Ref: US FDA 21CFR314.70Rev. 2012, and EMA "Guidelines on the details of the various categories of variations for medical products for human use and veterinary medicinal products" (2010/C 17/01).
 NIR/Raman based analytical method (new or alternative method) API: starting material, intermediate. FP: excipient, product. Annual Report. PAS (if high risk to quality)* Type IB as other changes to a test procedure (including replacement or addition). Changes requiring prior approval. Change in test procedure for the immediate packaging or reagents (low quality risk) of the API & FP. Type IA. Minor variation- Not requiring immediate notification. 1.Real-Time Release Test. 2.Introduction of new or extension of existing Design Space. PAS (Post Approval Supplement) Type II. Major var. Significant. impact on Q/S/E. Reference only- Need to consult with specific Regulatory Affairs contact. Ref: US FDA 21CFR314.70Rev. 2012, and EMA Guidelines on the details of the various categories of variations for medical products for human use and veterinary medicinal products (2010/C 17/01).")
53
Challenges for using Raman Methods
Within Pharma organization Introducing new technology can be a challenge QA or regulatory staff adverse to change Confusion about the validation elements & procedures: B&W Tek can help Local regulatory agencies Lack of existing USP, EP or EMA guidance specific to Raman ID Different outcomes and comments from reviewers Instrument vendors/sales representative Limited knowledge of the regulatory process Not always staffed for applications support

54
Strategy and Approach for Raman Implementation
Define objectives- intended use Project Team: Requires complete preparation and coordination Identify project members and leader (coordinator) Treat Raman technique as a general GMP method Understand advantages and limitations of technique Review GMP regulation (EU, US FDA, PIC/S) and pharmacopeia (USP, EP, EMA) requirements Contact instrument supplier/vendor and evaluate their technical/GMP/supporting capability; partner with supplier Full participation of internal departments (QC, QA, Regulatory affairs, Manufacturing, R&D) with open discussions to reduce communication/technical barriers
 Treat Raman technique as a general GMP method. Understand advantages and limitations of technique. Review GMP regulation (EU, US FDA, PIC/S) and pharmacopeia (USP, EP, EMA) requirements. Contact instrument supplier/vendor and evaluate their technical/GMP/supporting capability; partner with supplier. Full participation of internal departments (QC, QA, Regulatory affairs, Manufacturing, R&D) with open discussions to reduce communication/technical barriers.")
55
Common Questions from Customers…….

56
Q1: What is the difference between ID and purity tests
“Identity” and “Purity” are two separate specifications. “Purity” implies some type of quantitative method; typically HPLC “Purity” is a test for specific impurities such as low level contaminants/adulterants. An identity test says nothing about purity, strength, or composition. Usually gives “binary result”: Positive/Negative; Pass/Fail; Yes/No Identity verifies it is similar to what has been used in the past Every proposed method should be validated if it is used for quality decision!

57
Q2: How long does it take to get a Raman Method in place
Bottleneck: Document preparation & internal review Assembling samples Example: Develop an ID method for 10 materials: Training < 1 week Method development 1-2 weeks Specificity & robustness tests < 1 week Documentation (prepare, review & approve) 2-4 weeks The first ID method validation takes weeks The next ID validation project takes only 1-2 weeks B&W Tek can provide Support Services
 2-4 weeks. The first ID method validation takes weeks. The next ID validation project takes only 1-2 weeks. B&W Tek can provide Support Services.")
58
Q3: How do traditional vs. spectroscopic-based methods compare?
In traditional methods often have a univariate calibration model Spectroscopic method based on chemometric modeling or statistical calculations Identification/Qualitative Calculate spectral similarity between method and unknown samples Specificity test- interval validation evaluation focus on the model correctness of spectral library Note: Different terminology: Calibration in chemometrics- method/model calibration Calibration in GMP environment - e.g., instrument calibration

59
Q4: Can I use a commercial spectral library
Motivation: reduce development time & manpower if the spectral library or database can be supplied by Vendor or Third Party. Challenges: under Pharma GMP: qualified raw material library should be evaluated: Authentic materials?- identify sources, lot number, expiration date etc. and assess the authenticity (with test record) Qualified instrument? – assess instrumentation/configurations (resolution, range, probe etc),experimental and GMP qualification documents. Suitability: Commercial library/database could be used for general screening purpose (e.g., contract lab, food/chemical industry), Understand intended use- e.g., “…This library is designed for those laboratories studying pharmaceutical formulations using Raman spectroscopy” Question: Can a Pharma Lab use commercial library for an ID test ?
 Qualified instrument – assess instrumentation/configurations (resolution, range, probe etc),experimental and GMP qualification documents. Suitability: Commercial library/database could be used for general screening purpose (e.g., contract lab, food/chemical industry), Understand intended use- e.g., …This library is designed for those laboratories studying pharmaceutical formulations using Raman spectroscopy Question: Can a Pharma Lab use commercial library for an ID test")
60
Issues on using Commercial Spectral Library or Database
US FDA Warning Letters Jilin Shulan Synthetic Pharmaceutical Co 5/13/2010 #5. You routinely failed to utilize a suitable standard for the spectral comparison during the FTIR testing of XXX. Instead, you compared sample spectra with the spectrum of XXX in the Chinese Pharmacopeia. The USP requires that you compare the spectrum of your test sample with that of your reference standard. Yunnan Hande Bio-Tech. Co. Ltd. 10/15/10 #4. a. Your firm does not concurrently analyze the FTIR samples with a XXX reference standard. Instead, you analyze the sample against a spectrum stored in the memory of the FTIR. During our inspection, you were unable to provide data to show when and how you prepared and qualified the FTIR spectrum standard. EP Raman Spectroscopy …This database is then valid for use only with the originating instrument, or with a similar instrument, provided the transferred database has been demonstrated to remain valid.

61
Summary Increase analysis
Raman Increase analysis Cost reduction Improve operations Competitiveness Summary Raman has proven to be a promising tool to increase operational capabilities and reduce cost while providing rapid material identification. 61

62
Thank you for your attention
Dr. Katherine Bakeev Director Application Support Services B&W Tek, Inc. x1416 62

63
Back up slides

64
USP <1225>Validation of Compendial Procedures

65
Why do Raman ID methods fail? (1)
Failure to include lot-to-lot variability use numerous non-consecutive lots realize material potential variability (particle size, moisture, mechanics etc.) Failure to understand the limitation of Raman fluorescence interference low Raman scattering signal (e.g., cellulose, salts, metals) low concentration (e.g., tablet API) Potentially close materials give ambiguous results (pass more than one method) Adjust p-value to narrow acceptance range for material, and limit overlap of methods
 Failure to understand the limitation of Raman. fluorescence interference. low Raman scattering signal (e.g., cellulose, salts, metals) low concentration (e.g., tablet API) Potentially close materials give ambiguous results (pass more than one method) Adjust p-value to narrow acceptance range for material, and limit overlap of methods.")
66
Why do Raman ID methods fail? (2)
Occasional operational errors Sampling/scanning problem Quality of sample vials (sealed, glass etc.), plastic bags or containers Method specific to particular sampling accessory and/or packaging Limited knowledge or misuse of identity algorithms Performance/sensitivity of identification method (p-value is based on a PCA model on the 20 scans in the method)
, plastic bags or containers. Method specific to particular sampling accessory and/or packaging. Limited knowledge or misuse of identity algorithms. Performance/sensitivity of identification method (p-value is based on a PCA model on the 20 scans in the method)")
67
Deficiencies of Filed Spectroscopic Methods (1)
Absence of instrument description Light source, design, detector, sampling module, software package Minimal description of chemometric techniques Algorithms for pass/fail results Method validation Limited results for method validation Without acceptance criteria (ID thresholds) Detailed results (with predicted values, not just pass or fail) Inappropriate selection of negative control samples (material structurally similar or closely related to the analyte)
 Detailed results (with predicted values, not just pass or fail) Inappropriate selection of negative control samples (material structurally similar or closely related to the analyte)")
68
Deficiencies of Filed Spectroscopic Methods (2)
Inadequate SOPs and plan for change control Spectroscopic method performance verification? Spectroscopic method maintenance plan? Lack of information for library/method update plan SOPs for method/library update?

Similar presentations


 Product Quality Review (PQR)>")


