Download presentation
Presentation is loading. Please wait.

1
The Sun II The Solar Atmosphere The Solar Wind The Solar Cycle

2
Solar Granulation Careful observations of the base of the photosphere reveal “granulation” …a patchwork of dark and bright regions that are constantly changing Characteristic spatial extent of 700 km and lifetimes of 10 minutes This is the top of the convection zone protruding into the photosphere!!!! Absorption lines exhibit Doppler shifts indicating radial velocities of patches of about 0.4 km/s. The bright cells are vertically rising hot convective bubbles!!! When these bubble reach the optically thin photosphere they release their energy in the form of photons. The resulting cooler, darker gas sinks back into the interior

3
Solar Granulation

4
Differential Rotation
Photospheric absorption lines may also be used to measure rotation rate of the sun at the solar limb At the equator the rotation period is approximately 25 days whereas at the poles the rotation period is approximately 36 days Solar rotation also varies with radius. At the “Tacholine” at about 0.7 Rsun the rotation rates converge at the base of the convection zone The strong shear that is set up in this region is believed to result in electric current in the highly conducting plasma Probably the source of the Sun’s Magnetic Field!!!!!

5
The Chromosphere Intensity of only about 10-4 of the value of the photosphere. Lies just above the photosphere and extends upward approximately 1600 km. Gas density drops by about Temperature increases from 4400 K to about 10,000K Additional lines that are not possible prevalent in the lower temperatures/higher pressures of the photosphere can be produced here. He-II , Fe-II Si-II, Cr-II Ca-II Some emission lines appear in addition to absorption lines particularly those wavelengths outside of the visible range. Some visible wavelength emission lines can be observed during a brief instant during eclipses Supergranulation and other structure is observed in the chromosphere. These are continued effects of the underlying convection zone Doppler studies indicate radial velocities of about 0.4 km/s Gas rising in the center of the supergranules and falling at the edges

6
The Chromosphere Spicules
Spicules: Vertical filaments of gas extending upward from the chromosphere for 10,000 km Individual lifetime of about 15 minutes Several percent of the surface area of the Sun is covered by Spicules at any moment Material moving outward at speeds of 15 km/s

7
The Transition Region The region above the chromosphere with rapidly varying temperature that eventually reaches 100,000K over 100km. The temperature then slowly rises to about 1,000,000K The transition region can be observed in the Ultraviolet and extreme-ultraviolet regions of the spectrum Sun viewed in the extreme Ultraviolet

8
The Corona Visible during eclipses when the Moon fully occults the photosphere. Faint radiation nearly 106 times less intense than the photosphere Number density of particles at the base is 1015 particles/m3 (solar wind at 107 particles/m3) Not in local thermodynamic equilibrium. Temperature means what?… T~2x10⁶ K by some measures Low number densities allow forbidden transitions to occur Source of radio wavelength emission free-free electron transitions X-ray emission observed due to high temperature
 Not in local thermodynamic equilibrium. Temperature means what … T~2x10⁶ K by some measures. Low number densities allow forbidden transitions to occur. Source of radio wavelength emission free-free electron transitions. X-ray emission observed due to high temperature.")
9
The Corona

10
The Corona

11
Coronal Holes and the Solar Wind
Images of the Sun in X-ray and extreme UV show that XUV and X-ray emission is not uniform X-ray bright Regions: Associated with the closed magnetic field lines that return to the Sun. Coronal holes: darker/cooler regions in X-ray emission Localized bright spots can appear and disappear on the timescale of hours in the coronal holes The weaker X-ray emission is characteristic of the lower temperatures and densities in the region of the holes The existence of coronal holes is tied to the Sun’s magnetic field and the generation of a fast solar wind. Magnetic field lines in these regions are believed to be “open”. Charged particles can “stream” along these “open” field lines and escape. Solar Wind: Fast: a continuous stream of ions and electrons escaping from the Sun and moving through interplanetary space at ~ 750 km/s. Slow: Gusty, about half of the speed 375/km/s. Produced by streamers in the Corona associated with closed magnetic fields SOHO Extreme UV image SOHO 3 X-ray band image

12
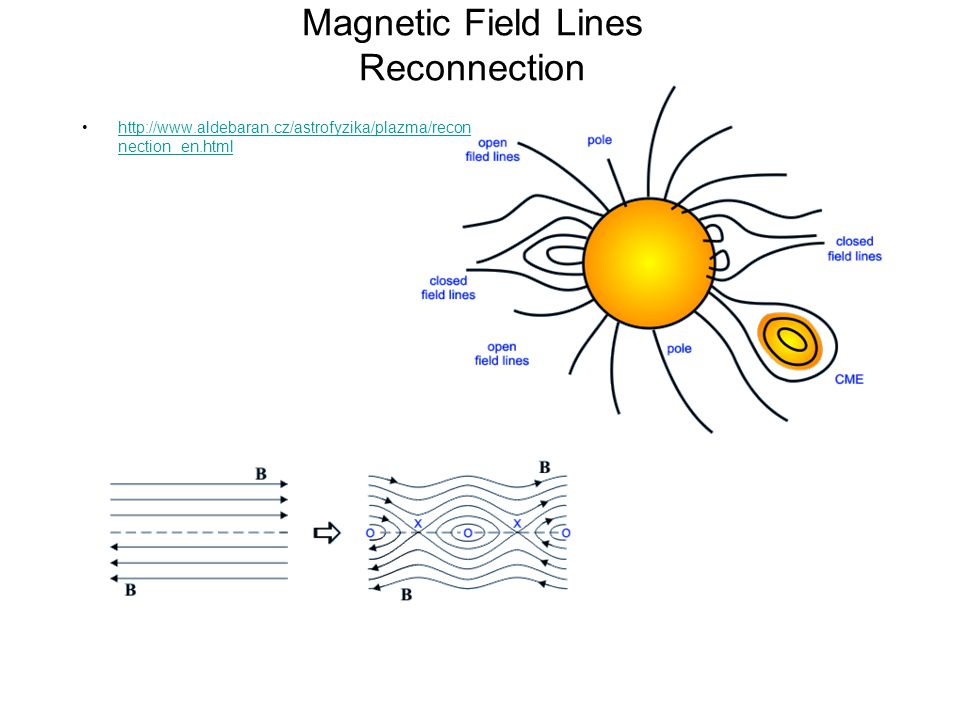
Magnetic Field of Sun Magnetic Field of Sun is significant. With high degree of spatial and temporal variability. Field strength at surface is typically 10-4 T. “Open” field lines: Some of the magnetic field lines extend out for great distances from the Sun. Closed field lines: The magnetic field lines that directly return to the Sun. Solar Magnetic field interacts strongly with charge particles in its atmosphere via the Lorentz Force Charged particles are forced to spiral around the magnetic field lines (If E is negligible) Closed field lines tend to trap charged particles !!!! In regions of open field lines charged particles can follow the field lines out away from the Sun
 Closed field lines tend to trap charged particles !!!! In regions of open field lines charged particles can follow the field lines out away from the Sun.")
13
Magnetic Field Lines Reconnection
14
Solar Wind

15
Solar Wind Comet Tails: Evidence for Solar wind even before solar wind particles directly detected. It is the electrical interaction between the ions of the solar wind and the ions in the ion tail that make the ion tail point directly away from the Sun. Aurora (Borealis/Australis): The ions from the Sun interact with the Earth’s magnetic field becoming trapped. These ions bounce back and forth between the poles forming the Van Allen Radiation Belt. The ions that are sufficiently energetic will collide with atoms in the upper atmosphere of the Earth causing the atoms to either become excited or ionized. It is these de-excitations and recombination that produce the light of the aurora. Direct Detection and Measurement: Ulysses spacecraft measured the solar wind at a distance of 1 AU from the sun (even out of the ecliptic plane). Speed 200 km/s km/s. Density 7 x 10⁶ ions/m3. Temperature 4 x 10⁴K for protons, 105 K for electrons.
: The ions from the Sun interact with the Earth’s magnetic field becoming trapped. These ions bounce back and forth between the poles forming the Van Allen Radiation Belt. The ions that are sufficiently energetic will collide with atoms in the upper atmosphere of the Earth causing the atoms to either become excited or ionized. It is these de-excitations and recombination that produce the light of the aurora. Direct Detection and Measurement: Ulysses spacecraft measured the solar wind at a distance of 1 AU from the sun (even out of the ecliptic plane). Speed 200 km/s km/s. Density 7 x 10⁶ ions/m3. Temperature 4 x 10⁴K for protons, 105 K for electrons.")
16
Solar Wind how much?how far

17
Solar Wind how much?how far
Solar wind runs into interstellar wind …termination shock at 95 A Known as Heliopause

18
Parker Wind Model How does expansion of the Corona produce the Solar wind? High thermal conductivity of the plasma in the Corona --> Almost Isothermal Consider Hydrostatic Equilbrium equation in region of Corona. Mr~M. Assuming that gas is completely ionized hydrogen From Ideal Gas Law we may write: The Hydrostatic equilibrium equation becomes: Making the assumption that the gas is isothermal we can integrate and obtain an expression for the number density (and pressure) as a function of radius: Where And n=n0 at some radius r=r0. is approximately the ratio of a proton’s gravitational energy and its thermal kinetic energy at a distance r0 from the Sun. The pressure can be written as: This pressure does not approach zero as At r0=1.4 R T~1.5 x 10⁶K n0=3 x 10¹³ m-3. ~5.5. The actual values are much lower…..
 as a function of radius: Where. And n=n0 at some radius r=r0. is approximately the ratio of a proton’s gravitational energy and its thermal kinetic energy at a distance r0 from the Sun. The pressure can be written as: This pressure does not approach zero as. At r0=1.4 R T~1.5 x 10⁶K n0=3 x 10¹³ m-3. ~5.5. The actual values are much lower…..")
19
Hydrodynamic Nature of the Upper Atmosphere
In the solar atmosphere, the simple approximation of hydrostatic equilibrium must be replaced by a set of hydrodynamic equations that describe the flow. In particular when we write Equation 10.5 becomes Where v is the velocity of the flow. Conservation of mass flow can be expressed as This expression immediately implies that At the top of the convection zone, the motion of the hot, rising gas and the return flow of the cool gas sets up longitudinal (pressure) waves that propagate outward. The outward flux of wave energy can be expressed as: Where vs is the local sound speed and vw is the velocity amplitude of the oscillatory wave motion for individual particles being driven about their equilibrium positions by the “piston” of the convective zone. From Eq the sound speed is given by Using the ideal gas law we can re-write this as
 waves that propagate outward. The outward flux of wave energy can be expressed as: Where vs is the local sound speed and vw is the velocity amplitude of the oscillatory wave motion for individual particles being driven about their equilibrium positions by the piston of the convective zone. From Eq the sound speed is given by. Using the ideal gas law we can re-write this as.")
20
Hydrodynamic Nature of the Upper Atmosphere
At the top of the convective zone vw<vs. However the density of the gas decreases significantly with altitude dropping by 4 orders of mag in 1000km. Assuming that very little mechanical energy is lost in moving through the photosphere and that vs and T remains the same…vw must increase significantly (2 orders of mag). Wave motion quickly becomes supersonic vw>vs as particles in the wave try to travel through the medium faster than a local speed of sound. Shock Wave Shock Front: A very steep density change over a short distance. As a shock moves through a gas it produces a great deal of heating through collisions, leaving the gas behind the shock highly ionized. This heating comes at the expense of the mechanical energy of the shock which quickly dissipates. Gas in Chromosphere is heated by the mass motions created in the convective zone!!!
. Wave motion quickly becomes supersonic vw>vs as particles in the wave try to travel through the medium faster than a local speed of sound. Shock Wave. Shock Front: A very steep density change over a short distance. As a shock moves through a gas it produces a great deal of heating through collisions, leaving the gas behind the shock highly ionized. This heating comes at the expense of the mechanical energy of the shock which quickly dissipates. Gas in Chromosphere is heated by the mass motions created in the convective zone!!! topic=21.0.")
21
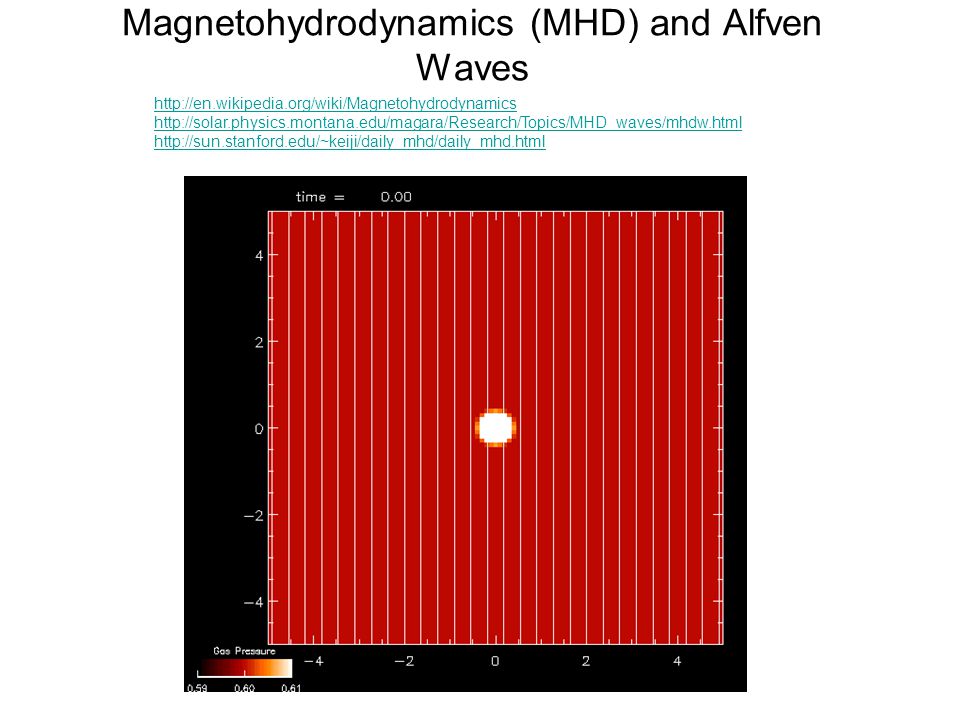
Magnetohydrodynamics (MHD) and Alfven Waves
MHD is the study of the interactions between magnetic fields and plasmas. Hydrodynamic equations discussed so far left out the effect of the Sun’s magnetic field. The temperature structure of the outer solar atmosphere is due at least in part to the presence of the magnetic field coupled with mass motions produced by the convective zone. The presence of a magnetic field allows for the generation of a 2nd type of wave motion. These waves propagate along the magnetic field lines as a consequence of the restoring force of the field lines. Magnetic Energy Density Magnetic field lines “frozen” into plasma Density of field lines and hence the magnetic field strength changes when a plasma is compressed in a direction perpendicular to the field lines. Energy density of B has increased Mechanical work was done, but Magnetic Pressure exists

22
Magnetohydrodynamics (MHD) and Alfven Waves
Magnetic Pressure Gradient established when field lines are compressed This pressure change tends to push the field lines back, restoring the original density. Analagous to oscillations on a string when plucked. Tension on the string pulls it back… Magnetic Pressure Gradient “Tension” A disturbance in the magnetic field line can propagate down the line… Alfven Wave Transverse MHD wave Speed of propagation can be estimated by comparing with sound speed in gas The Alfven wave speed should be approximately More careful treatment results in:

23
Magnetohydrodynamics (MHD) and Alfven Waves
Alfven waves may transport energy outward. Time-varying Magnetic field Electric Field Electric Current in Plasma Resistive Joule Heating Temperature rise

24
Alfven Waves and sound speed

25
Magnetohydrodynamics (MHD) and Alfven Waves
26
Alfven Waves

27
Solar Magnetic Field No apparent differential rotation in corona or solar magnetic field Sun Rotates Open B-field lines are dragged along through interplanetary space Solar Wind is forced to move with the field lines Torque Produced Sun’s rotation is slowed

28
The Outer Atmosphere of other Stars
Looks like stellar winds slow down many stars rotations…even for low mass stars Wind transfering angular momentum away from star Late main sequence stars slower rotation rates than younger stars This Chandra image is the most detailed ever made of the remains of an exploded star. The one million-second image shows a bright outer ring ten light years in diameter that marks the location of a shock wave generated by the supernova explosion. A large jet-like structure protrudes beyond the shock wave in the upper left. Scale: Image is 8 arcmin per side. Eta Carinae: HST image

29
The Solar Cycle Sunspots
Zeeman effect splitting of spectral lines Strength of Magnetic Field Polarization of light Direction of Magnetic Field Number of Sunspots is periodic going from minimum to maximum and back to minimum in approximately 11 years The average latitude of sunspot formation also periodic with an ~ 11 year cycle. Individual sunspots are short-lived typically no longer than 1 month Individual sunspot remains at same latitude. Although succeeding sunspots are formed at progressively lower latitudes…hmmm? New cycle typically begins at +/- 40 Darkest portion known as the Umbra may measure as much as 30,000 km in diameter. Surrounded by the penumbra associated with magnetic lines of force. Field strengths of several 0.1 Tesla and greater have been measured in centers of Umbral Regions. Polarization indicates that field is vertical in center of umbra moving to horizontal at edges of penumbra Magnetic Fields Sunspots

30
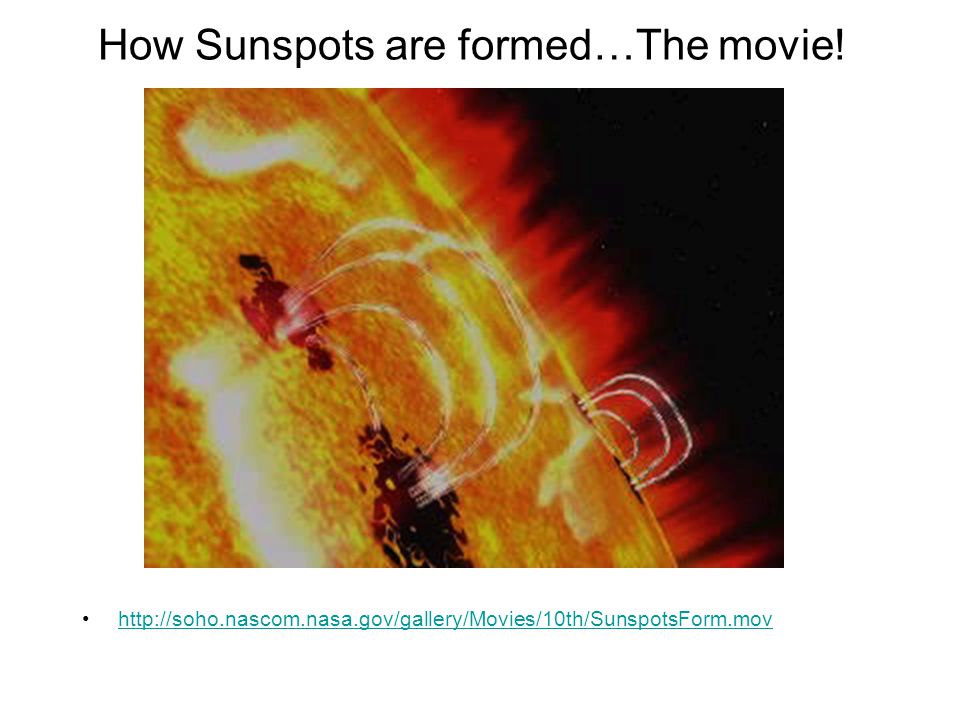
How Sunspots are formed…The movie!
31
Sunspots Dark Appearance due to relatively lower temperature.
Central portion of Umbra may be as low as 3900K compared with 5777K. Factor of 4.8 reduction in flux. Most likely magnetic fields are inhibiting convective motion in the sunspot Much longer timescale variability as well. Maunder Minimum between 1645 and 1715 had a drastically reduced number of sunspots. (mini-ice age in Europe during this time). Resulting only from a few tenths percent reduction in solar energy output!!! Amount of carbon-14 related…can be tracked Magnetic Pressure believed to keep sunspot from sinking!!! Generally located in groups. Lead sunspot will typically have one polarity. The lead sunspot in the other hemisphere will have opposite polarity. Trailing sunspots will have opposite polarity. During the next 11 year cycle the polarities will be reversed. Accompanying this local polarity reversal is a global polarity reversal. The overall dipole field of the sun will change so that magnetic north pole will switch from geographic north to south!!!! Polarity reversal always occurs during sunspot minimum. Polarity reversal has a 22-year cycle
. Resulting only from a few tenths percent reduction in solar energy output!!! Amount of carbon-14 related…can be tracked. Magnetic Pressure believed to keep sunspot from sinking!!! Generally located in groups. Lead sunspot will typically have one polarity. The lead sunspot in the other hemisphere will have opposite polarity. Trailing sunspots will have opposite polarity. During the next 11 year cycle the polarities will be reversed. Accompanying this local polarity reversal is a global polarity reversal. The overall dipole field of the sun will change so that magnetic north pole will switch from geographic north to south!!!! Polarity reversal always occurs during sunspot minimum. Polarity reversal has a 22-year cycle.")
32
Polarity Reversal and Differential Rotation

33
The Solar Cycle Sunspots

34
The Solar Cycle Sunspots

35
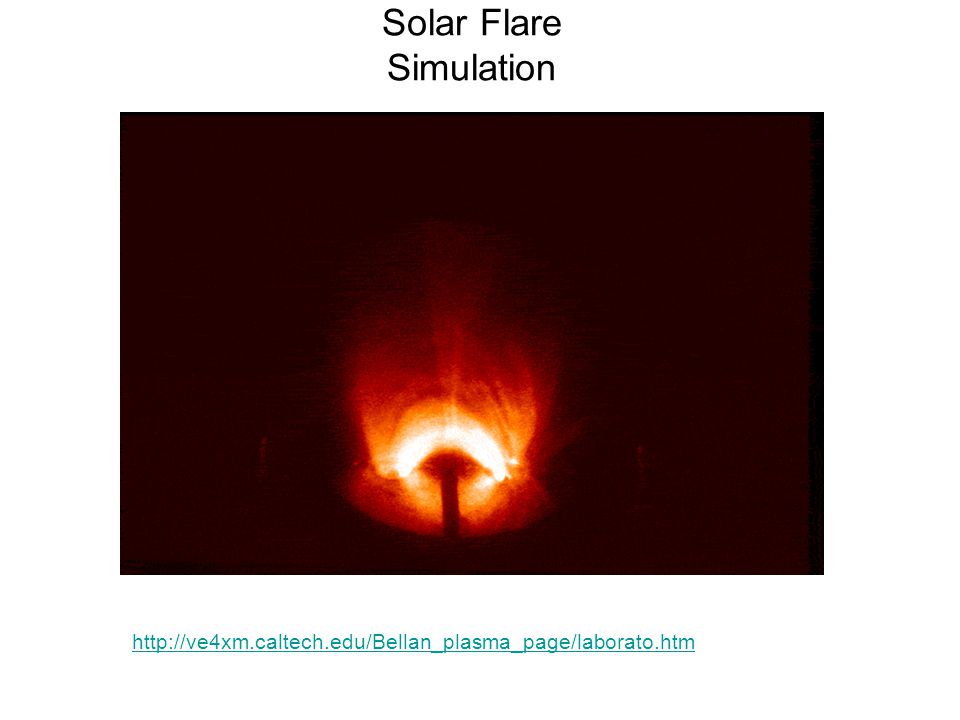
Solar Flare Solar Flare Model Disturbance in magnetic field loops
Sheet of current in the highly conducting plasma Joule heating of gas Temperature rises to 107K Particles Accelerated away from the reconnection point and away from the Sun may escape Solar Cosmic Rays Synchrotron Radio Emission, Soft X-ray from high temperatures below connection point Eruptive events 1017 J (lowest detectable) J of energy over tie intervals ranging from milliseconds to over an hour. (1025 J = 317 million GW-yr) Large flares can be 100,000 km long. Hydrogen alpha emission lines visible. Radio-x-ray emission Charged particles ejected. Solar Cosmic Rays…mostly protons and helium nuclei…may reach earth in 30 minutes…dangerous to astronauts and disruptive to communications. Flares develop where magnetic field intensity is great…sunspot groups. Quick release of magnetic energy---> flare. Still a matter of active research.. Model of Solar flare involves reconnection of magnetic filed lines
 J of energy over tie intervals ranging from milliseconds to over an hour. (1025 J = 317 million GW-yr) Large flares can be 100,000 km long. Hydrogen alpha emission lines visible. Radio-x-ray emission. Charged particles ejected. Solar Cosmic Rays…mostly protons and helium nuclei…may reach earth in 30 minutes…dangerous to astronauts and disruptive to communications. Flares develop where magnetic field intensity is great…sunspot groups. Quick release of magnetic energy---> flare. Still a matter of active research.. Model of Solar flare involves reconnection of magnetic filed lines.")
36
Solar Flare

37
Solar Flare Simulation
38
Prominence lifts away from the Sun!!!
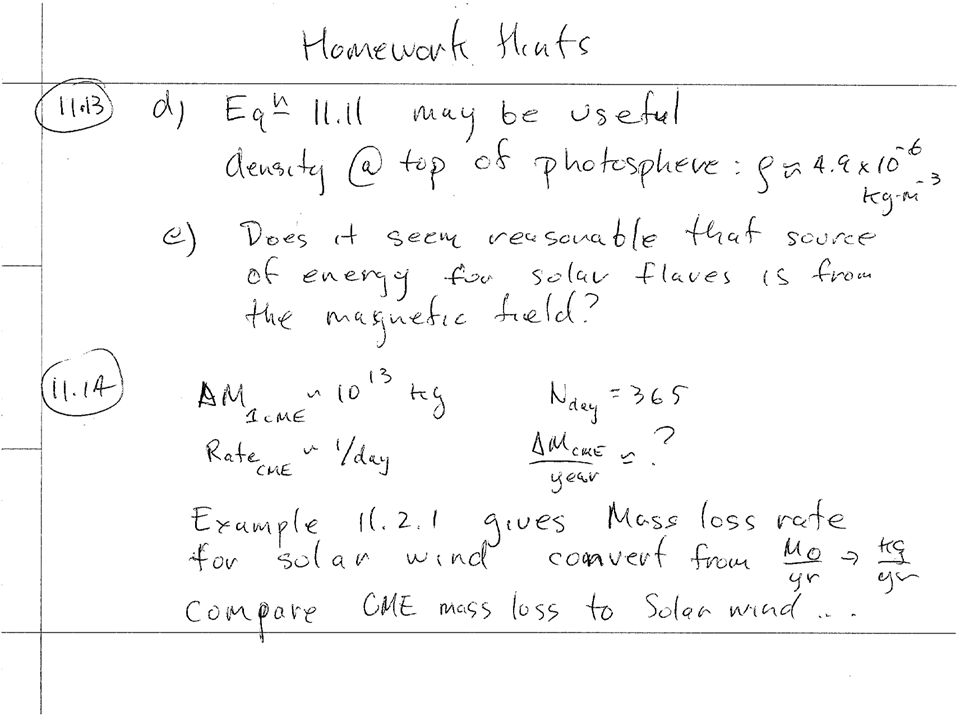
Solar Prominences Quiescent Prominence: Curtains of Ionized gas that reach well into the Corona and can remain stable for weeks or months. The material in the prominence has collected along the magnetic filed lines of an active region. The gas is cooler (8000K) and much more dense than the surrounding coronal gas. This denser gas “rains” back down into the chromosphere. When viewed in H at the limb, the prominence appears as a bright structure against the thin Corona When viewed in the continuum against the solar disk, a promincence appears as a dark filament absorbing light from below. Eruptive Prominence: may exist for a few hours and may develop abruptly from a quiescent prominence. A relatively stable magnetic field can suddenly become unstable. Prominence lifts away from the Sun!!! Related to solar flare Most of energy however goes into mass motions as gas is ejected instead of into EM radiation Coronal Mass Ejection: Routinely detected by SOHO instruments (daily on average). During periods of high sunspot activity up to 3.5 CME’s/day 5 x x 1013 kg /CME 400 km/s to >1000 km/s Magnetic “bubble” lifting off of Sun after reconnection event
 and much more dense than the surrounding coronal gas. This denser gas rains back down into the chromosphere. When viewed in H at the limb, the prominence appears as a bright structure against the thin Corona. When viewed in the continuum against the solar disk, a promincence appears as a dark filament absorbing light from below. Eruptive Prominence: may exist for a few hours and may develop abruptly from a quiescent prominence. A relatively stable magnetic field can suddenly become unstable. Prominence lifts away from the Sun!!! Related to solar flare. Most of energy however goes into mass motions as gas is ejected instead of into EM radiation. Coronal Mass Ejection: Routinely detected by SOHO instruments (daily on average). During periods of high sunspot activity up to 3.5 CME’s/day. 5 x x 1013 kg /CME. 400 km/s to >1000 km/s. Magnetic bubble lifting off of Sun after reconnection event.")
39
Masuda Solar Flare Model

40
Coronal Mass Ejection

41
How Sunspots, Flares and Coronal Mass Ejections are formed…

42
Magnetic Dynamo Theory
Solar Cycle related to changing of magnetic field of the Sun Magnetic field lines “frozen” into plasma Differential Rotation Convection Dragging of magnetic field lines Poloidal Toroidal Turbulent Convective Zone Twisting the lines creating regions of intense magnetic fields (ropes) Magnetic Pressure Buoyancy …Sunspot Groups
 Magnetic Pressure. Buoyancy …Sunspot Groups.")
43
Magnetic Dynamo Theory
Magnetic Dynamo theory explains many aspects of the Solar Cycle Latitude dependence of Sunspot development Magnetic Polarity of Sunspots Sun’s Polarity reversal Solar cycle period of 22 years Other stars Evidence for magnetic activity Observation of Starspots Still much to learn Relation to Earth’s Climate….

44
Plasmas

51
March 7 2012 Solar Flare observed by FERMI in Gamma Rays

Similar presentations


1.989x10 30 Mass (Earth = 1)332,830 Equatorial radius (km)695,000 Equatorial radius (Earth = 1)108.97.>")

 Clare E Parnell School of Mathematics and Statistics.>")


>")


