Download presentation
Presentation is loading. Please wait.

1
Japansk produktionsfilosofi - lean manufacturing
Johann Packendorff

3
Definition of “Lean” Half the hours of human effort in the factory
Half the defects in the finished product One-third the hours of engineering effort Half the factory space for the same output A tenth or less of in-process inventories Term “lean” coined by John Krafcik, one of the research members on Jim Womack’s MIT team for the 5 year study. Source: The Machine that Changed the World Womack, Jones, Roos 1990

4
Lean Manufacturing Product Shipment Customer Order Waste Time Customer
is a manufacturing philosophy which shortens the time line between the customer order and the product shipment by eliminating waste. Business as Usual Product Shipment Customer Order Waste Time Lean Manufacturing The sooner product ships, the sooner Cedar Works gets paid The faster material moves through the system Less money tied up in inventory in the system Customer Order Product Shipment Waste Time (Shorter)
")
5
APICS Definition of Lean Manufacturing
“A philosophy of production that emphasizes the minimization of the amount of all the resources (including time) used in the various activities of the enterprise. It involves: … identifying and eliminating non-value-adding activities, … employing teams of multi-skilled workers, … using highly flexible, automated machines” American Production and Inventory Control Society (APICS) is an organization for professionals working in the field of Operations Management
 used in the various activities of the enterprise. It involves: … identifying and eliminating non-value-adding activities, … employing teams of multi-skilled workers, … using highly flexible, automated machines American Production and Inventory Control Society (APICS) is an organization for professionals working in the field of Operations Management.")
6
New Paradigm: Non-Blaming Culture
Management creates a culture where: Problems are recognized as opportunities It’s okay to make legitimate mistakes Problems are exposed because of increased trust People are not problems - they are problem solvers Emphasis is placed on finding solutions instead of “who did it” PROBLEMS SOLUTIONS

7
What makes a manufacturing system Lean?

8
What makes a manufacturing system Lean?

9
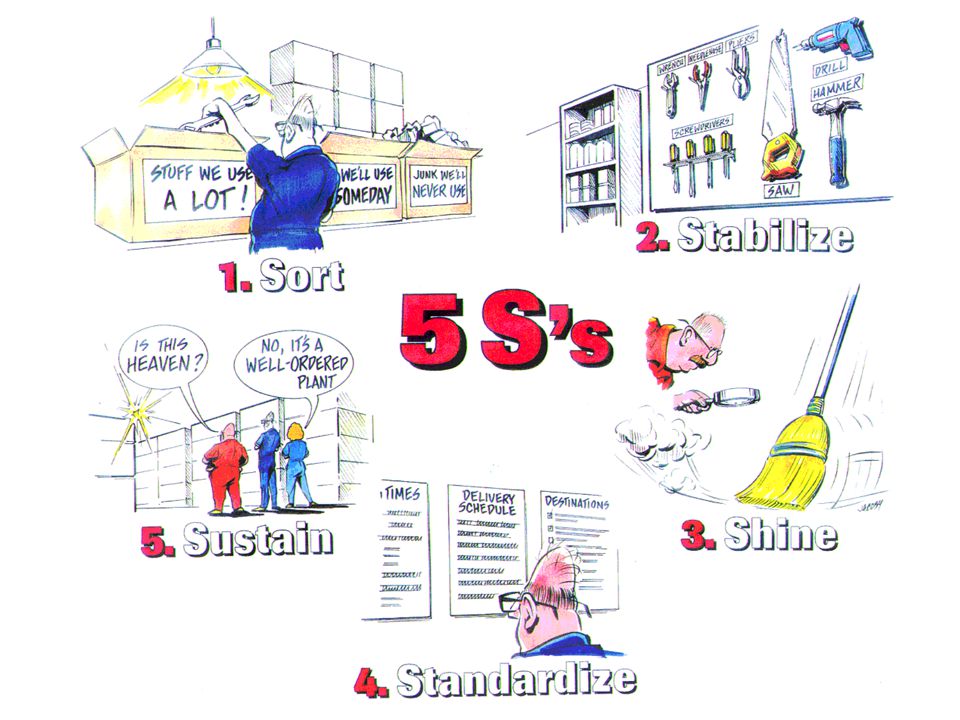
5S Programs Seiri (sort, necessary items)
Seiton (set-in-order, efficient placement) Seison (sweep, cleanliness) Seiketsu (standardize, cont. improvement) Shitsuke (sustain, discipline)
 Seison (sweep, cleanliness) Seiketsu (standardize, cont. improvement) Shitsuke (sustain, discipline)")
10
Visual Factory “Ability to understand the status of a production area in 5 minutes or less by simple observation without use of computers or speaking to anyone.” 5-S 1S Sift and Sort (Organize) 2S Stabilize (Orderliness) 3S Shine (Cleanliness) 4S Standardize (Adherence) 5S Sustain (Self-discipline)
 2S Stabilize (Orderliness) 3S Shine (Cleanliness) 4S Standardize (Adherence) 5S Sustain (Self-discipline)")
12
What makes a manufacturing system Lean?

13
The Pull System

14
Kanban Production Control
At the core of JIT manufacturing at Toyota is Kanban, an amazingly simple system of planning and controlling production Kanban, in Japanese, means card or marquee Kanban is the means of signaling to the upstream workstation that the downstream workstation is ready for the upstream workstation to produce another batch of parts

15
Kanbans and Other Signals
There are two types of Kanban cards: a withdrawal card (W-Kanban) a production card (P-Kanban) Signals come in many forms other than cards, including: an empty crate an empty designated location on the floor
 a production card (P-Kanban) Signals come in many forms other than cards, including: an empty crate. an empty designated location on the floor.")
16
How Kanban Operates When a worker at downstream Work Center #2 needs a
container of parts, she does the following: She takes the W-Kanban from the container she just emptied She finds a full container of the needed part in storage She places the W-Kanban in the full container and removes the P-Kanban from the full container and places it on a post at Work Center #1 She takes the full container of parts with its W-Kanban back to Work Center #2

17
Kanban Cards Withdrawal Kanban Card
Part number to produce: M Part description: Valve Housing Lot size needed: Container type: RED Crate Card number: 2 of Retrieval storage location: NW53D From work center: To work center: 35

18
Kanban Cards Production Kanban Card
Part number to produce: M Part description: Valve Housing Lot size needed: Container type: RED crate Card number: 4 of Completed storage location: NW53D From work center: To work center: 35 Materials required: Material no. 744B Storage location: NW48C Part no. B Storage location: NW47B

19
Flow of Kanban Cards and Containers
P-Kanban and empty container W-Kanban and empty container Full container and P-Kanban Full container and W-Kanban In-process storage Upstream Work Center #1 Downstream Work Center #2 Parts Flow

20
Containers in a Kanban System
Kanban is based on the simple idea of replacement of containers of parts, one at a time. Containers are reserved for specific parts, are purposely kept small, and always contain the same standard number of parts for each part number. At Toyota the containers must not hold more than about 10% of a day’s requirements. There is a minimum of two containers for each part number, one at the upstream “producing” work center and one at the downstream “using” work center.

21
What makes a manufacturing system Lean?

22
Reducing Inventories through Setup Time Reduction
Central to JIT is the reduction of production lot sizes so that inventory levels are reduced. Smaller lot sizes result in more machine setups More machine setups, if they are lengthy, result in: Increased production costs Lost capacity (idle machines during setup) The answer is: REDUCE MACHINE SETUP TIMES
 The answer is: REDUCE MACHINE SETUP TIMES.")
23
SMED-metoden Mät hela omstället och identifiera alla enskilda moment i omstället. Bestäm vilka steg som kan utföras innan- och efter att maskinen måste stannas (ej producerar). Dessa steg benämns externa steg. Minska tiden maskinen måste stå stilla genom att flytta de externa stegen innan- och efter maskinen står stilla. Förbättra verktyg, jiggar detaljer i maskinen samt arbetssätt för att förbättra de steg som bara kan utföras när maskinen står stilla, interna steg. Förbättra de externa stegen. Skriv ned de nya standarderna i arbetsinstruktioner och försäkra att att alla arbetar enligt det nya arbetssättet.
. Dessa steg benämns externa steg. Minska tiden maskinen måste stå stilla genom att flytta de externa stegen innan- och efter maskinen står stilla. Förbättra verktyg, jiggar detaljer i maskinen samt arbetssätt för att förbättra de steg som bara kan utföras när maskinen står stilla, interna steg. Förbättra de externa stegen. Skriv ned de nya standarderna i arbetsinstruktioner och försäkra att att alla arbetar enligt det nya arbetssättet.")
24
What makes a manufacturing system Lean?

25
Effective Facility Layouts
Workstations in close physical proximity to reduce transport & movement Streamlined flow of material Often use: Cellular Manufacturing (instead of process focus) U-shaped lines: (allows material handler to quickly drop off materials & pick up finished work)
 U-shaped lines: (allows material handler to quickly drop off materials & pick up finished work)")
26
Traditional Process Focused Layout
Jumbled flows, long cycles, difficult to schedule

27
JIT Cellular Manufacturing
Product focused cells, flexible equipment, high visibility, easy to schedule, short cycles

28
What makes a manufacturing system Lean?

29
INTRODUCTION Total Productive Maintenance (TPM) is an approach to managing physical assets that emphasizes the importance of operator involvement in making equipment reliable Management has always held an operator accountable for production output. More than ever, that person is also responsible now for product quality Many factors affect how well that can be achieved, including the way in which the workplace is organized as well as the equipment’s effectiveness. When several people are involved, producing quality depends on teamwork
 is an approach to managing physical assets that emphasizes the importance of operator involvement in making equipment reliable. Management has always held an operator accountable for production output. More than ever, that person is also responsible now for product quality. Many factors affect how well that can be achieved, including the way in which the workplace is organized as well as the equipment’s effectiveness. When several people are involved, producing quality depends on teamwork.")
30
In its broadest sense, TPM is based on the idea of autonomous operator maintenance, including three sets of principles. Maintenance Engineering; Seeks to manage the equipment life cycle, from strategic asset planning, through design and construction, to operation, maintenance, and disposal. Several techniques characterize the proactive nature of maintenance engineering including: Preventive (or planned) maintenance: Planned and scheduled maintenance activities to find and correct problems that could lead to failure Predictive and condition-based maintenance: Reducing fixed-time maintenance and relying on the condition of equipment to determine maintenance activity
 maintenance: Planned and scheduled maintenance activities to find and correct problems that could lead to failure. Predictive and condition-based maintenance: Reducing fixed-time maintenance and relying on the condition of equipment to determine maintenance activity.")
31
The prime objectives of TPM are to:
Maximize equipment effectiveness and productivity and eliminate all machine losses Create a sense of ownership in equipment operators through a program of training and involvement Promote continuous improvement through small-group activities involving production, engineering, and maintenance personnel Each enterprise has its own unique definition and vision for TPM, but in most cases there are common elements in any TPM program. These have been summarized in the TPM wheel in Figure 8-1

32
Elements Figure 8-1 The TPM Wheel Themes Training Decentralization
Maintenance prevention Multi-skilling Figure 8-1 The TPM Wheel

33
TPM puts the power in the employee’s hand
TPM puts the power in the employee’s hand. It grants workers autonomy, along with responsibility At the same time TPM recognizes that employees in one area have much to teach and learn from others The entire organization gains strength and ideas from motivated continuous improvement teams A TPM environment encourages a skills between operators and maintenance, and multi-skill training in the various crafts It can provide increase job satisfaction for operations, trades, engineering, and supervision alike

34
Figure 8-4 Tools and Techniques for TPM
For Problem Definition For Solution Development For Team Decision-making Process flowcharting Customer surveys Consequences seeking Histograms Cause and effect diagrams Brainstorming Plan charts Benchmarking Normal group technique Tree diagrams Force field analysis Multivoting Pareto diagrams FMECA Pairwise ranking Statistical process control Fault tree analysis Weighted factor evaluation Scatter plots P-M analysis Failure Analysis Automated Tools Computer aided design and drafting Computer aided manufacturing Computerize maintenance management system Material management system Materials equipment planning Computer integrated manufacturing Simulation Expert systems Geographic information management system Figure 8-4 Tools and Techniques for TPM

35
What makes a manufacturing system Lean?

36
What Is Value? "Value" is what the customer is buying
Always think first about the end-customer Who is the customer? What are they buying? Describe value using the customers' words Specific Example: TCAS (Traffic Collision Avoidance System) Who is the customer? Boeing the pilot maintenance crew consumer flying to business meeting in New York What is the value to the END customer? Collision Avoidance that works all of the time. What is the value to an intermediate customer? E.g. Maintenance crew Collision avoidance that requires little/no repair, easy to maintain.
 Who is the customer Boeing. the pilot. maintenance crew. consumer flying to business meeting in New York. What is the value to the END customer Collision Avoidance that works all of the time. What is the value to an intermediate customer E.g. Maintenance crew. Collision avoidance that requires little/no repair, easy to maintain.")
37
What Is Value Stream Analysis?
Planning tool to optimize results of eliminating waste current state VSM future state VSM Value Stream Mapping & Analysis is a method of creating vision and plans using value stream maps. Value Stream Maps help us: SEE WASTE PLAN ACTION COMMUNICATE Lean Basics = + +

38
Value Steam Mapping Steps
Next Future State Future State 28:00-31:00 Broken into chunks, the value stream mapping process is a series of activities. Those activities are designed to establish an accurate and visual accounting of things as they are now (the current state). Then, using lean tools, you map out the future state. The future state is the to be state that you will drive to make your current state, 6-12 months from now. And finally, you develop a kaizen list of activities needed to make your current state into the future state. As you document the current state, develop the future state, and define the actions needed to make it happen, remember that the value stream map is a visual tool. You want to depict flow, both of product and information, and you also want to show the removal of waste. This path is the outline for managing by value stream. To be able to effectively manage this way, our maps have to be accurate, usable, and measurable. Current State Original State
. Then, using lean tools, you map out the future state. The future state is the to be state that you will drive to make your current state, 6-12 months from now. And finally, you develop a kaizen list of activities needed to make your current state into the future state. As you document the current state, develop the future state, and define the actions needed to make it happen, remember that the value stream map is a visual tool. You want to depict flow, both of product and information, and you also want to show the removal of waste. This path is the outline for managing by value stream. To be able to effectively manage this way, our maps have to be accurate, usable, and measurable. Current State. Original State.")
39
Value Stream Scope Extended Value Stream Multi-plant/Multi-company
Concept Launch Order Delivery In-use Recycle Multi-plant/Multi-company Action 31: :00 Let’s talk about levels of value stream? Make sure you understand the concept of high level vs deep dive mapping. If you study learning to see, and seeing the whole, you will notice that value stream maps can be done for every level. You can do one at 50,000 feet that describes the flow of product and information across the whole enterprise. Or you can do one that shows the sectional flow for a particular plant, or engineering. You can even get detailed enough to follow the flow for production of a specific product, or report in an office environment. That is one of the major functional attributes of using value stream maps. You can tailor them to the level of detail you need to communicate your flows, waste, and desired future states. It is also one of the primary reasons we need to use standard icons for maps, as we change levels of detail, we need consistent communication. Most high level value streams depict flow in too general a method to specifically target waste. To be able to identify the sources of waste, you have to do a deep dive vsm. A deep dive vsm is when you focus on a particular section of the larger vsm and map it in greater detail. The process is the same, current state, followed by future state with an action plan. But by focusing on a smaller section of the map you can easily identify specific actions to remove waste. Care must be taken to make sure you are not optimizing one section of the larger map at the expense of overall product and information flow. This is a coordination effort that managing by value streams requires. Continuously, leadership must have their eye on the overall picture of flow and be trying to make improvements at a more detailed level. Plant Action Action Action Action

40
Apply Five Simple Principles:
Specify value from the standpoint of end customer Identify the value stream for each product family Make the product flow So the customer can pull As you manage toward perfection Perfection PULL FLOW VALUE STREAM VALUE Lean Principles in VSM 36:00-40:00 To fit VSM into the overall structure of lean, you look to map the flow of value. That value is specified by the end customer. That is the hard decision point for whether or not something is value added. The result is that most of what you do will be declared waste, although it may be of value to interim customers within your particular flow. The VSM shows how customer value moves through your enterprise. The path is called a stream. The products, services, information, or whatever it is you do for the customer, flows through that stream. Within the stream are impediments to that flow. These are the waste components the VSM makes visual. The future state describes changes you will make to the stream so that the customer can pull their value through the stream with fewer impediments. Again, the impediments are described in the language of quality, cost, and time. You repeat the process of cleaning up the stream over and over as you identify further impediments, striving for a stream with perfect flow.

41
What is the Value that Flows?
Specify value from the standpoint of the end customer Ask how your current products and processes disappoint your customer’s value expectation: price? quality? reliable delivery? rapid response to changing needs? ??? flow product/information 40:00-43:00 Make sure that you capture information as well as product flow. Both are equally important in making improvements and removing waste. Quite often the sources of the waste are in the information flow. make it visual 43:00-45:00 Remember, the art of value stream mapping lies in making the flow and the waste clearly visual to any person observing the map. must haves: There are some must haves in terms of making the value stream mapping effort worth the effort

42
What Flows? In manufacturing, materials are the items
"ITEMS" flow through a value stream In manufacturing, materials are the items In design & development, designs are the items In service, external customer needs are the items In admin., Internal customer needs are the items Analysis begins with part of a total value stream, That part of the value stream has customers too

43
Material Flow Icons FIFO Outside Sources Manufacturing Process
Data Box C/T = 45 sec. C/O = 30 min. 3 Shifts 2% Scrap Manufacturing Process ASSEMBLY Outside Sources XYZ Corporation Buffer or Safety Stock Supermarket Truck Shipment Mon. + Wed. 300 pieces 1 Day Inventory Finished Goods to Customer First-In-First-Out Sequence Flow FIFO max. 20 pieces Physical Pull/Withdrawal use the icons 50:00-56:00 Let me repeat, use the icons. Why have we never adopted the discipline of using the icons to map our flows? Because what we understand are process maps. Process maps are not value stream maps, they are totally different, in concept, use, and usability. Value stream maps map the flow of value, and record the impediments to that flow. That is the difference between VSM and process maps. Process maps just show the process as it is. VSM is designed to highlight issues and suggest improvements Here are some icons we use to illustrate flow of material. Describe process-----supermarket-----answer questions The icons allow us to standardize our maps. This is critical since those maps will be a real time working tool and our method of communication for flow, improvements, and status in the future. The maps need to be understood by everyone in the area and everyone visiting the area from elsewhere PUSH Arrow

44
Information Flow Icons
Sequenced-Pull Ball Signal Kanban Load Leveling Box Electronic Information Flow Manual Information Flow “Go See” Production Scheduling Kanban Post Schedule Weekly Schedule Withdrawal Kanban Production Kanban General Icons 56: :00 Equally important, if not more so, is the flow of information. This area is one where Rockwell maps in the past have been deficient. Take the time to familiarize yourself with these icons and make sure you use them to capture information flows. (Talk about manual----electric----kanban) Kaizen Lightening Burst UPTIME CHANGEOVER Operator
 Kaizen Lightening Burst. UPTIME. CHANGEOVER. Operator.")
45
TAKT TIME Effective Working Time per Shift Customer Requirement per Shift Takt Time = 59: :00 A fundamental piece of flow is the rate of that flow. A measure at the core of flow is takt time. Simply stated it is the heartbeat of flow or the rate at which product is produced or the time available per unit. The actual measure is time available divided by quantity needed. The practical use of takt time is having people understand how often and when product should be advancing. When those times are missed it clues people into needing to look immediately for the problem or source of the extra time. It keeps people focused and provides a pace or cadence. People will learn the cadence and become familiar with it, and will respond when it is broken. Synchronizes pace, evenly applying customer demand across the work day. Takt Time is "Beat Time"? "Rate Time" or “Heart Beat" Lean Production uses Takt Time as the rate or time that a completed product is finished. If you have a Takt Time of two minutes that means every two minutes a complete product, assembly or machine is produced off the line. (

46
Implementing lean

47
Benefits of Lean Manufacturing
% Waste reduction WIP Inventory Space Personnel Product lead times Travel Quality, costs, delivery

48
Setting the Foundation
Evaluating your organization Management culture Manufacturing culture Lean Manufacturing Analysis Value stream (from customer prospective) Headcount WIP Inventory Capacity, new business, supply chain
 Headcount. WIP. Inventory. Capacity, new business, supply chain.")
49
Tools of Lean Mfg/Production
Waste reduction Full involvement, training, learning Cellular mfg Flexible mfg Kaikaku (radical change) Kaizen (continuous improvement) & standard work 5S Jidoka (autonomation) Poka-yoke (visual signals) Shojinka (dynamic optimization of # of workers) Teien systems (worker suggestions)
 Kaizen (continuous improvement) & standard work. 5S. Jidoka (autonomation) Poka-yoke (visual signals) Shojinka (dynamic optimization of # of workers) Teien systems (worker suggestions)")
50
Tools (cont.) Continuous Flow (10% - 25%) SMED (Shingo) Andon
Takt time Line balancing Nagara (smooth production flow)
")
51
Tools (cont.) Customer pull (10%- 25%) Just-in-time Kanban
 Customer pull (10%- 25%) Just-in-time Kanban")
52
Henry Ford - Standards “To standardize a method is to choose out of the many methods the best one, and use it. Standardization means nothing unless it means standardizing upward. Today’s standardization, instead of being a barricade against improvement, is the necessary foundation on which tomorrow’s improvement will be based. If you think of “standardization” as the best that you know today, but which is to be improved tomorrow - you get somewhere. But if you think of standards as confining, then progress stops.” Henry Ford, 1926 Today & Tomorrow

53
Standardized Work Captures best practices Posted at the work station
Visual aid Reference document work sequence job layout time elements safety Developed with operators Basis for Continuous Improvement Show sample Standardized Work from Cedar Works Bring training manual

54
Other Tools Visual Factory Error Proofing Quick Change-over
Total Productive Maintenance

55
What makes a manufacturing system Lean?

Similar presentations


: an older name for lean systems Toyota Production System (TPS): another name for lean systems, specifically as.>")


