Download presentation
Presentation is loading. Please wait.

1
Chapter 3: Transformations of Graphs and Data
Lesson 5: The Graph Scale-Change Theorem Mrs. Parziale

2
Vocabulary: Vertical stretch: A scale change that makes the original graph taller or shorter Horizontal stretch: a scale change that makes the original graph wider or skinnier. Scale change: a stretch or shrink applied to the graph vertically or horizontally Vertical scale change: The value that changes the vertical values of the graph. Horizontal scale change: The value that changes the horizontal values of the graph. Size change: When the same vertical and horizontal scale change occurs.

3
Example 1: Consider the graph of (a) Complete the table and graph on the grid: x y -2 -1 1 2
 Complete the table and graph on the grid: x y")
4
(b) Replace (y) with 1. Solve the new equation for y and graph it on the same grid at right. 2. What happens to the y-coordinates? 3. This is called a vertical stretch of magnitude 3 . 4. Under what scale change is the new figure a vertical scale change of the original?

5
(c) Replace (x) with 1. Solve the new equation for y and graph it. 2. What happens to the x-coordinates? This is called a horizontal stretch of magnitude 2 . Under what scale change is the new figure a horizontal scale change of the original?

6
(d) Let . Find an equation for g(x), the image of f(x) under What is happening to each part of the graph?
, the image of f(x) under What is happening to each part of the graph.")
7
How is the x changed? Change: horizontal stretch two times wider. How is the y changed? Change: vertical stretch three times the original.

8
Graph Scale-Change Theorem
In a relation described by a sentence in (x) and (y), the following two processes yield the same graph: (1) replace (x) by and (y) by in the sentence (2) apply the scale change __________________ to the graph of the original relation. Note: If a = b, then you have performed a __________ size change If a = negative, the graph has been reflected (flipped) over the y-axis If b = negative, the graph has been reflected over the x-axis
 and (y), the following two processes yield the same graph: (1) replace (x) by and (y) by in the sentence. (2) apply the scale change __________________ to the graph of the original relation. Note: If a = b, then you have performed a __________. size change. If a = negative, the graph has been reflected (flipped) over the y-axis. If b = negative, the graph has been reflected over the x-axis.")
9
So, What’s the Equation? (d) Find an equation for g(x), the image of f(x) under x y -2 -1 3 1 -3 2 x y

11
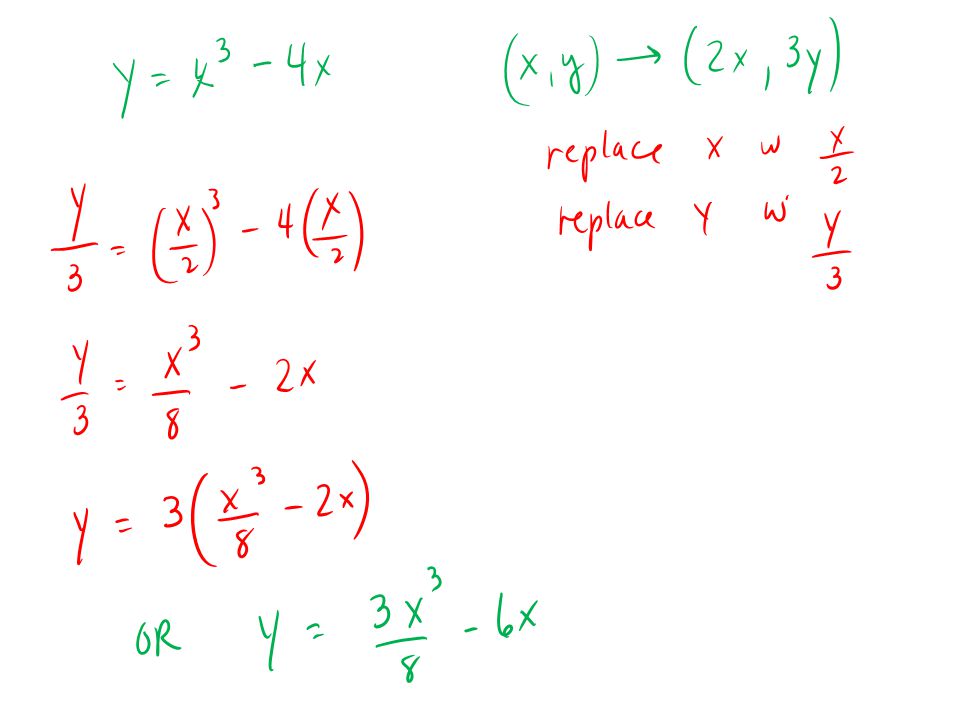
Example 2: Consider . Find an equation for the function under
Describe what happens to all of the x values: Describe what happens to all of the y values:

12
Find the equation for the transformed image by
Replace (x) with ______________ Replace (y) with ______________ Now make the new equation (remember to simplify to y= form):
 with ______________. Replace (y) with ______________. Now make the new equation (remember to simplify to y= form):")
13
Graph It!

14
Closure - Example 3: The graph to the right is y = f(x). Draw .
What should happen to all of the x values? What should happen to all of the y values?

Similar presentations


 to f(x)>")
 + k appears.>")


 A vertical translation is made on a function by adding or subtracting a number to the function.>")


,>")

