Download presentation
Presentation is loading. Please wait.

1
A Model for the Trophic Pyramid

2
Food Chains and Food Webs
Day 1 Food Chains and Food Webs

3
You will be given 16 organisms
Cut out the 16 cards Sort into pile A and pile B Arrange the 3 cards in pile A into a food chain.

4
Share Out What are some “rules” you used to organize your food chain?
1. 2. 3. 4. Agreed upon Vocabulary: 1. 2. 3. 4. 5.

5
Do you need to make any modifications to the chain you created?
Now you will be given more organisms to add to your chain. Create a food web by making a connections between the organisms. When you feel you are “done”, glue the organisms down on your poster. Label your web with the agreed upon vocabulary words.

6
Share Out Gallery walk: Take a two minutes to view all of the webs created and answer the following in a post-it about one of them. Write 2 things you liked about the web Write 1 thing that could be improved Write 1 question you have about the food web Copy your web into your notebook (use names only, no pictures!) –page 97 What patterns do you notice about how the organisms are connected? 1. 2.
 –page 97. What patterns do you notice about how the organisms are connected")
7
Create a Venn Diagram Food Chain Food Web

8
Let’s Eat! Read the article and complete the following four square in your notebook: 1. Why do we eat? 2. Using the food web in your handout, draw a food chain using six organisms. 3. What group of organisms are missing from our food webs ? 4. Pick one drawing that stood out to you and explain why.

11
Pyramid of Numbers and the Bucket Brigade
Day 2 Pyramid of Numbers and the Bucket Brigade

12
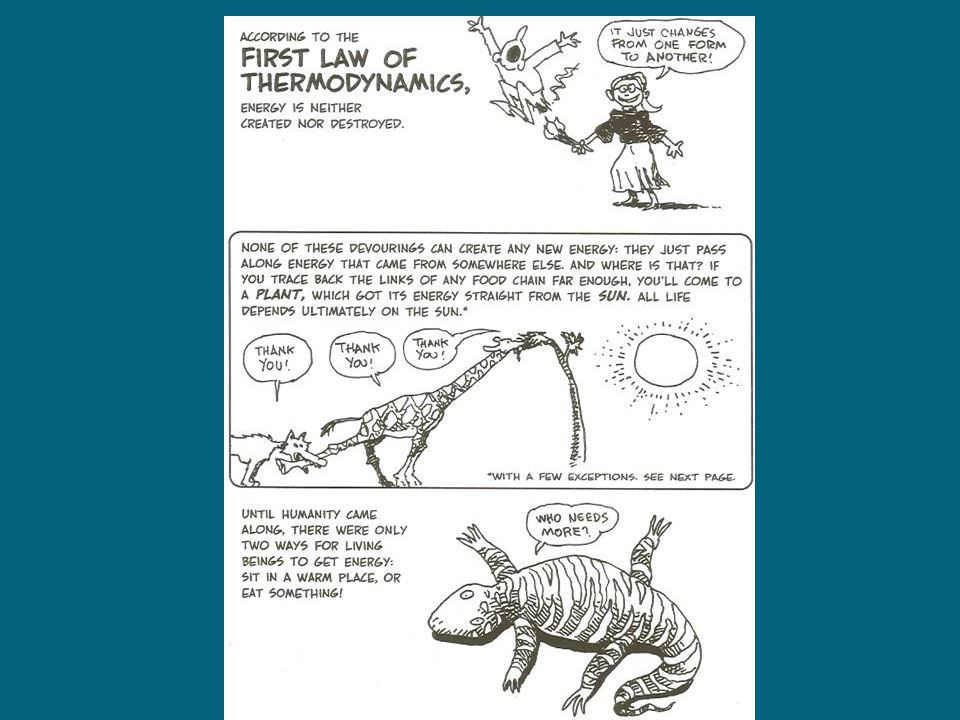
Numbers Pyramid 100 rabbits 5000 dandelions 1 fox
Examine the picture to the right. It is a pyramid of numbers What do you notice about the picture? Write these down in your notebook 1. 2. 3. 4. 1 fox 100 rabbits 5000 dandelions

13
Now try Sample #2. What is unusual about this picture?
Explain why this would occur (in your notebook.) 500 Fleas 1 Fox 100 Rabbits 5000 dandelions
 500 Fleas. 1 Fox. 100 Rabbits dandelions.")
14
Sample #3 What is unusual about this picture?
Explain why this would occur (in your notebook.) 1 bird 1000 ladybugs 2000 aphids 1 dandelion
 1 bird ladybugs aphids. 1 dandelion.")
15
Bucket Brigade Relay Your group will be given 5 bottles.
Person #1 will fill up the bottle and cover the hole at the bottom. Person #1 must transfer their water into bottle #2 (with the hole UNCOVERED!). Person #2, 3, and 4 cannot ever cover the hole in their bottle! Continue transferring water until you reach the end The group who finishes the first is the winner.
. Person #2, 3, and 4 cannot ever cover the hole in their bottle! Continue transferring water until you reach the end. The group who finishes the first is the winner.")
16
How did you do? Measure the amount of water that made it to bottle #5.
In your notebook draw pictures of each bottle and show the approximate amount of water transferred . Record your starting and final volume.

17
Answer the following on your whiteboard (pictures help!)
Why did you end up with so little water in bottle #5? How could you ever get bottle #5 full?

18
Exit Questions: What happened to the water? (started with a full bottle but ended up with a partial bottle) How does this relate to the numbers pyramid we were looking at earlier? What does the water represent?

19
Calories and Human Consumption
Day 3 Calories and Human Consumption

24
Review of Day 2 Read the handout and answer the following:
Numbers pyramids sometimes look wrong, do you think a biomass or an energy pyramid would be a better representation of what happened in the bucket brigade? The water in the bucket brigade was supposed to represent ___________?

25
How we can measure energy….
The water was to represent the energy transferred from one level of the pyramid to the next. Watch Demo…. A Calorie is the amount of energy needed to heat one Liter of water 1 degree Celsius.

26
Billy Bob, a sixteen year old, ate 2900 Calories each day for one month. (The average person eats between 1500 and 2500 Calories per day). During that time, he grew 2 inches and gained 4 pounds. Make a list of what Billy Bob used those Calories for.

27
Use your list to fill in the following T-chart: Consumed energy
(energy turned into ____) Stored energy (energy stored as____)
 Stored energy. (energy stored as____)")
28
Exit Question: Explain why you can eat 100 pounds of cheese in one week but yet you only gain 3 pounds.

29
Day 4 Efficiency (10% rule)
")
31
Opening question Read the short article on your handout.
As a group answer the following: What is the percent “efficiency of organisms”? Why? Let’s find out with an example from the ocean!

32
In a cubic acre of ocean has 1,000,000 Calories of plankton.
Only 110,542 plankton Calories are passed on to sardines. Why? What percentage of the Calories is actually passed on?

33
Out of the 110,542 Calories eaten, only 9,998 sardine Calories are passed on to Salmon. Why?
What percentage of the Calories is actually passed on?

34
Out of the 9,998 Calories eaten, only 1,050 salmon Calories are passed on to seals. Why?
What percentage of the Calories is actually passed on?

35
Out of the 1,050 Calories eaten, only 120 seal Calories are passed on to orcas. Why?
What percentage of the Calories is actually passed on?

36
Our Average What is the average energy transfer?
Why is there less energy passed on you move through a food chain?

37
This can be represented in an Energy Pyramid. (these never look wrong
Orca = 120Cal Seal = 1050 Cal Salmon = 9998 Cal Sardine = 110,542Cal Plankton 1,000,000 Cal

38
The next activity requires groups of four-
In your group figure whose birth month is closest to January. This is person #1. The next closest is person #2….continue for the whole group. #1 is a grass (producer) #2 is a rabbit (primary consumer) #3 is a coyote (secondary consumer) #4 is a mountain lion (tertiary consumer)
 #2 is a rabbit (primary consumer) #3 is a coyote (secondary consumer) #4 is a mountain lion (tertiary consumer)")
39
How much is 10%? Person #1 will be given 10,000 squares.
Pass on 10% of those square to person #2. Person #2 will pass 10% of their squares to person #3. Person #3 will pass on 10% of their squares to person #4. ‘ How many squares did person #4 end up with? Record how many squares each person received in your notebook. Tape or glue your squares in your notebook.

40
Now grab your white board and explain how many squares you passed to each level
#1 (producer) had 10,000 squares #2 (herbivore) received ____ squares #3 (primary carnivore ) received ___squares #4 (secondary carnivore ) received ___ sqs.
 had 10,000 squares. #2 (herbivore) received ____ squares. #3 (primary carnivore ) received ___squares. #4 (secondary carnivore ) received ___ sqs.")
41
Bucket Brigade revisited
With a partners answer the following on your in your notebook. If we want to end up with 100mL of water in bottle #5, how much water do we need to start with (assume only 10% makes it to the next bottle in each transfer)?
")
42
Summarize model and 4 question share out
Day 5 Summarize model and 4 question share out

43
Driving Question: How is Energy transferred in an ecosystem?
Observation #1: Organisms can be organized according to who-eat-who (plants at the bottom, then herbivores, etc) evidence: food chains + food webs Observation #2: Bigger eats smaller evidence: food chains + food webs Observation #3: Energy gets passed from one level to the next evidence: “Let’s Eat” reading Observation #4: Energy is lost at each transfer evidence: bucket brigade Inference: Lost energy goes to living –breathing, moving, staying alive! Evidence: Billy Bob and gummy bears Observation #5: Roughly, only 10% of energy is available for next level of consumers to use evidence: 10,000 squares + ocean food chain Inference: Ultimate source of energy is SUN
 evidence: food chains + food webs. Observation #2: Bigger eats smaller evidence: food chains + food webs. Observation #3: Energy gets passed from one level to the next evidence: Let’s Eat reading. Observation #4: Energy is lost at each transfer evidence: bucket brigade. Inference: Lost energy goes to living –breathing, moving, staying alive! Evidence: Billy Bob and gummy bears. Observation #5: Roughly, only 10% of energy is available for next level of consumers to use evidence: 10,000 squares + ocean food chain. Inference: Ultimate source of energy is SUN.")
44
4 question jigsaw Form a group of four and assign each member a number from 1 to 4 All the #1’s must meet and work on one jigsaw question…. Each member must be prepared to FULLY explain the answer back to their original group. Be sure to relate your answer to each of our activities so far (food web poster, bucket brigade, 10,000 squares, and Billy Bob) Record your answer on your whiteboard and then in your notebook.
 Record your answer on your whiteboard and then in your notebook.")
45
1. Why will an acre of corn feed more vegetarians than carnivores?
A single beef cow needs 5.75 acres of land to grow feed and live = 1,000 servings of beef 5.75 acres of soybean = 26,000 servings of tofu. 1 acre of Soybeans = 29,000,000 Calories 1 acre for a Cow = 888,000 Calories 2. A mountain lion weighs 150 lbs. Over the course of a month it eats 215 lbs of meat in the form of a deer, three jack rabbits, and a jogger . At the end of the month he weighs 151 lbs. Why doesn’t it weigh more? 3. Diagram a food chain with four levels (producer = grass). How much energy from grass is passed on to a primary consumer that eats the grass versus the tertiary consumer of the same food chain? Show your calculations. 4. Why are there so few lions versus so many wildebeests in the Africa?
. How much energy from grass is passed on to a primary consumer that eats the grass versus the tertiary consumer of the same food chain Show your calculations. 4. Why are there so few lions versus so many wildebeests in the Africa")
46
Reorganize back into your original group of four .
Take turns sharing your question and your answer. Record the answers of all the questions in your notebook

47
Justify your answer using activities from the last two weeks:
Final Question! Thinking about the model we have been developing, is it more efficient in terms of energy to raise 1,000 lbs of cattle or 1,000 lbs of salmon (farmed)? Justify your answer using activities from the last two weeks: Food Chains/Webs Bucket Brigade Billy Bob 10,000 squares
 Justify your answer using activities from the last two weeks: Food Chains/Webs. Bucket Brigade. Billy Bob. 10,000 squares.")
48
Write your group’s rules in your notebook
Add any rules you did not think of that were shared by other groups. Read the handout. Add any other rules that you missed.

49
What are the “rules” for eating?
Food Chains 1. 2. Food Webs Energy Pyramids Efficiency

50
What is our model? All energy comes from the sun. The activity we did to support this is: In a food chain it is all about what you eat (not biggest to smallest). The activity we did to support this is: With each transfer along a food chain, energy is lost and only a small part is passed on. The activity we did to support this is:
. The activity we did to support this is: With each transfer along a food chain, energy is lost and only a small part is passed on. The activity we did to support this is:")
Similar presentations


>")


 and eats all the mountain lions. What happens to the elk population?>")


>")