Download presentation
Presentation is loading. Please wait.

1
Chapter 13 Economic Challenges

2
Determining the Unemployment Rate
A nation’s unemployment rate is an important indicator of the health of the economy. The Bureau of Labor Statistics polls a sample of the population to determine how many people are employed and unemployed. The unemployment rate is the percentage of the nation’s labor force that is unemployed. The unemployment rate is only a national average. It does not reflect regional economic trends.

4
Unemployment Unemployment: Some types have more serious consequences for the economy and the workers than others.

5
Types of Unemployment Frictional Unemployment
Occurs when people change jobs, get laid off from their current jobs, take some time to find the right job after they finish their schooling, or take time off from working for a variety of other reasons Structural Unemployment Occurs when workers' skills do not match the jobs that are available. Technological advances are one cause of structural unemployment Seasonal Unemployment Occurs when industries slow or shut down for a season or make seasonal shifts in their production schedules Cyclical Unemployment Unemployment that rises during economic downturns and falls when the economy improves

6
Full Employment Economists generally agree that in an economy that is working properly, an unemployment rate of around 4 to 6 percent is normal. Sometimes people are underemployed, that is working a job for which they are over-qualified, or working part-time when they desire full-time work. Discouraged workers are people who want a job, but have given up looking for one. Full employment is the level of employment reached when there is no cyclical unemployment.

8
Unemployment by Gender and Race
Dec. 2004 May 2005 Adult Men 4.9 4.4 Adult Women 4.7 4.6 Caucasians Asians 4.1 3.9 Hispanics 6.6 6.0 African Am. 10.8 10.1 Teens 17.6 17.9 Unemployment by Gender and Race

9
Inflation Aggregate means total
Aggregate Supply & Aggregate Demand Aggregate means total Aggregate Supply- total goods and services produced throughout the economy. Aggregate Demand- total amount of spending throughout the economy. Inflation

10
The Effects of Rising Prices
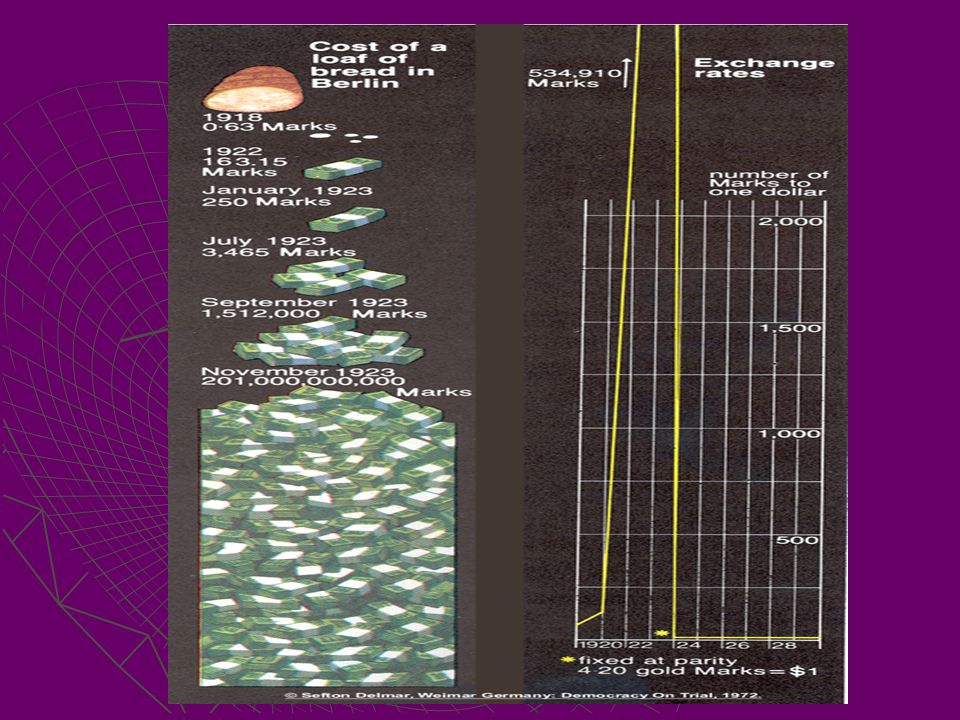
Inflation is a general increase in prices. Purchasing power, the ability to purchase goods and services, is decreased by rising prices. Price level is the relative cost of goods and services in the entire economy at a given point in time.

11
Calculating Inflation
To determine the inflation rate from one year to the next, use the following steps.

12
Causes of Inflation The Cost-Push Theory
According to the cost-push theory, inflation occurs when producers raise prices in order to meet increased costs. The Demand-Pull Theory The demand-pull theory states that inflation occurs when demand for goods and services exceeds existing supplies.

13
Types of inflation Inflation- Usually when aggregate demand increases faster than aggregate supply. An increase in overall prices. Results from: rising wages, an increased money supply, and increased spending relative to the supply of products. Deflation- when aggregate demand decreases more rapidly than aggregate supply. So sellers are forced to lower prices to attract buyers.

15
Measuring Inflation Cont.
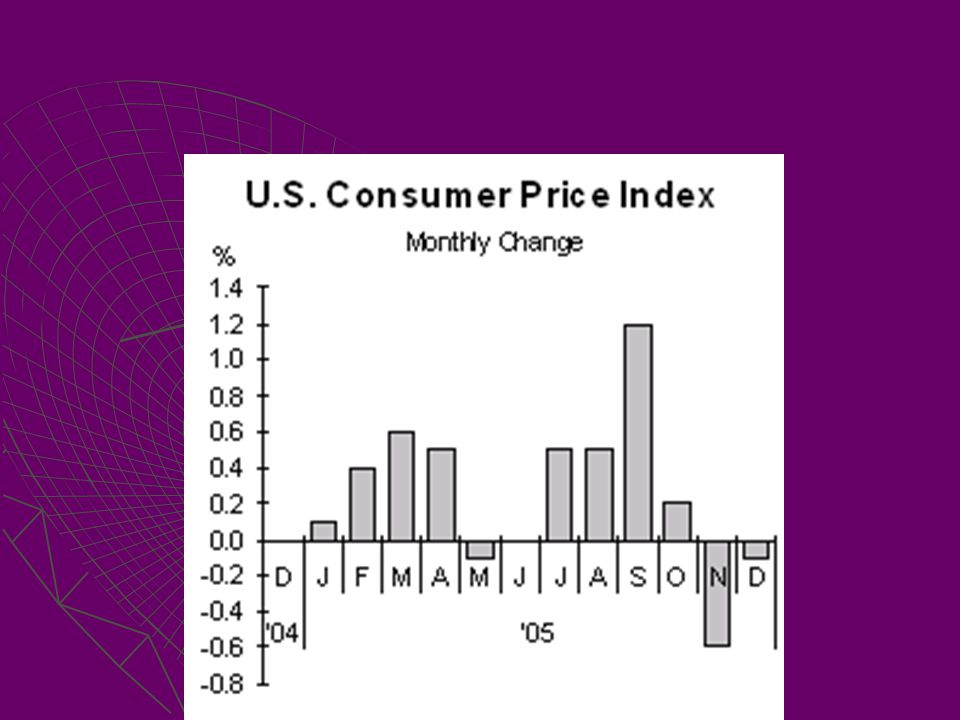
Consumer Price Index is one of the most common price indexes. CPI uses a typical set of household items purchased by urban households for their own consumption.

18
Effects of Inflation Decreased Purchasing Power
Decreased Value of Real Wages Increased Interest Rates Decreased Saving and Investing Increased Production Costs

19
Costs of Inflation Shoe-leather cost: people hold less cash on hand b/c it loses value, therefore they must make frequent trips to the bank. Menu cost: if inflation happens owners of a restaurant must reprint menus more frequently

20
H. Aggregate Supply & Demand Scenarios
For each of the following aggregate demand & supply scenarios draw an AS & AD graph and show what would happen to either the supply or demand. Then complete the statement describing what would happen.

21
1.What will happen if consumers expect a recession?
If consumer expect a recession then they will _________ ____________today as to "save for a rainy day". Thus if spending has _________, then our aggregate demand must _______. An aggregate demand decrease is shown as a shift to the _____ of the aggregate demand curve. This will cause both Real GDP to ________ as well as the price level. So, expectations of future recessions act to ______ economic growth and can cause _________.

22
1.What will happen if consumers expect a recession?
If consumer expect a recession then they will not spend as much money today as to "save for a rainy day". Thus if spending has decreased, then our aggregate demand must decrease. An aggregate demand decrease is shown as a shift to the left of the aggregate demand curve. This will cause both Real GDP to decrease as well as the price level. So, expectations of future recessions act to lower economic growth and can cause deflation.

23
2.What will happen if foreign incomes rise?
If foreign income rises, then we would expect that foreigners would ________ money - both in their home country and in ours. Thus, we should see a ____ in foreign spending and exports, which raises the _______________ curve. This shift in the aggregate demand curve will cause Real GDP to _____ as well as the price level.

24
2.What will happen if foreign incomes rise?
If foreign income rises, then we would expect that foreigners would spend more money - both in their home country and in ours. Thus, we should see a rise in foreign spending and exports, which raises the aggregate demand curve. This shift in the aggregate demand curve will cause Real GDP to rise as well as the price level.

25
3. What will happen if Government spending increases?
An increase in government spending causes an ________ in aggregate demand, as the government is now demanding more goods and services. So we should see Real GDP ____ as well as the price level.

26
3. What will happen if Government spending increases?
An increase in government spending causes an increase in aggregate demand, as the government is now demanding more goods and services. So we should see Real GDP rise as well as the price level.

27
4. What will happen if workers expect future inflation and ask for higher wages?
If the cost of hiring workers has gone up, then companies will not want to hire as many workers. Thus we should expect to see the _______________ shrink, which is shown as a shift ________. When the aggregate supply gets smaller, we see a ________ in Real GDP as well as an ______ in the price level. This can be self-fulfilling.

28
4. What will happen if workers expect future inflation and ask for higher wages?
If the cost of hiring workers has gone up, then companies will not want to hire as many workers. Thus we should expect to see the aggregate supply shrink, which is shown as a shift to the left. When the aggregate supply gets smaller, we see a reduction in Real GDP as well as an increase in the price level. This can be self-fulfilling.

29
5. What will happen if foreign price level fall?
If foreign price levels fall, then foreign goods become cheaper. We should expect that consumers in our country are now more likely to buy foreign goods and less likely to buy domestic made products. Thus the aggregate demand curve must fall, which is shown as a shift to the left. A fall in foreign price levels also causes a fall in domestic price levels as well as a fall in Real GDP.

30
5. What will happen if foreign price level fall?
If foreign price levels fall, then foreign goods become cheaper. We should expect that consumers in our country are now more likely to buy foreign goods and less likely to buy domestic made products. Thus the aggregate demand curve must fall, which is shown as a shift to the left. A fall in foreign price levels also causes a fall in domestic price levels as well as a fall in Real GDP.

32
11.3 Poverty and Income Distribution
Poverty Line: This is a measure of the level of income necessary to subsist in a society. Dependent on the cost of living and peoples' expectations. Usually defined by governments and calculated as that level of income at which a household will devote two-thirds (to three-quarters) of its income to basic necessities such as food, water, shelter, and clothing Number of Persons in Household 48 states 1 9,800 2 13,200 3 16,600 4 20,000 5 23,400 6 26,800 7 30,200 8 33,600 Add’l add 3,400
 of its income to basic necessities such as food, water, shelter, and clothing. Number of Persons in Household. 48 states. 1. 9, , , , , , , ,600. Add’l add. 3,400.")
33
Income Distribution

34
Education and Income

36
World Map Scaled by Population

37
2005 Nominal GDP in billions

38
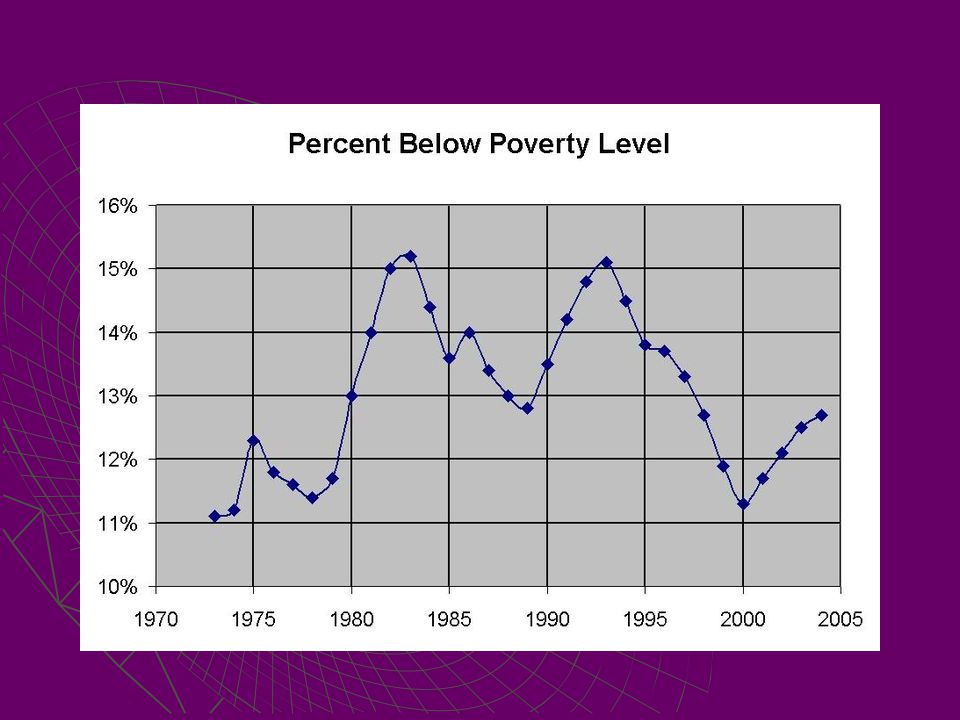
Percentage of People in Poverty

39
Percentage of people living on less than $1 a day

40
Economic Measurements
GDP Per capita GDP GDP growth rate CPI The rate of inflation. The standard of living. Economic expansion or contraction. Output of goods and services of an economy.

Similar presentations


 File open Type in categories by clicking on the text box Use the.>")


