Download presentation
Presentation is loading. Please wait.

1
Members of The Pathways from Poverty Consortium
Unpacking Poverty and Its Impact on Student Success: Colloquium II Concentrated Neighborhood Poverty Tuesday, March 10, 2015 Members of The Pathways from Poverty Consortium Robert Balfanz, Ph.D., Research Scientist, Co-Director, Center for Social Organization of Schools (CSOS) Maxine Wood, Ed.D, Director/Senior Advisor, Pathways from Poverty Richard Lofton, Ph.D. Post-doctoral fellow Daniel Princiotta, Ph.D. candidate Presented at the Colloquium II on Unpacking Poverty and Its Impact on Student Success, organized by the Pathways from Poverty Consortium -- Baltimore, MD
 Maxine Wood, Ed.D, Director/Senior Advisor, Pathways from Poverty. Richard Lofton, Ph.D. Post-doctoral fellow. Daniel Princiotta, Ph.D. candidate. Presented at the Colloquium II on Unpacking Poverty and Its Impact on Student Success, organized by the Pathways from Poverty Consortium -- Baltimore, MD.")
2
Overview of Presentation- A Three-Act Play with a Prelude
Prelude - Defining Poverty at Individual and Neighborhood Levels Act 1 - What is Concentrated Poverty, Who Experiences it and Where is it Found? Act 2 - How Does Concentrated Poverty Impact Student Success and Which Districts and Schools Face the Biggest Challenges? Act 3 - What Do We Know About Solutions at the School and Neighborhood Levels?

3
Prelude: Thinking About How We Define Poverty and How This Informs Our Perceptions and Actions

4
Poverty can be both an individual/family experience and a group/neighborhood experience

5
Poverty at individual/family level
means not having enough money to provide/acquire the basics (food, shelter, clothing, heat, medicine, etc.) and/or to live in a safe and healthy environment.
 and/or to live in a safe and healthy environment.")
6
Poverty at Group/Neighborhood Level
means living in areas where many other people are poor as well, or, as the census defines it, in ‘a spatial density of socio-economic deprivation’.

7
Poverty and Low Income are not the same thing, though in the media, policy reports, and daily conversation they are often used interchangeably. *See handout for example

8
Defining Economic Hardship
Federal/Census Definitions of Individual/Family Economic Hardship Low-income: Less than 200% of the Federal Poverty Level (Household of 4 is $48,500 or below) Poverty: Less than 100% of the Federal Poverty Level (Household of 4 is $24,250 or below) Extreme Poverty: Less than 50% of the Federal Poverty Level (Household of 4 is $12,125 or below) U.S. Department of Health & Human Services, 2015
 Poverty: Less than 100% of the Federal Poverty Level. (Household of 4 is $24,250 or below) Extreme Poverty: Less than 50% of the Federal Poverty Level (Household of 4 is $12,125 or below) U.S. Department of Health & Human Services,")
9
How Many People and Children Experience Economic Hardship?
Economic Hardship Status (Percent of Poverty Level) Total Persons Who Experience in US Income Range for Family of Four Total Number and Percent of All Children Who Experience in US Low Income (100%-199% ) 60 million $24,251- $48,500 16 Million (22%) Poverty (50% to 99%) 25.6 million $12,125- $24,250 8.6 Million (12%) Extreme Poverty (< 50%) 20.4 million 0$- $12,125 7.2 Million (10%) Total All Economic Hardship Status 106 million 31.8 Million (44%)
 Total Persons Who Experience in US. Income Range for Family of Four. Total Number and Percent of All Children Who Experience in US. Low Income. (100%-199% ) 60 million. $24,251- $48, Million (22%) Poverty. (50% to 99%) 25.6 million. $12,125- $24, Million (12%) Extreme Poverty. (< 50%) 20.4 million. 0$- $12, Million (10%) Total All Economic Hardship Status. 106 million Million (44%)")
10
Percentage of Children in Low-Income and Poor Families by Race/Ethnicity

11
Defining Economic Hardship In Schools
Free and Reduced Lunch Income Eligibility 1 Free Meals--at or below 130% of the federal poverty level (A household of 4 annual income is $30,615 or below) Reduced Price Meals-up to 185% of federal poverty level (A household of 4 annual income is $44,123) 1 Federal Register, 2014: Effective from July 1, 2014-June 30, 2015
 Reduced Price Meals-up to 185% of federal poverty level (A household of 4 annual income is $44,123) 1 Federal Register, 2014: Effective from July 1, 2014-June 30,")
12
Thus, when school free and reduced price lunch levels are used as a measure of “poverty,” it combines students who live in poverty with a sub-set of low-income students

13
This means that two schools with equal numbers of economically disadvantaged students, as measured by free and reduced price lunch levels, can serve two very different sets of students.

14
At the Extreme: Two Schools with 50% FRPL Student Populations
School A-50% FRPL Population School B-50% FRPL Population Two -thirds of families have incomes of $35,000 or more One-third of families have incomes of less than $24,000 15% of all students in school live in poverty Half of the families have incomes below $12,500 Half of the families have incomes between $12,500 and $24,000 50% of all students in school live in poverty

15
Defining Poverty by Place
High-Poverty Neighborhoods-census tracts with a poverty rate of at least 20% in a given year. Distressed Neighborhoods-census tracts with a poverty rate of at least 40% in a given year. Bureau of the Census, 1970

16
Why Were These Thresholds Chosen?
Available evidence shows that at the 20% threshold one begins to see impacts of living in a neighborhood of socio-economic deprivation, above and beyond the individual impacts of poverty, controlling for other individual and group characteristics. Impacts of neighborhood poverty accelerate as concentrations climb from 20% to 40% when they appear to max out. When it was established in the 1970s, the 40% threshold also corresponded to what were commonly seen as “ghetto” neighborhoods.

17
Being Low-Income or Poor in a High-Poverty Neighborhood Creates a Double Burden
Living in communities with a large concentration of poverty causes additional burdens on residents Beyond their own family circumstances Must confront the poverty of those around them Additional burdens that are associated with poverty Higher crime rates, poor housing conditions, fewer job opportunities and more limited access to healthy food The Enduring Challenge of Concentrated Poverty in America, 2008

18
Neighborhood Poverty Has Increased Substantially in the Past Decade
Brookings Institute Report on Growth and Spread of Concentrated Poverty …. as poverty has spread, it has not done so evenly. Instead, it has also become more clustered and concentrated in distressed and high-poverty neighborhoods, eroding the brief progress made against concentrated poverty during the late 1990s. The challenges of poor neighborhoods—including worse health outcomes, higher crime rates, failing schools, and fewer job opportunities—make it that much harder for individuals and families to escape poverty and often perpetuate and entrench poverty across generations.2 2 Reserve System and the Brookings Institution, “The Enduring Challenge of Concentrated Poverty in America. For a review of the literature on the effects of concentrated poverty, see the Federal: Case Studies from Communities Across the U.S.” (Richmond, VA: 2008); and Patrick Sharkey, Stuck in Place: Urban Neighborhoods and the End of Progress Toward Racial Equality (Chicago: University of Chicago Press, 2013).
; and Patrick Sharkey, Stuck in Place: Urban Neighborhoods and the End of Progress Toward Racial Equality (Chicago: University of Chicago Press, 2013).")
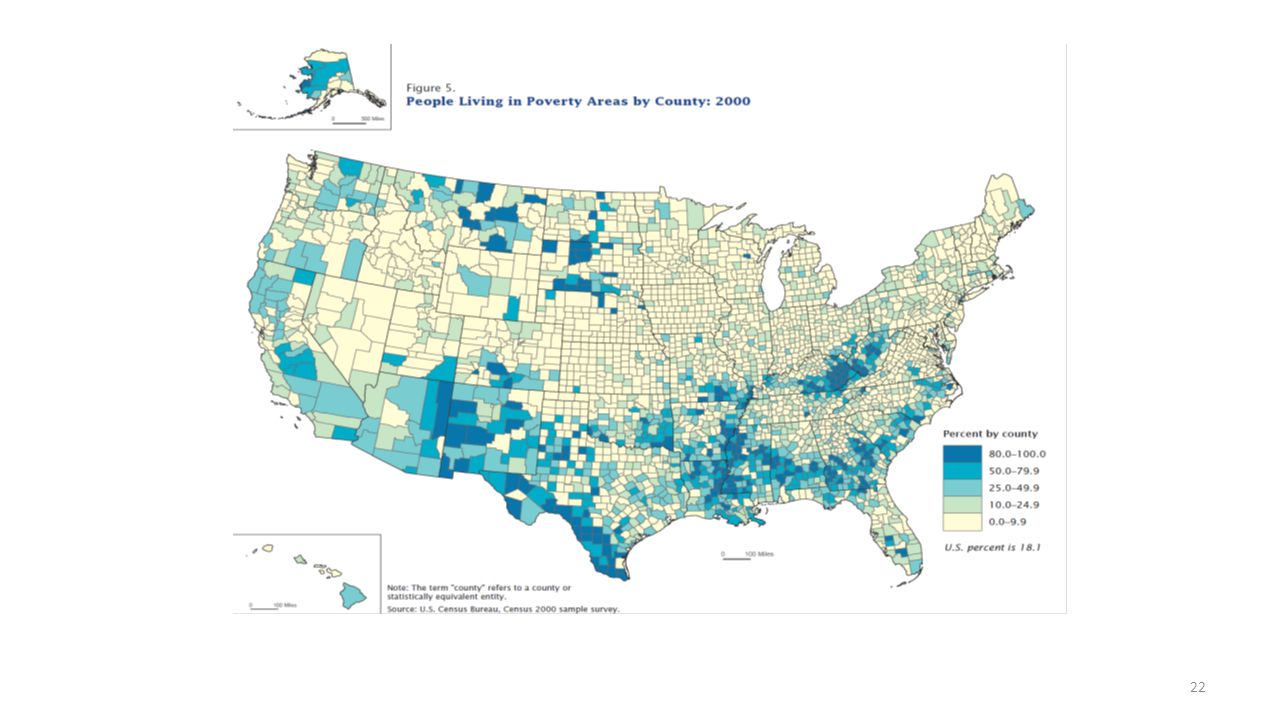
19
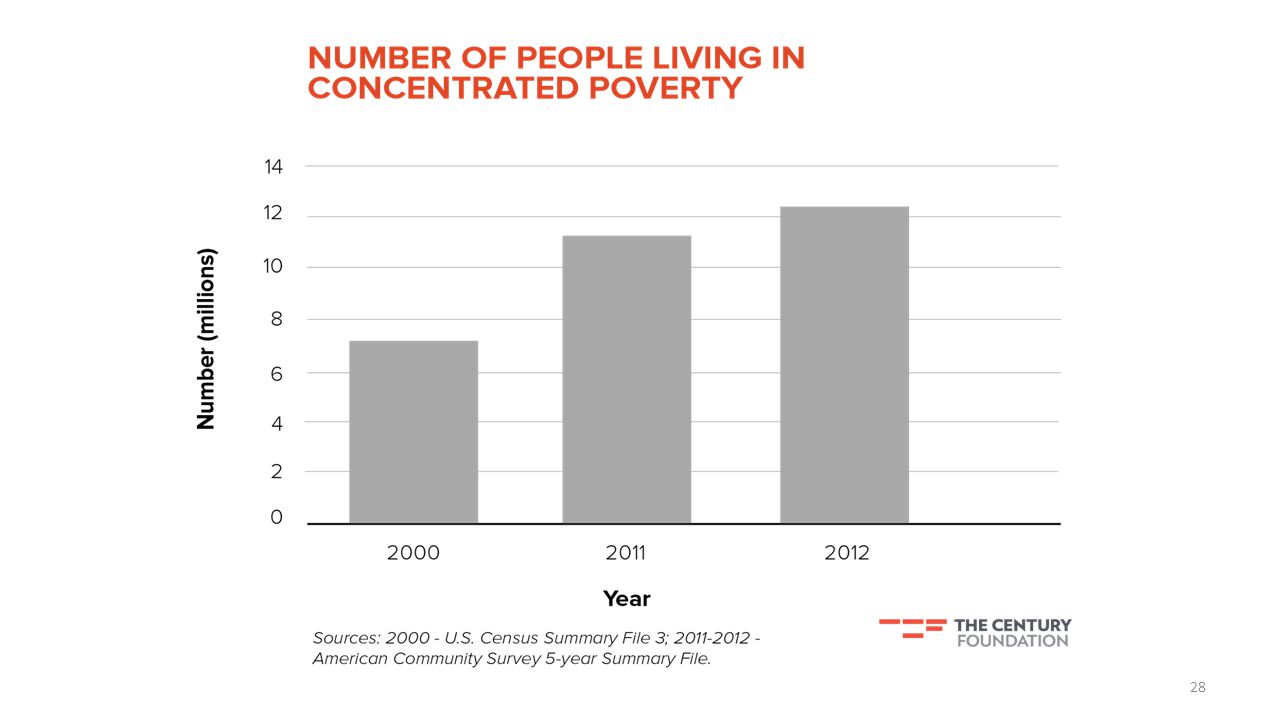
Number of People Who Experience Neighborhood Poverty
Percent of People in Census Track who Live in Poverty Number of Census Tracts Total Number Living There (Millions) Percent of US Population Living There Percent of Poor Living There Number of Poor Living There Number and Percent of Children Living There 20% + 77.4 million 25.7% 53.5% 23.9 million 20.3 Million (28%) 30% + 30 million 10% 27.8% 10.1 Million (14%) 40% + 3570 11.6 million 4% 12.2% 5.4 million
 Percent of US Population Living There. Percent of Poor Living There. Number of Poor Living There. Number and Percent of Children Living There. 20% million. 25.7% 53.5% 23.9 million Million. (28%) 30% + 30 million. 10% 27.8% 10.1 Million (14%) 40% million. 4% 12.2% 5.4 million.")
20
Complex takeaway: At least half of the people in high-poverty/distressed neighborhoods are not poor, but given what we know about residential segregation, most are likely low income, especially in distressed neighborhoods (nationally 75% poor or low income). Thus, low-income students in these neighborhoods are affected by living in concentrated poverty as well as students living in poverty. The key metric in terms of impact on student success is the percent of students living in these neighborhoods, and the concentration of them within schools.

21
Thus, the growth of neighborhood poverty over the past decade suggests that the scale and intensity of student needs have likely increased in the schools that serve these areas. Mapping the growth of neighborhood poverty shows that this impact has been unevenly felt across states and regions.

24
Our focus will be on the students and schools that experience concentrated poverty at its most extreme--those who live in neighborhoods with 40% or higher poverty rates

25
Concentrated Poverty and Student Success in Three Acts
Act 1 - Who, What, Where? Who is affected? Trace the historical and contemporary routes Highlight the impacts of social and cultural Isolation Examine multi-generational impacts Act 2 - Impact on Students and Schools What are the educational consequences? How many schools and districts experience the impacts of students living in concentrated poverty, and at what magnitude? Act 3 - What Can Be Done? Examine what we know about solutions

26
Act 1 Concentrated Neighborhood Poverty: Who Experiences it, Where is it Located, How Does it Impact its Residents?

27
Who is Confronted with Concentrated Poverty?
Almost 12 million Americans live in concentrated poverty 1 Increase of 5 million from Nearly 40 percent of people living in areas of concentrated poverty are African American 3 Nearly 40 percent of the total population living in communities of concentrated poverty are Hispanic 3 Almost three out of four African American families living in today’s most segregated, poorest neighborhoods are the same families that lived in the concentrated poverty of the 1970s 4 Mead’s work looks at 40 percent poverty in census tract and 30 percent zip code to be considered concentrated poverty 1 2013; 2 Kneebone, 2014; 3Meade, 2014; 4 Sharkey, 2013

29
How Were These Neighborhoods Formed? (Rural)
Small southern African Americans towns that were once slave plantations, then sharecropping/debt peonage (African American Belt- Arkansas to North Carolina; the Mississippi Delta) More than one-half of residents in many American Indian reservation communities are poor (Desert Southwest and the upper Great Plains) Lichter & Domenico, 2008
 More than one-half of residents in many American Indian reservation communities are poor (Desert Southwest and the upper Great Plains) Lichter & Domenico,")
30
How Were These Neighborhoods Formed? (Urban)
African Americans Great Migration – push and pull factors 1 Construction and maintenance of ghettos 2 Redlining policies and practices White flight Acts of terror Restrictive covenants Deprived of resources and investments Hispanics - Settled in gateway cities3 (Los Angeles, New York City, Chicago, Miami, San Diego ) These established enclaves continue to receive new waves of immigrants Puerto Rican & Dominicans lived in concentrated poverty in Boston, Providence, Philadelphia and New York. Mexicans often in urban clusters in the West One in three individuals in major cities who lives in concentrated poverty is in a household in which English is not spoken at home4 1 Wilson, 1987; Wilkerson, 2010; 2 Massey & Denton, 1998; 3Patterson, 2002; 4Mead, 2014
 These established enclaves continue to receive new waves of immigrants. Puerto Rican & Dominicans lived in concentrated poverty in Boston, Providence, Philadelphia and New York. Mexicans often in urban clusters in the West. One in three individuals in major cities who lives in concentrated poverty is in a household in which English is not spoken at home4. 1 Wilson, 1987; Wilkerson, 2010; 2 Massey & Denton, 1998; 3Patterson, 2002; 4Mead,")
31
How Were These Neighborhoods Formed? (Suburbs)
Between 2000 and , the number of poor suburban residents living in concentrated poverty grew by 139 percent - almost three times the pace of growth in cities While African Americans have been moving to the suburbs since the 1970s, there has been an increase in the last 15 years, often settling in pockets of concentrated poverty1 Example: Ferguson, St. Louis2 Larman Williams in 1968, first African American to buy a home By 1980, 14 % African American; 1990, 24%; 2000, 52%; 2010, 67% Between 2000 and 2012, Ferguson’s poor population doubled One in four lived below the federal poverty line and 44 percent of them fell below twice that level Southeast corner isolated geographically from the rest of the city3 8th poorest census tract in the state; 95 percent are African American While race changed in the suburbs, the power structure remained the same Police department, fire department, leadership class, school administrators and teachers 1 Kneebone, 2014; 2Rothstein, 2015; 3Casselman, 2014

32
How Does Concentrated Neighborhood Poverty Impact the People who Live There?

33
Exposure to Neighborhood Inequalities
Increase of violence Increase of crime Different forms of policing Hyper-incarceration Limited access to private services/poor public services Abundance of liquor stores Excess of fast food/dood deserts Higher banking expenses Unhealthy environment Poor housing Underground economy Decayed physical conditions of the built environment Higher rates of unemployment/limited employment opportunities 1/3 adults are HS dropouts vs. 12% college grads Wacquant, L. (2001); Sharkey, P. (2013); Wilson, W. (1987); Quane, J.M., Wilson, W.J. & Hwang, J. (2015); Jensen, E. (2009); Harding, D.J. (2003); Venkatesh, S.A. (2006)
; Sharkey, P. (2013); Wilson, W. (1987); Quane, J.M., Wilson, W.J. & Hwang, J. (2015); Jensen, E. (2009); Harding, D.J. (2003); Venkatesh, S.A. (2006)")
34
Social and Cultural Isolation
Social Isolation-lack of contact or sustained interaction with individuals and institutions that represent mainstream society Friends, relatives and community members do not introduce individuals to jobs, resources and opportunities Inability to gain access and embody certain behaviors, norms and skills that help people understand/read/navigate the global world Lack of diverse role models Mistrust and betrayal of institutions Young, A.A. (2003); Small, M.L. (2009); Patillo, M. (2003); Wilson, W.J. (1987); Royster, D. (2003); Ditomaso, N. (2013); Atkinson & Kintrea, (2004).
; Small, M.L. (2009); Patillo, M. (2003); Wilson, W.J. (1987); Royster, D. (2003); Ditomaso, N. (2013); Atkinson & Kintrea, (2004).")
35
Intangible Struggles in Concentrated Poverty
Preferential treatment to those who do not live in concentrated poverty, which maintains social isolation1 Hoarding of social resources and opportunities Negative reputations of schools and communities in concentrated poverty Social stigma of neighborhoods and families Stereotypes held by institutions and social actors about residents who live in concentrated poverty 1Royster, D. (2003); Ditomaso, N. (2013).
; Ditomaso, N. (2013).")
36
Multi-Generational Impacts
“The American ghetto appears to be inherited…the neighborhood environments in which African American and white Americans live have been passed down across generations.” (Sharkey, 2013 p. 9) Children grow up and remain in the same type of environment Childhood exposure to neighborhood inequalities maintains concentrated poverty Childhood exposure is not felt only in a single lifetime, but affects the next generation Inequality is something that occurs over long periods of time and structures the opportunities available to families over multiple generations Sharkey, 2013
 Children grow up and remain in the same type of environment. Childhood exposure to neighborhood inequalities maintains concentrated poverty. Childhood exposure is not felt only in a single lifetime, but affects the next generation. Inequality is something that occurs over long periods of time and structures the opportunities available to families over multiple generations. Sharkey,")
37
Agency in the Midst of Concentrated Poverty
African Americans and Latinos in these areas do have meaningful social networks Churches Community centers Social ties Local clubs Strong relationships Safe spaces Beauty shops, barber shops, homes Stack, C. (1974); Ladner, J. (2000); Lofton, R. (2015); Wacquant, L.J.D. (1997)
; Ladner, J. (2000); Lofton, R. (2015); Wacquant, L.J.D. (1997)")
38
ACT 2 What is the Impact of Concentrated Neighborhood Poverty on Students and Schools?

39
Concentrated Poverty and Schools
“A school’s socioeconomic background is a strong determinant of its students’ achievement”-- Coleman Report, 1966 Mary Kennedy in 1986 found that the relationship between school poverty concentrations and student achievement averages is stronger than the relationship between family poverty status and student achievement.1 Among children who experience poverty, live in areas of concentrated poverty, and are not reading proficiently by third grade, 35% fail to graduate from high school by age 19.2 1Kennedy, 1986; 2Hernandez, 2012

40
Concentrated Poverty and Schools
When half a student body is poor, all students’ achievement will be depressed When 75% are poor, all students’ achievement will be seriously depressed A district with more than 60% poor children can no longer rely solely on its own internal efforts to avoid failure Puma, M. et al, 1997; PPRAC

41
When both students and their parents grow up in concentrated neighborhood poverty, the impact on school success is magnified.

42
Sharkey’s thesis- the exposure of the ghetto over generations
PSID which began in 1968 Average scores on a reading/language test and an applied problem test, among children from four different groups of families Never in poor neighborhoods Parent in poor neighborhood Child in poor neighborhood Always in poor neighborhood Sharkey, 2013

43
What are some of the mechanisms through which concentrated neighborhood poverty impacts student and school success?

44
Students who live in neighborhoods of concentrated poverty attend school less frequently. They have higher rates of absenteeism and chronic absenteeism.

45
A Better Picture of Poverty: What chronic absenteeism and risk load reveal about NYC's lowest income elementary schools Found 130 elementary schools in NYC in which more than one- third of the children were chronically absent for five years in a row. These schools have very low levels of academic achievement as measured by standardized tests. Chronic absenteeism correlates with deep poverty--high rates of homelessness, child abuse reports, male unemployment, and low levels of parental education. In fact, the report states, chronic absenteeism is a much better index of poverty than the traditional measure of the number of children eligible for free lunch.

46
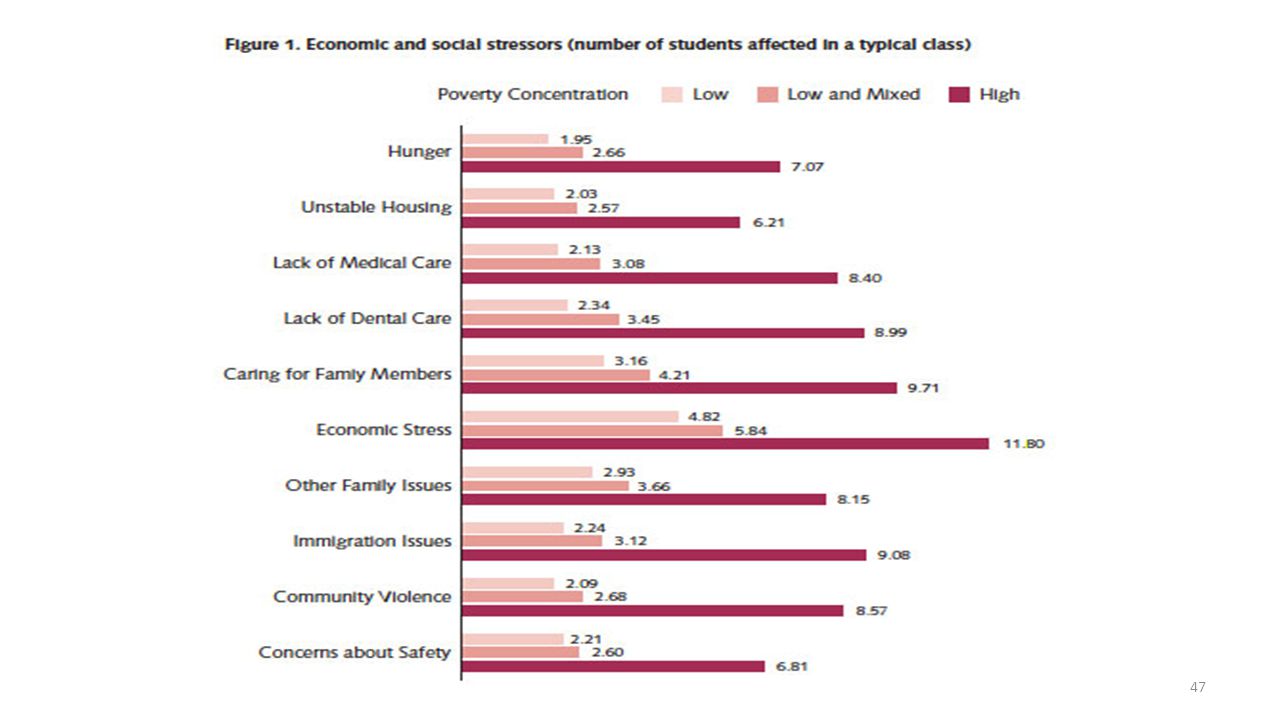
Chronic stress associated with living in poverty has been shown to adversely affect children’s concentration and memory which may impact their ability to learn. (American Psychological Association) The number of students being distracted and stressed by out-of-school struggles is 2-to-3 times higher in areas of concentrated poverty and reaches a level where it can impact the whole class (8-10 students or more in a class).
 The number of students being distracted and stressed by out-of-school struggles is 2-to-3 times higher in areas of concentrated poverty and reaches a level where it can impact the whole class (8-10 students or more in a class)..")
48
Concentrated Poverty Leads to Less Learning Time in School
UCLA Institute for Democracy conducted a statewide survey in California in November and December of 2013 783 California high school teachers completed minute online survey 3-5 teachers nested within 193 high schools Low-concentration poverty school % Low- and mixed-concentration poverty schools % High-concentration poverty schools %

49
Concentrated Poverty Leads to Less Learning Time
The lack of qualified substitutes Insufficient access to school libraries or computers Extra time spent on testing Emergency lockdowns Disrupted days for non-instructional assemblies More likely to be interrupted during class Surveyed 800 California High school teachers Rogers, J. & Mirra, N., 2014

50
Concentrated Poverty Leads to Less Learning Time
Lose 5 minutes on average in every instructional period compared to low-poverty schools (30 minutes per day) In total, high-poverty schools lost 12.4% of their instructional days for these reasons, compared to 7% in low-poverty schools Also higher rates of teacher absenteeism (which led to higher rates of teachers providing class coverage, instead of preparing for their classes or giving students extra help) Rogers, J. & Mirra, N, 2014
 In total, high-poverty schools lost 12.4% of their instructional days for these reasons, compared to 7% in low-poverty schools. Also higher rates of teacher absenteeism (which led to higher rates of teachers providing class coverage, instead of preparing for their classes or giving students extra help) Rogers, J. & Mirra, N,")
51
Schools that Serve Neighborhoods of Concentrated Poverty Also...
Have higher suspension and expulsion rates Have higher principal and teacher turnover Are often staffed by less-experienced principals and teachers As a result, greater student need is met with transient and less-experienced adults.

52
New analyses of the influence of concentrated neighborhood poverty on schools, districts, and student success nationwide What is the size, scope, and location of the problem for schools and districts nationwide Make preliminary investigations into concentrated poverty and student and school outcomes

53
School and student research questions
How many elementary, middle, and high schools are located in concentrated poverty neighborhoods? How many students do these schools serve? How do the elementary and middle school reading and math proficiency rates and high school graduation rates of public schools located in neighborhoods of concentrated poverty (at the 40% level) compare to rates in schools not located in these neighborhoods? Does this analysis provide evidence of the double burden on student success of being economically disadvantaged and living in a neighborhood of concentrated poverty (at the 40% level)?
 compare to rates in schools not located in these neighborhoods Does this analysis provide evidence of the double burden on student success of being economically disadvantaged and living in a neighborhood of concentrated poverty (at the 40% level)")
54
Methods Map school locations and school district boundaries
Overlay neighborhood (Census tract) boundaries Associate characteristics of neighborhoods with schools Associate and aggregate characteristics of neighborhoods with school districts Run descriptive analyses
 boundaries. Associate characteristics of neighborhoods with schools. Associate and aggregate characteristics of neighborhoods with school districts. Run descriptive analyses.")
55
Data and Sources American Community Survey ( ): neighborhood poverty, number of children Census TIGER/Line Shapefiles (2013): neighborhood boundaries, elementary and unified school district boundaries Common Core of Data (2012): school locations (longitude and latitude), school level, number of students EDFacts ( ): school math and reading proficiency rates, graduation rates
: neighborhood boundaries, elementary and unified school district boundaries. Common Core of Data (2012): school locations (longitude and latitude), school level, number of students. EDFacts ( ): school math and reading proficiency rates, graduation rates.")
56
Number of schools located in neighborhoods of concentrated poverty (at the 40% level) and students served by these schools School level Schools Students N % of total Total 6,645 6.4 2,594,000 5.2 Elementary 3,453 1,403,000 5.8 Middle 847 5.0 379,000 4.0 High 1,185 5.6 609,000 4.3 Other 707 10.1 204,000 10.7

57
Grade 5 math and reading proficiency rates by neighborhood concentrated poverty (at 40% level)
")
58
Grade 5 economically disadvantaged students’ math and reading proficiency rates by neighborhood concentrated poverty (at 40% level) Evidence of double burden!

59
Grade 8 math and reading proficiency rates by neighborhood concentrated poverty (at 40% level)
")
60
Grade 8 economically disadvantaged students’ math and reading proficiency rates by neighborhood concentrated poverty (at 40% level) Evidence of double burden!

61
High school graduation rates by neighborhood concentrated poverty (at 40% level)
")
62
Economically disadvantaged students’ high school graduation rates by neighborhood concentrated poverty (at 40% level) Evidence of double burden!

63
School district research questions
Across the nation, what levels of neighborhood poverty do school districts face? Which school districts serve children in concentrated poverty, and where are the districts located? Which school districts serve large numbers or percentages of students living in concentrated poverty?

64
Percentage of school districts facing various levels of neighborhood poverty
47 percent of districts have at least one neighborhood with 20%+ poverty 21 percent of districts have at least one neighborhood with 30%+ poverty 10 percent of districts have at least one neighborhood with 40%+ poverty (concentrated poverty) 64
 64.")
65
Neighborhood poverty levels in Baltimore City Public School district
65

66
Neighborhood poverty levels in Detroit Public Schools district
66

67
Neighborhood poverty levels in Ferguson, MO
67

68
School districts by the percentage of children in 30%+ poverty neighborhoods
68

69
School districts by the percentage of children in concentrated (40%+) poverty neighborhoods
About 13,000 elementary and unified school districts (excludes 4 percent of districts that are secondary only) Relatively equally distributed: Around 2-3 percent of districts per category 2.75 million children in concentrated poverty (5 percent of all children) About 80 percent of that number (2.25 million) in top two categories, roughly evenly split p_conpovkid | s_cat | Freq. Percent Cum. 0 | , 1 | 2 | 3 | 4 | Total | , . tab p_conpovkids_cat [iweight=n_conpovkids] 1 | 171, 2 | 325, 3 | 1,101, 4 | 1,152, Total | 2,751, 69
 Relatively equally distributed: Around 2-3 percent of districts per category million children in concentrated poverty (5 percent of all children) About 80 percent of that number (2.25 million) in top two categories, roughly evenly split. p_conpovkid | s_cat | Freq. Percent Cum | 11, | | | | Total | 13, tab p_conpovkids_cat [iweight=n_conpovkids] 1 | 171, | 325, | 1,101, | 1,152, Total | 2,751,")
70
Northeastern districts by the percentage of children in concentrated (40%+) poverty neighborhoods
70

71
Southeastern districts by the percentage of children in concentrated (40%+) poverty neighborhoods
71

72
Midwestern districts by the percentage of children in concentrated (40%+) poverty neighborhoods
72

73
Michigan districts by the percentage of children in concentrated (40%+) poverty neighborhoods
73

74
Southwestern districts by the percentage of children in concentrated (40%+) poverty neighborhoods
74

75
Western districts by the percentage of children in concentrated (40%+) poverty neighborhoods
75

76
Top 10 school districts with the highest numbers of in-boundary children in concentrated (40%+) poverty 40%+ Poverty District State Total N % N New York City Department Of Education NY 1,240,861 14.5 180,176 Los Angeles Unified School District CA 759,389 11.6 88,065 Chicago Public School District 299 IL 427,892 18.4 78,690 Detroit City School District MI 134,302 54.0 72,587 Philadelphia City School District PA 239,992 25.8 61,933 Milwaukee School District WI 112,748 32.0 36,042 Fresno Unified School District 78,385 45.3 35,484 Houston Independent School District TX 218,462 14.3 31,292 Dade County School District FL 394,228 7.9 31,023 Memphis City School District TN 116,494 25.0 29,174

77
Most children living in concentrated poverty are in a very small number of districts
The top 10 school districts with the highest numbers of children living in concentrated poverty contain 23 percent of the nation’s total Just 69 school districts contain more than half the nation’s children living in concentrated poverty That said, there are small pockets of concentrated poverty (40%+) throughout the country About 1,250 school districts have at least some concentrated poverty Some of these districts face very substantial poverty rates
 throughout the country. About 1,250 school districts have at least some concentrated poverty. Some of these districts face very substantial poverty rates.")
78
Top 10 school districts with the highest percentages of in-boundary children in concentrated (40%+) poverty 40%+ Poverty District State Total N % N Kiryas Joel Village Union Free School District NY 5,309 100.0 Shannon County School District 65-1 SD 3,669 Earlimart Elementary School District CA 2,692 Whiteriver Unified District AZ 2,587 Fabens Independent School District TX 2,233 Zuni Public Schools NM 1,559 Tornillo Independent School District 1,397 Sacaton Elementary District 1,188 La Villa Independent School District 845 Progreso Independent School District 720 4 BIA schools 4 Border towns w/ Mexico 1 children of Hispanic farm workers and fruit packers (migrant?) Oddly enough, 1 orthodox 24 districts nationally w/ 100% of kids in 40% plus poverty Orthodox Bureau of Indian Affairs American Indian Hispanic (Farm workers packing houses) American Indian Border Town Border town Near a border town
 Oddly enough, 1 orthodox. 24 districts nationally w/ 100% of kids in 40% plus poverty. Orthodox. Bureau of Indian Affairs American Indian. Hispanic (Farm workers packing houses) American Indian. Border Town. Border town. Near a border town.")
79
Top 10 school districts (highest n) with more than half of in-boundary children in concentrated (40%+) poverty 40%+ Poverty District State Total N % N Detroit City School District MI 134,300 54 72,600 Laredo Independent School District TX 22,000 69 15,100 Alhambra Elementary District AZ 22,400 61 13,600 Syracuse City School District NY 23,000 57 13,200 La Joya Independent School District 23,500 55 13,000 Donna Independent School District 18,900 66 12,400 Dearborn City School District 52 11,600 Flint City School District 18,500 56 10,400 Reading School District PA 18,800 10,200 Coachella Valley Unified School District CA 19,700 50 9,900 5 rust belt cities dead manufacturing cities 3 border cities 2 poor mainly Hispanic communities Detroit (dead manufacturing) Border city Phoenix/Glendale carve out Manufacturing Detroit metro dead manufacturing Flint, dead manufacturing Reading, dead manufacturing Rail roads Trailer parks & migrant workers among others?
 Border city. Phoenix/Glendale carve out. Manufacturing. Detroit metro dead manufacturing. Flint, dead manufacturing. Reading, dead manufacturing Rail roads. Trailer parks & migrant workers among others")
80
Key Takeaways National evidence consistent with idea of double burden exists Geography of concentrated poverty is a patchwork quilt across our nation A small number of districts faces substantial levels of concentrated poverty A very small identifiable subset of districts makes up the bulk of the problem

81
ACT 3 What Do We Know About Solutions?

82
Examples of Promising practices include: Chicago 5 Essentials
CONCENTRATED POVERTY and Student Success Promising Responses & Practices Examples of Promising practices include: Chicago 5 Essentials Diplomas Now SEED Schools Harlem Children’s Zone Promise Neighborhoods Choice Neighborhoods Promise Zones Neighborhood Revitalization Initiative (NRI) Moving to Opportunity (MTO)
 Moving to Opportunity (MTO)")
83
Strategy 1: Strengthen and Design Schools to Meet the Needs of Students Who Live in Concentrated Neighborhood Poverty

84
Five Essential School Supports to Mitigate Neighborhood Poverty
University of Chicago Consortium on Chicago School Research found 5 essential supports to improve academic success Elementary Schools in high-poverty neighborhoods that were strong in these supports were 19 times more likely to improve learning in reading and mathematics 5 essential supports School Leadership Parent-Community ties Professional capacity Student-centered learning environments Instructional guidance In the most impacted neighborhoods, however, these supports alone were not enough Bryk A., Sebring, P., Allensworth, E., Luppescu, S., Easton, J. (2010)
")
85
Schools as Safe Spaces in Concentrated Poverty
Schools are safer when teachers view parents as supportive partners in the educational process Schools are safer when students feel that their teachers listen and care about their learning and overall well-being Punitive measures are less likely to instill a sense of safety than measures that foster respect and trust Sufficient staffing needed to keep teachers and other staff members from feeling overwhelmed so they can develop positive relationships with each other and with students and families Steinberg, M., Allensworth, E. & Johnson, D. (2015)
")
86
Diplomas Now Secondary School Transformation Collaboration
Integrated Student Supports Whole School Reform Targeted Support & Whole School Prevention 14 Cities Students Baton Rouge Boston Chicago Columbus Detroit Los Angeles Miami New York City Philadelphia San Antonio Seattle Tulsa Washington, DC 32 Total Schools 16 Middle Schools 14 High Schools buildings Bold cities implementing Randomized Control Trial by MDRC Investing in Innovation Fund Winner 1,700 Applicants 49 Grantees

87
Surrounding Teachers and Students with Support
Diplomas Now Model Surrounding Teachers and Students with Support Instructional Supports Double dose math & English Extra help labs Common college preparatory or high school readiness curricula Organizational Supports Inter-disciplinary and subject focused common planning time Bi-weekly EWI meetings On-site school transformation facilitator Professional Development Supports Job-embedded coaching - Math and English instructional coaches Professional learning community Professional development linked to grade/subject instructional practice Teacher Team (4 teachers) Data Supports Easy access to student data on the Early Warning Indicators Benchmarks tied to national and state standards On-site facilitator to leverage EWI data 3 -4 cohorts students Student Supports Multi Tiered Response to Intervention Model 8 to 20 City Year AmeriCorps members: whole school and targeted academic and socio-emotional supports Communities In Schools on-site coordinator: case managed supports for highest need students Interventions to address early warning indicators of Attendance Behavior Course Performance Whole school attendance, positive behavior, college-going culture Strengthening student resiliency
 Data Supports. Easy access to student data on the Early Warning Indicators. Benchmarks tied to national and state standards. On-site facilitator to leverage EWI data cohorts students. Student Supports. Multi Tiered Response to Intervention Model. 8 to 20 City Year AmeriCorps members: whole school and targeted academic and socio-emotional supports. Communities In Schools on-site coordinator: case managed supports for highest need students. Interventions to address early warning indicators of. Attendance. Behavior. Course Performance. Whole school attendance, positive behavior, college-going culture. Strengthening student resiliency.")
88
Diplomas Now i3 2013-14 End-of-Year Results
Off Track Prior to Final Marking Period Off Track at End of Final Marking Period Getting off-track students back on track: The progress of students flagged with an off-track indicator prior to the final marking period of the school year in all DN i3 schools. Preventing students from falling off-track : Percentage of students in all DN i3 schools not flagged with an off-track indicator prior to quarter 4 who stayed on track. Overall Success : Percentage of students who ended the year on track in all DN i3 schools for the school year. Percentage of Students On Track Percentage of Students On Track *Averages based on longitudinal data as available from 82 participating grades in 29 schools in 11 urban districts.

89
Concept The SEED School A safe, supportive environment for learning
CONCENTRATED POVERTY Promising Responses & Practices The SEED School Concept A school developed to provide socially and economically disadvantaged children the opportunity to learn in a safe and nurturing residential environment. Specifically offering: A safe, supportive environment for learning Mostly voluntary enrollment Involvement of the child’s family when appropriate Limited tuition or no tuition The SEED Foundation, February 2002 and SEED Annual Report, 2014

90
The SEED School RESULTS
CONCENTRATED POVERTY Promising Responses & Practices The SEED School RESULTS 90% of SEED students who enter the ninth grade graduate from high school. For comparison: 81%of all students across the nation graduate from high school. More than 90% of SEED graduates have been accepted to a 4-year college or university. More than 90% of SEED graduates have enrolled in college. For comparison: 52% of low-income high school graduates enroll immediately in college. 71% of SEED graduates have college degrees, are currently enrolled in college or an alternative post-secondary program, or are in the military. For comparison: 11% of low-income, first-generation students who enroll in college earn a bachelor’s degree within six years.

91
Strategy 2: Strengthen Schools and Provide Enhanced Social, Health, and Training Supports to Parents and Students from Cradle to Career

92
Early childhood programs with parent classes Public charter schools
CONCENTRATED POVERTY The Harlem Children’s Zone (HCZ) Promising Responses & Practices A non-profit organization that funds and operates a neighborhood-based system of education and social services for children of low-income families in a 100-block area in Harlem, New York1. Education Components Early childhood programs with parent classes Public charter schools Academic advisors and afterschool programs for students attending regular public schools Support system for former HCZ students enrolled in college 1Harlem Children’s Zone, FY 2014 Report
 Promising Responses & Practices. A non-profit organization that funds and operates a neighborhood-based system of education and social services for children of low-income families in a 100-block area in Harlem, New York1. Education Components. Early childhood programs with parent classes. Public charter schools. Academic advisors and afterschool programs for students attending regular public schools. Support system for former HCZ students enrolled in college. 1Harlem Children’s Zone, FY 2014 Report.")
93
$5,000 vs $50,000+ Fitness program Asthma management program
CONCENTRATED POVERTY The Harlem Children’s Zone (continued) Promising Responses & Practices Health Components Fitness program Asthma management program Nutrition program Neighborhood services, programs Organizing tenant associations One-on-one counseling to families Foster care prevention Community Centers Employment and technology center (for teaching job-related skills to teens and adults $5,000 vs $50,000+ HCZ spends $5,000 per child annually, while New York City spends more than $50,000 each year to incarcerate an inmate.
 Promising Responses & Practices. Health Components. Fitness program. Asthma management program. Nutrition program. Neighborhood services, programs. Organizing tenant associations. One-on-one counseling to families. Foster care prevention. Community Centers. Employment and technology center (for teaching job-related skills to teens and adults. $5,000 vs $50,000+ HCZ spends $5,000 per child annually, while New York City spends more than $50,000 each year to incarcerate an inmate.")
94
100% “Harlem Gems” pre-kindergarteners were assessed as “school ready”
CONCENTRATED POVERTY Promising Responses & Practices Results 100% “Harlem Gems” pre-kindergarteners were assessed as “school ready” 95% of high school seniors were accepted into college $20 million in scholarships and grants were awarded to our most recent college freshmen 4,000+ parents have graduated from The Baby College® parenting workshop series 12,316 children served in FY 2013 1,450 students at Promise Academy Charter Schools 12,436 adults served in FY 2013 $101 million annual budget in FY 2013 (public and private funds) 954 students attending college 1.4 million free, healthy lunches and breakfasts served to HCZ children 4,000 children getting one hour of exercise daily
 954 students attending college. 1.4 million free, healthy lunches and breakfasts served to HCZ children. 4,000 children getting one hour of exercise daily.")
95
* http://www.promiseneighborhoodsinstitute.org/
CONCENTRATED POVERTY Promising Responses & Practices Promise Neighborhoods … U.S. Department of Education programs developed to provide funding to support eligible entities including nonprofit organizations; institutions of higher education and Native American tribes to improve educational outcomes for students in distressed urban and rural neighborhoods. Based on the experience of programs such as the Harlem Children’s Zone Includes a planning year to develop a comprehensive community program with the specific goal of preparing students for success in college and careers. Planners/applicants must focus on schools in challenged neighborhoods and build services and supports for students from birth through college or career* *

96
* http://www.promiseneighborhoodsinstitute.org/
CONCENTRATED POVERTY Promising Responses & Practices Promise Neighborhoods As of 2012, Promise Neighborhoods were operating in 20 states and the District of Columbia. Emphases continue to focus on offering children high-quality health, social, community and educational services and support. Other communities are considering the Promise Neighborhoods’ model for replication, without federal support. The Promise Neighborhood Institute at Policy Link* can offer technical assistance to communities (resources, training, tools) in this regard. * *
 in this regard. * *")
97
Strategy 3: Strengthen the Neighborhood

98
CONCENTRATED POVERTY Promising Responses & Practices Choice Neighborhoods programs support locally driven strategies to revitalize neighborhoods by replacing distressed public or HUD-assisted housing* with mixed-income developments. Preceded HOPE VI Emphasizes preserving affordable housing and a more comprehensive approach to neighborhood change Stakeholders and residents come together to create and implement a plan that transforms distressed HUD housing, while simultaneously addressing challenges of vacant housing. Piloted in 2010, is part of the White House Neighborhood Revitalization Initiative Collaborative, place-based planning for neighborhood revitalization in areas of concentrated poverty. Interim report—An Early Look at Choice Neighborhoods looks at qualitative and quantitative approaches to monitor impacts on five of the original implementation sites *U.S. Dept. of Housing and Urban Development. Choice Neighborhood, April 2014

99
CONCENTRATED POVERTY Promising Responses & Practices The President’s initiative to designate a number of high-poverty urban, rural and tribal communities as Promise Zones, where the federal government will partner with and invest in communities to create jobs, leverage private investment, increase economic activity, expand educational opportunities, and reduce violent crime. A collaborative effort--between private business and federal, state, and local officials; faith-based and non-profit organizations; and striving kids and parents--to ensure that hard work leads to a decent living for every American in every community.

100
Promise Zone Designations
CONCENTRATED POVERTY Promising Responses & Practices Promise Zone Designations January 9, 2014, the first urban, rural, and tribal Promise Zones were announced in a ceremony at the White House. They are located in: San Antonio (Eastside Neighborhood), Philadelphia (West Philadelphia), Los Angeles (Neighborhoods of Pico Union, Westlake, Koreatown, Hollywood, and East Hollywood), Southeastern Kentucky (Kentucky Highlands), and the Choctaw Nation in southeast Oklahoma. Fifteen more will be designated by the end of 2016.
, Philadelphia (West Philadelphia), Los Angeles (Neighborhoods of Pico Union, Westlake, Koreatown, Hollywood, and East Hollywood), Southeastern Kentucky (Kentucky Highlands), and the Choctaw Nation in southeast Oklahoma. Fifteen more will be designated by the end of")
101
CONCENTRATED POVERTY Promising Responses & Practices Neighborhood Revitalization Initiative (NRI) an interagency collaborative supporting the Obama administration’s approach to federal engagement in neighborhoods of concentrated poverty. The belief is that this alignment will allow resources to effectively support local community, government, business in creating successful neighborhoods of opportunity. A place-based approach to help distressed communities transform into neighborhoods of opportunities.
 an interagency collaborative supporting the Obama administration’s approach to federal engagement in neighborhoods of concentrated poverty. The belief is that this alignment will allow resources to effectively support local community, government, business in creating successful neighborhoods of opportunity. A place-based approach to help distressed communities transform into neighborhoods of opportunities.")
102
Engages key federal agencies:
CONCENTRATED POVERTY Promising Responses & Practices Engages key federal agencies: U.S. Dept. of Housing & Urban Development (HUD) Dept. of Justice Dept. of Health & Human Services NRI strategy seeks to integrate the Choice and Promise Neighborhood programs to ensure federal funds are aligned and local efforts are comprehensive.
 Dept. of Justice. Dept. of Health & Human Services. NRI strategy seeks to integrate the Choice and Promise Neighborhood programs to ensure federal funds are aligned and local efforts are comprehensive.")
103
The five programs at the center of the NRI: Choice Neighborhoods
CONCENTRATED POVERTY Promising Responses & Practices The five programs at the center of the NRI: Choice Neighborhoods Byrne Criminal Justice Innovation (a community-based strategy designed to control and prevent violent crime, drug abuse, gang activity in high-crime neighborhoods across the country) Community Health Centers have provided comprehensive high-quality prevention and primary health care to medically underserved urban and rural communities for four decades. Behavioral Health Community Initiative focuses resources in selected disadvantaged communities seeking to improve outcomes for substance use, mental health prevention, treatment and recovery.
 Community Health Centers have provided comprehensive high-quality prevention and primary health care to medically underserved urban and rural communities for four decades. Behavioral Health Community Initiative focuses resources in selected disadvantaged communities seeking to improve outcomes for substance use, mental health prevention, treatment and recovery.")
104
Strategy 4: Provide Residents with Means to Leave Neighborhoods of Concentrated Poverty

105
Traditional section 8 housing To move to a low-poverty neighborhood
CONCENTRATED POVERTY Promising Responses & Practices In 1992, Congress authorized Housing and Urban Development (HUD) to implement in five cities (Baltimore, Boston, Chicago, Los Angeles, New York) a randomized experiment involving families in public housing, to receive vouchers to use for housing. Three groups were identified and divided, assigned to use vouchers for: Traditional section 8 housing To move to a low-poverty neighborhood As part of a control group (Summary Overview of MTO, a Random Housing Assignment Mobility Study,
 to implement in five cities (Baltimore, Boston, Chicago, Los Angeles, New York) a randomized experiment involving families in public housing, to receive vouchers to use for housing. Three groups were identified and divided, assigned to use vouchers for: Traditional section 8 housing. To move to a low-poverty neighborhood. As part of a control group. (Summary Overview of MTO, a Random Housing Assignment Mobility Study,")
106
Findings of a follow-up study of MTO:
CONCENTRATED POVERTY Promising Responses & Practices Findings of a follow-up study of MTO: Improved neighborhood outcomes...assignment to the MTO mobility groups led participating adults to feel safer and more satisfied with their housing and neighborhood Had no effect on the labor market outcomes or social program participation of adults, but improved adults' mental health and some aspects of physical health Improved outcomes for female youth, but on balance, had deleterious effects on male youths’ risky behavior Had no detectable effects on the math and reading achievement of children (A Summary Overview of Moving To Opportunity)
")
107
References Atkinson, R., & Kintrea, K. (2004). Opportunities and despair, it’s all in there: Practitioner experiences and explanations of area effects and life chances. Sociology 38 (3), pp Bryk, A., Sebring, B.P., Allensworth, E., Luppescu, S., Easton, Q. J., (2010). Organizing schools for improvement: Lessons from Chicago. Chicago: University of Chicago Ditomaso, N. (2013). The American non-dilemma. Russell Sage Casselman, B. (2014). The poorest corner of town. Cortright, J. & Mahmoudi, D. (2014). Lost in Place: Why the persistence and spread of concentrated poverty--not gentrification--is our biggest urban challenge. Harding, D.J. (2003). Counterfactual Models of Neighborhood effects: The effect of neighborhood poverty on dropping out and teenage pregnancy. American Journal of Sociology 109; Hogrebe, M., Tate, W. (2010). School Composition and Context factors that moderate and predict 10th grade science proficiency, Teachers College Record, 112, 4. Jargosky, P.A. (2013). Concentration of poverty in the new millennium: Changes in the prevalence, composition, and location of high-poverty neighborhoods. New York: The Century Foundation. Retrieved from the-new-millennium Kennedy, M.M., et al. (1986). Poverty, Achievement and the distribution of compensatory education services: an interim report from the national assessment of Chapter 1, Office of Educational Research and Improvement, Washington D. C.
. Opportunities and despair, it’s all in there: Practitioner experiences and explanations of area effects and life chances. Sociology 38 (3), pp Bryk, A., Sebring, B.P., Allensworth, E., Luppescu, S., Easton, Q. J., (2010). Organizing schools for improvement: Lessons from Chicago. Chicago: University of Chicago. Ditomaso, N. (2013). The American non-dilemma. Russell Sage. Casselman, B. (2014). The poorest corner of town. Cortright, J. & Mahmoudi, D. (2014). Lost in Place: Why the persistence and spread of concentrated poverty--not gentrification--is our biggest urban challenge. Harding, D.J. (2003). Counterfactual Models of Neighborhood effects: The effect of neighborhood poverty on dropping out and teenage pregnancy. American Journal of Sociology 109; Hogrebe, M., Tate, W. (2010). School Composition and Context factors that moderate and predict 10th grade science proficiency, Teachers College Record, 112, 4. Jargosky, P.A. (2013). Concentration of poverty in the new millennium: Changes in the prevalence, composition, and location of high-poverty neighborhoods. New York: The Century Foundation. Retrieved from the-new-millennium. Kennedy, M.M., et al. (1986). Poverty, Achievement and the distribution of compensatory education services: an interim report from the national assessment of Chapter 1, Office of Educational Research and Improvement, Washington D. C.")
108
References (cont.) Kneebone, E. & Berube, A. (2013). Confronting suburban poverty in America: Brooking Press. Kneebone, E. (2014). The growth and spread of concentrated poverty, 2000 to Brookings PRRAC, Annotated bibliography: The impact of school based poverty concentrated on academic achievement and student outcomes Roger, J. & Mirra, N. (2014). It’s About Time: Learning Time and Educational Opportunity in California High Schools Royster, D. (2003). Race and the invisible hand. Berkeley, CA: University of California Press. Massey, D., & Denton, A.N. (1998) American Apartheid: segregation and the making of the underclass. Harvard University Press. Meade, E. (2014). Overview of community characteristics in areas with concentrated poverty. ASPE Research Brief. Department of Health and Human Services. Nauer, K., et al. (2014). A better picture of poverty: What chronic absenteeism and risk load reveal about NYC’s lowest-income elementary schools. Lichter, D.T., & Parisi, D. (2008). Concentrated Rural poverty and the geography of exclusion. Report, Carsey Institute Sharkey, P. (2013). Stuck in place: Urban neighborhoods and the end of progress toward racial equality. University of Chicago Press. Wilkerson, I. (2011) The warmth of other suns: the epic story of America’s great migration. Random House. Wilson, W.J. (1987). The truly disadvantaged; the inner city, the underclass, and public policy: University of Chicago Young, A.A. (2003). Social isolation, and concentration effects: William Julius Wilson revisited and re-applied, Ethnic and Racial Studies 26 (6)
. The growth and spread of concentrated poverty, 2000 to Brookings. PRRAC, Annotated bibliography: The impact of school based poverty concentrated on academic achievement and student outcomes Roger, J. & Mirra, N. (2014). It’s About Time: Learning Time and Educational Opportunity in California High Schools Royster, D. (2003). Race and the invisible hand. Berkeley, CA: University of California Press. Massey, D., & Denton, A.N. (1998) American Apartheid: segregation and the making of the underclass. Harvard University Press. Meade, E. (2014). Overview of community characteristics in areas with concentrated poverty. ASPE Research Brief. Department of Health and Human Services. Nauer, K., et al. (2014). A better picture of poverty: What chronic absenteeism and risk load reveal about NYC’s lowest-income elementary schools. Lichter, D.T., & Parisi, D. (2008). Concentrated Rural poverty and the geography of exclusion. Report, Carsey Institute. Sharkey, P. (2013). Stuck in place: Urban neighborhoods and the end of progress toward racial equality. University of Chicago Press. Wilkerson, I. (2011) The warmth of other suns: the epic story of America’s great migration. Random House. Wilson, W.J. (1987). The truly disadvantaged; the inner city, the underclass, and public policy: University of Chicago. Young, A.A. (2003). Social isolation, and concentration effects: William Julius Wilson revisited and re-applied, Ethnic and Racial Studies 26 (6)")
Similar presentations


>")


