Download presentation
Presentation is loading. Please wait.

1
Shock Scott G. Sagraves, MD, FACS Assistant Professor
Trauma & Surgical Critical Care Associate Director of Trauma UHS of Eastern Carolina

2
Objectives Define & classify shock Outline management principles
Discuss goals of fluid resuscitation Understand the concepts of oxygen supply and demand in managing shock. Describe the physiologic effects of vasopressors and inotropic agents

3
Goals Review hemodynamic techniques in the ICU
Introduce the concept of the cardiac cycle Review of the pulmonary artery catheter parameters Utilize the presentation to analyze clinical cases and to feel comfortable with pa-c parameters.

4
“A momentary pause in the act of death.” -John Collins Warren, 1800s
Shock: “A momentary pause in the act of death.” -John Collins Warren, 1800s

5
Hypotension In Adults: systolic BP 90 mm Hg
mean arterial pressure 60 mm Hg systolic BP > 40 mm Hg from the patient’s baseline pressure

6
Definition SHOCK: inadequate organ perfusion to meet the tissue’s oxygenation demand.

7
“Hypoperfusion can be present in the absence of significant hypotension.”
-fccs course

8
Pathophysiology ATP + H2O ADP + Pi + H+ + Energy
Acidosis results from the accumulation of acid when during anaerobic metabolism the creation of ATP from ADP is slowed. H+ shift extracellularly and a metabolic acidosis develops

9
Pathophysiology ATP production fails, the Na+/K+ pump fails resulting in the inability to correct the cell electronic potential. Cell swelling occurs leading to rupture and death. Oxidative Phosphorylation stops & anaerobic metabolism begins leading to lactic acid production.

10
Why Monitor? Essential to understanding their disease
Describe the patient’s physiologic status Facilitates diagnosis and treatment of shock

11
History 1960’s low BP = shock; MSOF resulted after BP restored 1970’s Swan & Ganz - flow-directed catheter thermistor cardiac output 1980’s resuscitation based on oxygen delivery, consumption & oxygen transport balance.

12
Pulmonary Artery Catheter

13
Pulmonary Artery Catheter
INDICATIONS volume status cardiac status COMPLICATIONS technical anatomic physiologic

14
PLACEMENT

15
West’s Lung Zones Zone I - PA > Pa > Pv
Zone II - Pa > PA > Pv Zone III - Pa > Pv > PA PA = alveolar Pa = pulmonary artery Pv = pulmonary vein

16
Correct PA-C Position

17
Standard Parameters Measured Calculated Blood pressure
Pulmonary A. pressure Heart rate Cardiac Output Stroke volume Wedge pressure CVP Calculated Mean BP Mean PAP Cardiac Index Stroke volume index SVRI LVSWI BSA

18
Why Index? Body habitus and size is individual
Inter-patient variability does not allow “normal” ranges “Indexing” to patient with BSA allows for reproducible standard

19
Index Example PATIENT A PATIENT B CI = 2.4 L/min/m2 CI = 1.5 L/min/m2
60 yo male 50 kg CO = 4.0 L/min BSA = 1.86 CI = 2.4 L/min/m2 PATIENT B 60 yo male 150 kg CO = 4.0 L/min BSA = 2.64 CI = 1.5 L/min/m2

20
PA Insertion 20 15 10 5 RA = 5 RV = 22/4 PA 19/10 PAOP = 9

21
CVP CVP of SVC at level of right atrium pre-load “assessment”
normal mm Hg limited value

22
PAOP End expiration Reflection changes with positive pressure
Waveforms change every 20 cm

23
Waveform Analysis A wave - atrial systole
C wave - tricuspid valve ventricular systole V wave - venous filling of right atrium

24
Cardiac Cycle pulmonary Right ventricle Left ventricle systemic MPAP
PVRI MPAP pulmonary PCWP RVSWI Right ventricle Left ventricle LVSWI MAP CVP systemic SVRI

25
Hemodynamic Calculations
Parameter Normal Cardiac Index (CI) Stroke Volume Index (SVI) Sys Vasc Resistance Index (SVRI) Left Vent Stroke Work Index (LVSWI)
 Stroke Volume Index (SVI) Sys Vasc Resistance Index (SVRI) Left Vent Stroke Work Index (LVSWI)")
26
Cardiac Index C.I. = HR x SVI
SVI measures the amount of blood ejected by the ventricle with each cardiac contraction. Total blood flow = beats per minute x blood volume ejected per beat

27
Vascular Resistance Index
SYSTEMIC (SVRI) MAP - CVP CI SVR = vasoconstriction SVR = vasodilation PULMONARY (PVRI) MPAP - PAOP CI PVR = constriction PE, hypoxia x 80 x 80 Vascular resistance = change in pressure/blood flow
 MAP - CVP. CI. SVR = vasoconstriction. SVR = vasodilation. PULMONARY (PVRI) MPAP - PAOP. CI. PVR = constriction. PE, hypoxia. x 80. x 80. Vascular resistance = change in pressure/blood flow.")
28
LVSWI = (MAP-PAOP) x SVI x 0.0136
Stroke Work LVSWI = (MAP-PAOP) x SVI x normal = VSWI describe how well the ventricles are contracting and can be used to identify patients who have poor cardiac function. ventricular stroke work = pressure x vol. ejected
 x SVI x normal = VSWI describe how well the ventricles are contracting and can be used to identify patients who have poor cardiac function. ventricular stroke work = pressure x vol. ejected.")
29
Too Many Numbers

30
Definitions O2 Delivery - volume of gaseous O2 delivered to the LV/min. O2 Consumption - volume of gaseous O2 which is actually used by the tissue/min. O2 Demand - volume of O2 actually needed by the tissues to function in an aerobic manner Demand > consumption = anaerobic metabolism

31
Rationale for Improving O2 Delivery
Insult Tissue Hypoxia Demands are met Increased Delivery Increased Consumption

32
Critical O2 Delivery VO2I DO2I The critical value is variable
& is dependent upon the patient, disease, and the metabolic demands of the patient. DO2I

33
Oxygen Calculations Arterial Oxygen Content (CaO2) Venous Oxygen Content (CvO2) Arteriovenous Oxygen Difference (avDO2) Delivery (O2AVI) Consumption (VO2I) Efficiency of the oxygenation of blood and the rates of oxygen delivery and consumption
 Consumption (VO2I) Efficiency of the oxygenation of blood and the rates of oxygen delivery and consumption.")
34
Arterial Oxygen Content
CaO2 = (1.34 x Hgb x SaO2) + (PaO2 x ) If low, check hemoglobin or pulmonary gas exchange
 + (PaO2 x ) If low, check hemoglobin or pulmonary gas exchange.")
35
Arteriovenous Oxygen Difference
avDO2 = CaO2 - CvO2 Values > 5.6 suggests more complete tissue oxygen extraction, typically seen in shock

36
Oxygen Delivery (DO2I) O2AVI = CI x CaO2 x 10
Normal values suggests that the heart & lungs are working efficiently to provide oxygen to the tissues. < 400 is bad sign

37
If VO2I < 100 suggest tissues are not getting enough oxygen
Oxygen Consumption VO2I = CI x (CaO2 - CvO2) If VO2I < 100 suggest tissues are not getting enough oxygen
 If VO2I < 100 suggest tissues are not getting enough oxygen.")
38
SvO2 VO2 SvO2 = 1- DO2

39
Oxycalculations

40
Resuscitation Goals CI = 4.5 L/min/m2 DO2I = 600 mL/min/m2
VO2I = 170 mL/min/m2 NOT ALL PATIENTS CAN ACHIEVE THESE GOALS Critically ill patients who can respond to their disease states by spontaneously or artificially meeting these goals do show a better survival.

41
Break Time…

42
“Shock is a symptom of its cause.”
-fccs course

43
Signs of Organ Hypoperfusion
Mental Status Changes Oliguria Lactic Acidosis

44
Components

45
Categories of Shock HYPOVOLEMIC CARDIOGENIC DISTRIBUTIVE OBSTRUCTIVE

46
Goals of Shock Resuscitation
Restore blood pressure Normalize systemic perfusion Preserve organ function

47
In general, treat the cause...

48
Hypovolemic Shock Causes hemorrhage vomiting diarrhea dehydration
third-space loss burns Signs cardiac output PAOP SVR

49
Classes of Hypovolemic Shock

50
Treatment - Hypovolemic
Reverse hypovolemia vs. hemorrhage control Crystalloid vs. Colloid PASG role? Pressors?

51
Resuscitation Transport times < 15 minutes showed pre-hospital fluids were ineffective, however, if transport time > 100 minutes fluid was beneficial. Penetrating torso trauma benefited from limited resuscitation prior to bleeding control. Not applicable to BLUNT victims.

52
Fluid Administration 1 L crystalloid 250 ml colloid
crystalloids are cheaper blood must supplement either FFP for coagulopathy, NOT volume Watch for hyperchloremic metabolic acidosis when large volumes of NaCl are infused NO survival benefit with colloids

53
Role of PASG? Houston - Higher mortality rate in penetrating thoracic, cardiac trauma No benefit in penetrating cardiac trauma Role undefined in rural, blunt trauma Splinting role

54
Cardiogenic Shock Cause Signs defect in cardiac function
cardiac output PAOP SVR left ventricular stroke work (LVSW)
")
55
Coronary Perfusion Pressure
Coronary PP = DBP - PAOP coronary perfusion = P across coronary a. GOAL - Coronary PP > 50 mm Hg

56
The Failing Heart Improve myocardial function, C.I. < 3.5 is a risk factor, 2.5 may be sufficient. Fluids first, then cautious pressors Remember aortic DIASTOLIC pressures drives coronary perfusion (DBP-PAOP = Coronary Perfusion Pressure) If inotropes and vasopressors fail, intra-aortic balloon pump
 If inotropes and vasopressors fail, intra-aortic balloon pump.")
57
Distributive Shock Types Signs Sepsis Anaphylactic
Acute adrenal insufficiency Neurogenic Signs ± cardiac output PAOP SVR

58
SIRS - Distributive Shock
Prompt volume replacement - fill the tank Early antibiotic administration - treat the cause Inotropes - first try Dopamine If MAP < 60 Dopamine = g/kg/min Norepinephrine = titrate (1-100 g/min) R/O missed injury
 R/O missed injury.")
59
Adrenal Crisis Distributive Shock
Causes Autoimmune adrenalitis Adrenal apoplexy = B hemorrhage or infarct heparin may predispose Steroids may be lifesaving in the patient who is unresponsive to fluids, inotropic, and vasopressor support. Which one?

60
Obstructive Shock Causes Signs Cardiac Tamponade Tension Pneumothorax
Massive Pulmonary Embolus Signs cardiac output PAOP SVR

61
Endpoints? ACS CoT ATLS - restoration of vital signs and evidence of end-organ perfusion Swan-guided resuscitation C.I. 4.5, DO2I 670, VO2I 166 Lactic Acid clearance Gastric pH

62
Summary Type PAOP C.O. SVR HYPOVOLEMIC CARDIOGENIC
DISTRIBUTIVE or N varies OBSTRUCTIVE

63
Vasopressor Agents? Augments contractility, after preload established, thus improving cardiac output. Risk tachycardia and increased myocardial oxygen consumption if used too soon Rationale, increased C.I. improves global perfusion

64
Vasopressors & Inotropic Agents
Dopamine Dobutamine Norepinephrine Epinephrine Amrinone

65
Dopamine Low dose (0.5 - 2 g/kg/min) = dopaminergic
Moderate dose (3-10 g/kg/min) = -effects High dose (> 10 g/kg/min) = -effects SIDE EFFECTS tachycardia > 20 g/kg/min to norepinephrine
 = -effects. High dose (> 10 g/kg/min) = -effects. SIDE EFFECTS. tachycardia. > 20 g/kg/min to norepinephrine.")
66
Dobutamine -agonist 5 - 20 g/kg/min
potent inotrope, variable chronotrope caution in hypotension (inadequate volume) may precipitate tachycardia or worsen hypotension
 may precipitate tachycardia or worsen hypotension.")
67
Norepinephrine Potent -adrenergic vasopressor
Some -adrenergic, inotropic, chronotropic Dose g/min Unproven effect with low-dose dopamine to protect renal and mesenteric flow.

68
Epinephrine - and -adrenergic effects
potent inotrope and chronotrope dose g/min increases myocardial oxygen consumption particularly in coronary heart disease

69
Amrinone Phosphodiesterase inhibitor, positive inotropic and vasodilatory effects increased cardiac stroke output without an increase in cardiac stroke work most often added with dobutamine as a second agent load dose = mg/kg g/kg/min drip main side-effect - thrombocytopenia

70
Dilators - inotropes + inotropes Pressors

71
Summary `pressors & inotropes
dilator Dobutamine Milrinone/Amrinone Labetalol Ca+2 blocker ACE inhibitor hydralazine nitroglycerine Nipride -dopamine Isuprel Digoxin Calcium -blocker - inotrope + inotrope epinephrine -dopamine norepinephrine pressor neosynephrine

72
Case Studies

73
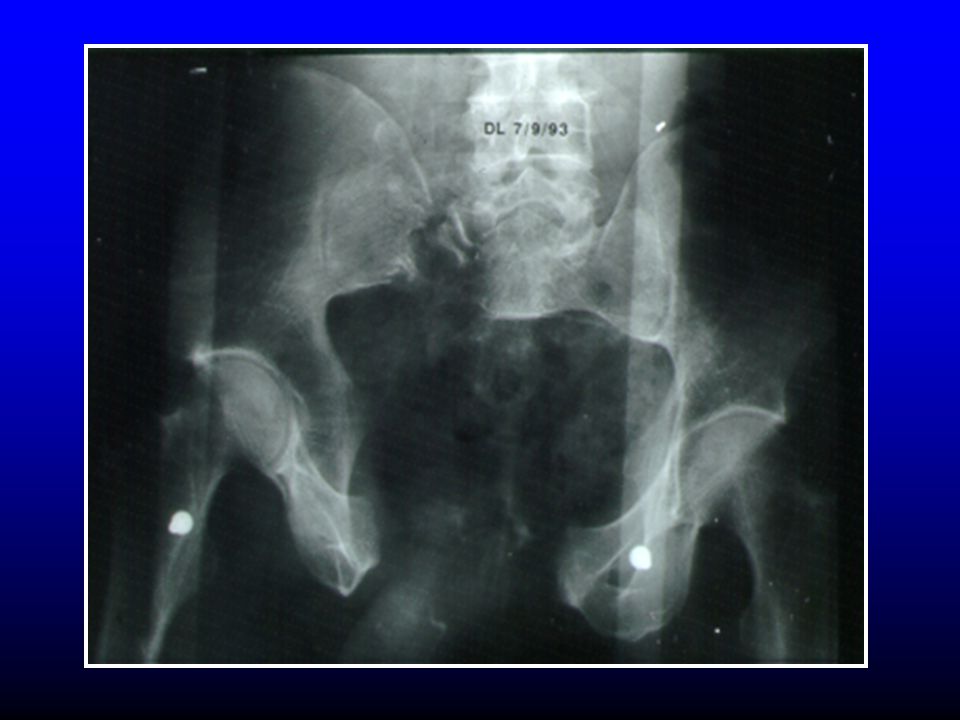
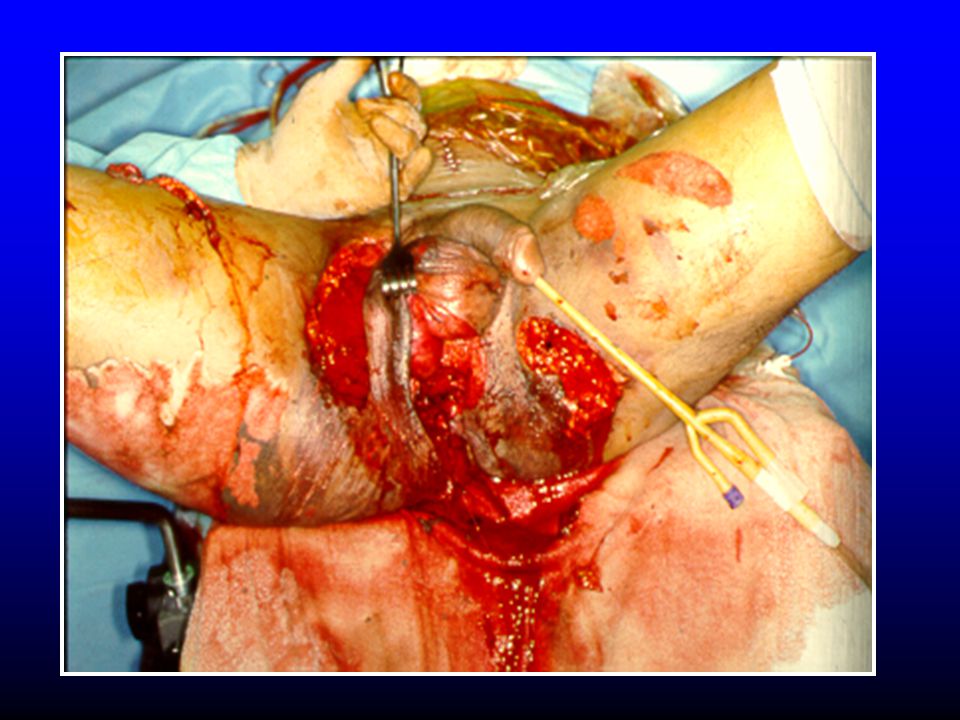
GSW 24 year old male victim of a shotgun blast to his right lower quadrant/groin at close range. Hemodynamically unstable in the field and his right lower extremity was cool and pulseless upon arrival to the trauma resuscitation area.

74
Shotgun Blast

75
Post-op Patient received 12 L crystalloid, 15 units of blood, 6 units of FFP, and 2 6 packs of platelets. HR 130, BP 96/48, T 34.7° C PAWP 8, CVP 6, CI 4.2, SVRI 2700, LVSWI 42. Diagnosis? Treatment?

76
SHOCK/HYPOVOLEMIA FLUIDS… FLUIDS… FLUIDS… BLOOD & PRODUCTS TRANSFUSION
CORRECT ACIDOSIS COAGULOPATHY HYPOTHERMIA

77
MVC 38 year old female restrained driver who was involved in a high speed MVC. She sustained a pulmonary contusion and fractured pelvis.

78
ICU Course Intubated and monitored with PA-C
PCWP = 22, CI = 3.5, SVRI = 2400, LVSWI = 39.8 HR = 120, BP = 110/56, SpO2 = 91, UOP = 25 cc/hr What do you think...

79
ADJUST YOUR WEDGE FOR THE PEEP
HYPOVOLEMIA ADJUST YOUR WEDGE FOR THE PEEP

80
Wedge Adjustment Measured PAOP - ½ PEEP = “real PAOP”
PEEP = 28, therefore “real wedge” = 8

81
Auto-Pedestrian Crash
Thrown from the rear bed of pick up truck during a MVC at 60 mph. Hemodynamically unstable Pain to palpation of the pelvis Hematuria with Foley® insertion

84
ICU Course Pelvis “closed” QID Dressings, intubated, PA-C inserted
PCWP = 20, CI = 5.2, SVRI = 280, LVSWI = 24.5, PEEP = 8 Diagnosis? Treatment?

85
Sepsis Fluids Correct the cause Vasopressors Antibiotics Debridement
Phenylephrine Levophed

86
Initial Resuscitation
CVP: mm Hg MAP 65 mm Hg UOP 0.5 cc/kg/hr Mixed venous Oxygen Sat 70% Consider: Transfusion to Hgb 10 Dobutamine up to 20 g/kg/min

87
Vasopressors Assure adequate fluid volume Administer via CVL
Do not use dopamine for renal protection Requires arterial line placement Vasopressin: Refractory shock Infusion rate 0.01 – 0.04 Units/min

88
Steroid Use in Sepsis Refractory shock mg/day of hydrocortisone in divided doses for 7 days ACTH test Once septic shock resolves, taper dose Add fludrocortisone 50 g po q day

89
Geriatric Trauma 70 year old female
MVC while talking on her cell phone ruptured diaphragm and spleen s/p OR Intubated and PA-C

90
ICU Course PCWP = 28, CI = 1.8, SVRI = 3150, LVSWI = 20.7
Diagnosis? Treatment?

91
Cardiogenic Shock Preload augmentation - Consider Fluids Contractility
dopamine dobutamine phosphodiesterase inhibitor Afterload reduction nitroglycerin

92
Shock: “rude unhinging of the machinery of life.”
Don’t forget... Shock: “rude unhinging of the machinery of life.” -Samuel D. Gross, 1872

Similar presentations


 CPP = aortic diastolic.>")


