Download presentation
Presentation is loading. Please wait.

1
Created by Lisa Bingham University of Stavanger, Norway
Maps and GIS Created by Lisa Bingham University of Stavanger, Norway Lisa Bingham Contact for questions, list of readings used in course, and labs or other assignments. Course originally planned for a 12-week Bachelor of Science degree in Petroleum Geoscience Engineering

2
Course Objectives Read, understand, and interpret maps
Basic understanding of GIS Basic understanding of GPS

4
Reading a map

5
Reading maps Maps relate information Investigate the map
It is up to the viewer to interpret the information How? Investigate the map Identify the parts of the map Familiarize yourself with the map Are there graphs? Inset maps? Additional figures? What is the purpose of the map? What does the map tell you? What information does it relate?

6
What makes a “good” map? Defined purpose and audience.
These influence what makes a “good” map for the intended audience. tourist vs. geologist Avoid cluttering or over-complications Legible labeling Coloring and patterns should follow cartographic conventions.

7
Features of a map A concise map title An easy to read scale bar
An easy to read legend, if necessary North arrow if the coordinate system is not clear or if the map is turned to an angle Legible coordinates at the border of the map Projection information

8
Identify the parts of a map
Locate: Title Scale Scale bar Legend Coordinate system or grid markings Location or inset map Publication information

9
publication information
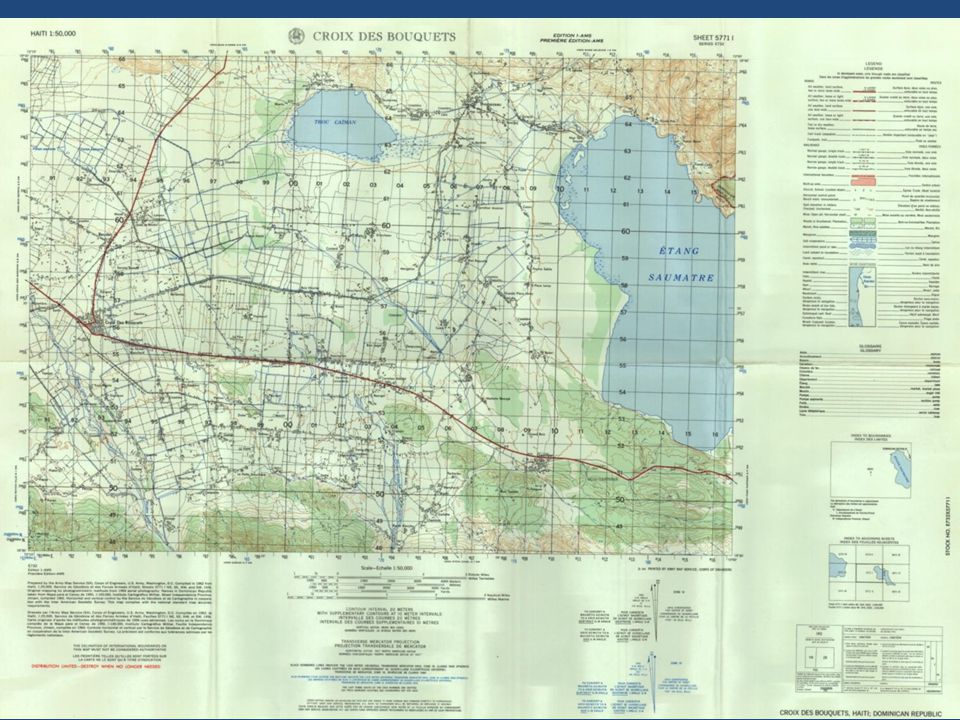
Where is the title? Title Where is the legend? Where is the inset map? Where is the scale bar? Scale Scale bar Where is the scale? Where are the grid coordinates? Where is the north arrow? Where is the publication information? Compiler and publication information Where are the graphs? Some maps have north arrows or compass roses, or may include projection information. This map does not. Legend Inset map Grid coordinates Graphs

10
Familiarize yourself with the map.

11
What does the map tell you?
Mineral-rich in the north Mineral-poor in the center Minerals in the south What does the map tell you? Diamonds with gold in the northeast Gold in north-central If you represented a mining company, where would you look for: gold? diamonds? bauxite? radioactive minerals? Mica-rich in the south Diamond production decreasing

12
Understanding Map Scales
Representations: verbal (1 map centimeter represents 30,000 ground centimeters) fraction (1:25,000) graphic (scale bar) Map scale indicates how much a given distance was reduced to be represented on the map.
 fraction (1:25,000) graphic (scale bar) Map scale indicates how much a given distance was reduced to be represented on the map.")
13
Understanding Map Scales
Small-scale map depicts large areas, so low resolution. 1:10,000,000

14
Understanding Map Scales
Large-scale map depicts small areas, so high resolution. 1:50,000 1,267 inches to 1 mile

15
Small-scale vs. Large-scale Maps
When the scale is written as a fraction, is the fraction very small or very large? 1/1,000 1/100,000 1/1,000,000 1/5,000,000 1/10,000,000 Identifying a map as small- or large-scale is an exercise of relativity

16
Reading Map Contours First familiarize yourself with the map
Locate the contour interval Investigate the contours Are they close together? Far apart? Are the very straight? Are there many concentric circles? Do the contours shape like V’s or U’s?

18
Elevation Contour

19
What can be said about the elevation in this area (northeast corner of the previous map)?
")
20
What can be said about the elevation in this area (northeast corner of the previous map)?
V shape Steep slopes Coastline V shape Less steep area

21
What can be said about the elevation in this area (central area of the large map)?
")
22
Steeper area with very curvy contours High point or depression?
What can be said about the elevation in this area (central area of the large map)? Flat area Coastline Flat area Steeper area with very curvy contours High point or depression?
 Flat area. Coastline. Flat area. Steeper area with very curvy contours. High point or depression")
23
High point or depression?

24
Understanding Coordinate Systems

25
What is a coordinate system?
A mathematical system used to explain the location of a point on the earth (or other planet). A geographic coordinate system is used to assign geographic locations to objects. A global coordinate system of latitude-longitude is one such framework. Another is a planar or Cartesian coordinate system derived from the global framework.
. A geographic coordinate system is used to assign geographic locations to objects. A global coordinate system of latitude-longitude is one such framework. Another is a planar or Cartesian coordinate system derived from the global framework.")
26
Latitude facts: Lines of latitude (parallels) are evenly spaced from 0o at equator to 90o at poles. 60 nautical miles (~ 110 km)/1o, ~1.8 km/minute and ~ 30 m/second of latitude. N. latitudes are positive, S. latitudes are negative. Equator From M. Helper, University of Texas, 2008
/1o, ~1.8 km/minute and ~ 30 m/second of latitude. N. latitudes are positive, S. latitudes are negative. Equator. From M. Helper, University of Texas,")
27
Longitude facts: Lines of longitude (meridians) converge at the poles; the distance of a degree of longitude varies with latitude. Zero longitude is the Prime (Greenwich) Meridian (PM); longitude is measured from 0-180o east and west of the PM. East longitudes are positive, West longitudes are negative. P.M. 180o From M. Helper, University of Texas, 2008
 Meridian (PM); longitude is measured from 0-180o east and west of the PM. East longitudes are positive, West longitudes are negative. P.M. 180o. From M. Helper, University of Texas,")
28
Units of Measure Decimal degrees (DD), e.g. - 90.50o, 35.40o
order by longitude, then latitude Format used by ArcGIS software Degrees, Minutes, Seconds (DMS), e.g. – 90o 30’ 00”, 35o 24’ 00” From M. Helper, University of Texas, 2008
, e.g. – 90o 30’ 00 , 35o 24’ 00 From M. Helper, University of Texas,")
29
What is a map projection?
A map projection is used to portray all or part of the round Earth on a flat surface. This cannot be done without some distortion. Every projection has its own set of advantages and disadvantages. There is no "best" projection. The mapmaker must select the one best suited to the needs, reducing distortion of the most important features.

30
Laying the earth flat Why?
Need convenient means of measuring and comparing distances, directions, areas, shapes. Traditional surveying instruments measure in meters or feet, not degrees of longitude and latitude. Globes are bulky and can’t show detail. 1:24,000 globe would have diameter of ~ 13 m Typical globe has scale of ~ 1:42,000,000 Distance & area computations more complex on a sphere. From M. Helper, University of Texas, 2008

31
Laying the earth flat How?
Using projections – transformation of curved earth to a flat map; systematic rendering of the longitude and latitude graticule to rectangular coordinate system. Scale 1: 42,000,000 Scale Factor (for specific points) Map Earth Globe Globe distance Earth distance Map distance Globe distance Mercator Projection From M. Helper, University of Texas, 2008
 Map. Earth. Globe. Globe distance Earth distance. Map distance Globe distance. Mercator Projection. From M. Helper, University of Texas,")
32
Inflatable globe demonstration
Blown up and Cut up Use a beach ball globe to demonstrate the flattening of a globe. Start with a blown up beach ball. Let the students investigate. Then show a cut up beach ball. You could if you have the resources, cut the ball in front of the students.

33
Laying the earth flat Systematic rendering of Latitude (f) & Longitude (l) to rectangular (x, y) coordinates: y 0, 0 x Geographic Coordinates (f, l) Projected Coordinates (x, y) Map Projection From M. Helper, University of Texas, 2008
 Projected Coordinates (x, y) Map Projection. From M. Helper, University of Texas,")
34
Laying the earth flat “Geographic” display – no projection
x = l, y = f Grid lines have same scale and spacing l f y x From M. Helper, University of Texas, 2008

35
“Geographic” Display Distance and areas distorted by varying amounts (scale not true); e.g. high latitudes l f y x From M. Helper, University of Texas, 2008

36
Projected Display E.g. Mercator projection: f x = l
90 5+ E.g. Mercator projection: x = l y = ln [tan f + sec f] y From M. Helper, University of Texas, 2008

37
Laying the earth flat How? Projection types: Orthographic Gnomonic
Stereographic a A’ A’ A’ a a T’ T’ T’ T T T b B’ B’ b b B’ From M. Helper, University of Texas, 2008

38
Inflatable globe demonstration
Light shines through Use a beach ball that has the top cut out. Dangle a light bulb inside and outside.

39
Projection produces distortion of:
Distance Area Angle Shape Distortions vary with scale; minute for large-scale maps (e.g. 1:24,000), gross for small-scale maps (e.g. 1: 5,000,000) Goal: find a projection that minimizes distortion of property of interest From M. Helper, University of Texas, 2008
, gross for small-scale maps (e.g. 1: 5,000,000) Goal: find a projection that minimizes distortion of property of interest. From M. Helper, University of Texas,")
40
How do I select a projection?
Scale is critical – projection type makes very little difference at large scales For large regions or continents consider: Latitude of area Low latitudes – normal cylindrical Middle latitudes – conical projection High latitudes – normal azimuthal Extent Broad E-W area (e.g. US) – conical Broad N-S area (e.g. S. America) – transverse cylindrical Theme e.g. Equal area vs. conformal (scale same in all directions) From M. Helper, University of Texas, 2008
 – conical. Broad N-S area (e.g. S. America) – transverse cylindrical. Theme. e.g. Equal area vs. conformal (scale same in all directions) From M. Helper, University of Texas,")
41
How to know which map projection to use?
General guide: Conventions for different areas or fields of study

42
Overall View of GIS

43
Key Questions and Issues
What is GIS? What are the applications of GIS? How is the real world represented in GIS? What analyses can GIS perform?

44
What does GIS stand for? GIS is an acronym for “Geographic Information System”

45
What is GIS? Computerized management and analysis of geographic information Group of tools (and people) for collection, management, storage, analysis, display and distribution of spatial data and information Computer-based tool for mapping and analyzing things that exist and events that happen Refer to readings for other definitions From M. Helper, University of Texas, 2008
 for collection, management, storage, analysis, display and distribution of spatial data and information. Computer-based tool for mapping and analyzing things that exist and events that happen. Refer to readings for other definitions. From M. Helper, University of Texas,")
46
GIS Software There are several GIS software programs available for use. Open source (not necessarily free) MapServer TerraView Quantum GIS UDig Proprietary software IDRISI GMT Manifold MapPoint ESRI (used in class)
")
47
GIS Example From M. Helper, University of Texas, 2008

48
A GIS is Composed of Layers
Geology DEM Digital elevation model Hydrography Roads From M. Helper, University of Texas, 2008

49
Features have locations
Stavanger X = m Y = m X axis Origin (0, 0) Y axis From M. Helper, University of Texas, 2008
 Y axis. From M. Helper, University of Texas,")
50
Spatial relationships can be queried
What crosses what? Proximity – What is within a certain distance of what? Containment - What’s inside of what? Which features share common attributes? Many others From M. Helper, University of Texas, 2008

51
Remember GIS focuses on geographic information
If something has a location or is associated with a location, it can be mapped.

52
Key Questions and Issues
What is GIS? What are the applications of GIS? How is the real world represented in GIS? What analyses can GIS perform?

53
The Global Positioning System
From M. Helper, University of Texas, 2008

54
GPS Facts of Note Today ~30 satellites for GPS
USA Department of Defense navigation system First launch on 22 Feb 1978 Originally 24 satellites Today ~30 satellites for GPS From M. Helper, University of Texas, 2008

55
GPS Milestones 1978: First satellites launched 1983: GPS declassified
1989: First hand-held receiver 1991: S/A activated (large error in location) 1993: GPS constellation fully operational : First hand-held, “mapping-grade” receivers : GPS on a microchip 1997: First $100 hand-held receiver 2000: S/A off (more accuracy) GPS – Milestones 1978: First 4 satellites launched 1983: GPS declassified - Korean airliner shot down over Soviet airspace - first civilian receivers : Challenger Disaster hiatus 1989: First hand-held receivers – Magellan 1991: S/A activated; DGPS becomes essential for surveying and mapping 1993: I buy my first GPS receiver – Trimble Scout 1993: GPS constellation full operational status (24 SVs; 5-8 visible anywhere, anytime) : First hand-held, “mapping-grade” receivers (DGPS capable, data dictionary). : GPS on a chip developed –receivers can use external CPUs 1997: First hand-held receivers for under $100 2000: integration of GPS and cellular technology 2000: SA is turned off; inexpensive GPS receivers horizontal accuracy increased from ~ 100 meters to meters – detailed mapping with a single receiver possible 2003: FAA commissions WAAS – Free wide-area DGPS - properly equipped receiver can obtain horizontal precision of m, vertical precision of 7 m. “Survey-grade” equipment no longer needed for all but most precise work. From M. Helper, University of Texas, 2008
 1993: GPS constellation fully operational : First hand-held, mapping-grade receivers : GPS on a microchip. 1997: First $100 hand-held receiver. 2000: S/A off (more accuracy) GPS – Milestones. 1978: First 4 satellites launched. 1983: GPS declassified - Korean airliner shot down over Soviet airspace - first civilian receivers : Challenger Disaster hiatus. 1989: First hand-held receivers – Magellan. 1991: S/A activated; DGPS becomes essential for surveying and mapping. 1993: I buy my first GPS receiver – Trimble Scout. 1993: GPS constellation full operational status (24 SVs; 5-8 visible anywhere, anytime) : First hand-held, mapping-grade receivers (DGPS capable, data dictionary) : GPS on a chip developed –receivers can use external CPUs. 1997: First hand-held receivers for under $ : integration of GPS and cellular technology. 2000: SA is turned off; inexpensive GPS receivers horizontal accuracy increased from ~ 100 meters to meters – detailed mapping with a single receiver possible. 2003: FAA commissions WAAS – Free wide-area DGPS - properly equipped receiver can obtain horizontal precision of m, vertical precision of 7 m. Survey-grade equipment no longer needed for all but most precise work. From M. Helper, University of Texas,")
56
GPS Segments Space – Satellites (SVs).
Control – Ground stations track SV orbits and monitor clocks, then update this info for each SV, to be broadcast to users. User – GPS receivers convert SV signals into position, velocity and time estimates. From M. Helper, University of Texas, 2008

57
How are SV and receiver clocks synchronized?
Clock errors will cause spheres of position (solid lines) to miss intersecting at a point. Adjust receiver clock slightly forward will cause larger DT(=larger sphere; dashed) and intersection at point. Requires 4 SVs, not 3 as shown, for clock error & X, Y, Z From M. Helper, University of Texas, 2008
 to miss intersecting at a point. Adjust receiver clock slightly forward will cause larger DT(=larger sphere; dashed) and intersection at point. Requires 4 SVs, not 3 as shown, for clock error & X, Y, Z. From M. Helper, University of Texas,")
58
Satellite Positioning
Observe DT Orbit Known Determine Geocenter From M. Helper, University of Texas, 2008

59
3-D (X, Y, Z) One-way Ranging
Intersection of 2 spheres of position yields circle Intersection of 3 spheres of position yields 2 points of location One point is position, other is either in space or within earth’s interior With earth ellipsoid (4th sphere) Get receiver clock synchronized and X & Y but no Z Intersection of 4 spheres of position yields XYZ and clock synchronization From M. Helper, University of Texas, 2008
 Get receiver clock synchronized and X & Y but no Z. Intersection of 4 spheres of position yields XYZ and clock synchronization. From M. Helper, University of Texas,")
60
Tropospheric Delay (~ 0.5 m)
Sources of Error Satellite Orbit Errors (~2.5 m) SV clock error (~1.5 m) L2 L1 50 km Ionospheric Refraction (~ 5 m) (Can correct with L1 & L2 DTs) 200 km Tropospheric Delay (~ 0.5 m) Multipathing (~0.5 m) + GDOP (errors x 4-6) (Geometric dilution of precision) From M. Helper, University of Texas, 2008
 SV clock error (~1.5 m) L2. L1. 50 km. Ionospheric Refraction (~ 5 m) (Can correct with L1 & L2 DTs) 200 km. Tropospheric Delay (~ 0.5 m) Multipathing (~0.5 m) + GDOP (errors x 4-6) (Geometric dilution of precision) From M. Helper, University of Texas,")
61
Satellite Constellation
Must have a good spread of satellites

62
GPS Resolution and Map Scales
From M. Helper, University of Texas, 2008

63
Familiarization with GIS
Software used is ESRI ArcGIS, but concepts are the same with any GIS software program.

64
Vector data

65
Vector data An x, y coordinate system references the real-world location. Shapefiles and feature classes (file types) are vector data. Appropriate for discrete data where boundaries are needed. Pipeline location.

66
Raster data

67
Raster data Assign a value to a cell.

68
Raster data Raster data may be a georeferenced jpg or tiff, or a converted ASCII grid. Appropriate for continuous data where discrete boundaries are not necessary. Topography Grid files Cells contain Z data. The smaller a cell size, the higher the resolution.

69
Practical uses of raster data
Simple display of a raster Topography (elevation) Bathymetry (depth) Gravity Magnetic anomalies
 Bathymetry (depth) Gravity. Magnetic anomalies.")
70
Advanced uses of raster data
Additional processing of raster Changes in morphology Sediment thickness Hill shades (Creating texture) Contours Topographic profiles Spatial analysis Map algebra
 Contours. Topographic profiles. Spatial analysis. Map algebra.")
71
Using Satellite Data with GIS
Oman GPS Data Datapoints Tracks Remote Sensing Data Satellite images RADAR Beijing, China

72
Using Satellite Data with GIS
Digitize buildings and roads Digitize faults, scarps, rivers, or elevation Beijing, China Oman

73
ArcMap document Title bar Map area Table of contents Coordinates

74
Acquiring External Data
Government and non-government agencies may provide free GIS data Quality Map purpose influences acceptable quality

75
General Websites: Shapefiles
Norwegian Petroleum Directorate GIS Data Depot data.geocomm.com DIVA-GIS Norwegian Geological Survey (NGU) United States Geological Survey Many others
 United States Geological Survey Many others.")
76
General Websites: X,Y Data (Need Converting)
USGS NEIC Earthquake Database

77
General Websites: Grids (May Need Converting)
General Bathymetric Chart of the Oceans (GEBCO) CGIAR-CSI SRTM Processed NASA satellite topography data Scripps Institution of Oceanography NGDC World Magnetic Anomaly Map
 CGIAR-CSI SRTM Processed NASA satellite topography data Scripps Institution of Oceanography NGDC World Magnetic Anomaly Map")
78
General Websites: Maps (Need georeferencing)
The University of Texas at Austin Perry-Castañeda Library Map Collection Google Image search

79
Identify features Select the identify tool. Click on a feature.

80
Why select features? Create subsets Find data
Find counts of data with certain attributes Find data near a location

81
Select by attributes Use Select by Attributes wizard
Use when attribute values are known and assigned Can be unique

82
Select by location Use select by Location wizard Location with buffers
What is a buffer? Location with respect to another dataset

83
Creating and editing shapefiles
Not all data that is needed for a mapping project will be available in GIS format Some data is extremely expensive to buy Some data is not available for purchase Sometimes the GIS technician needs to create new data based on other map layers

84
Georeferencing

85
What is Georeferencing?
It is a process by which locational information (geo) is added (reference) to an image (raster) in a GIS program. A point on the image is assigned a coordinate pair in two ways: By lining up the image to a feature By adding coordinates directly
 is added (reference) to an image (raster) in a GIS program. A point on the image is assigned a coordinate pair in two ways: By lining up the image to a feature. By adding coordinates directly.")
86
For Example: Align raster image to vector data (shapefile or feature)
")
87
Nature of the problem: Data source registration may differ by:
Rotation Translation Distortion Translation Rotation Differential Scaling Skew Distortion From M. Helper, University of Texas, 2008

88
General problem is then:
Control Points “Displacement Link” (0,1) (1,1) (501000, ) (0,0) (1,0) (498100, ) Source (x, y) Destination (X’, Y’) (“Warp”) From M. Helper, University of Texas, 2008
 (1,1) (501000, ) (0,0) (1,0) (498100, ) Source (x, y) Destination (X’, Y’) ( Warp ) From M. Helper, University of Texas,")
89
What images to use? Trusted sources (published maps from map agencies)
Clear coordinate system markings (Decimal degrees for Geographic Coordinate Systems; Meters for UTM and Mercator, but need a reasonable guess of UTM zone or Mercator) Clear country boundaries, city locations, major roads, major rivers
 Clear country boundaries, city locations, major roads, major rivers.")
90
What images to discard? Sketchy sources (personal websites or unpublished sources) Blurry, coarse or very thick country boundaries. These are usually over-generalized. Maps that rely on other maps to show their locations (over-use of inset maps) Exceptions: Very old maps which are not available in an updated form!
 Exceptions: Very old maps which are not available in an updated form!")
91
Digitizing from Georeferenced Image
Obtain information that has not been published in GIS Obscure publication or out-of-print publication Error margin depends on overall scale of data (global vs continental vs regional vs country/state vs town)
")
92
Practice: Good or Bad?

93
Practice: Good or Bad?

Similar presentations


 W (Want to know) L (What I learned) Warm up- take out a piece of paper and do the “K” and the “W” for the above topic.>")


