Download presentation
Presentation is loading. Please wait.

1
2nd Coal Conference By: B.M.VERMA Advisor- Essar Power (M.P.) Limited Ex- Chairman Jharkhand State Electricity Board Ex- Chairman & Managing Director Uttarakhand Power Corporation Limited Contact: /
 Limited Ex- Chairman Jharkhand State Electricity Board Ex- Chairman & Managing Director Uttarakhand Power Corporation Limited Contact: /")
5
DEMAND AND SUPPLY

6
Consumer Expectations
Reliable & Quality Power Faster Fault Removal Consumer Relationship Easy Mechanism of Attribute Change Quick Grievance Redressal Correct Billing Payments Convenience Easy New Connection Transparent Meters Reading We Interact, We Listen, We Learn, We Act….

7
SHORTAGE / ROSTERING (IN MW)
SHORTAGE / ROSTERING (IN MW) Unrestricted Drawl Schedule Rostering Rostering Overdrawl 7 8 9 10 11 1 18 19 20 21 Gross Shortage Gross Shortage
 Unrestricted Drawl. Schedule. Rostering. Rostering. Overdrawl Gross Shortage. Gross Shortage.")
8
POWER CUT Date: 06-04-06 & 07-04-06 Power Cut Unrestricted Demand
Demand Met (Total Availability) Hydro Gen. Net Import from Grid Time in Hrs.
 Hydro Gen. Net Import from Grid. Time in Hrs.")
9
KING COAL ! Reserves Proven 91 billion Tons Indicated 116 billion Tons
Inferred 37 billion Tons TOTAL 245 billion Tons Coal reserves: > 250 years at present levels of consumption Concentrated in Eastern India

10
CAPACITY ADDITION DURING XIITH PLAN (2012 - 2017)
TOTAL CAPACITY ADDITION PLANNED (MW) THERMAL HYDRO NUCLEAR XIITH 82200 40200 30000 12000
 THERMAL. HYDRO. NUCLEAR. XIITH")
11
Coal Units in 12th Plan It is estimated to commission
12 Nos. units of 660MW (XIIth Plan) 31 Nos. units of 800MW (XIIth Plan)
 31 Nos. units of 800MW (XIIth Plan)")
12
UMPP on Imported Coal PPP PROJECTS: Ultra Mega Power Projects: Three Ultra Mega Power Projects awarded through tariff based bidding only Mundra is progressing fast –Project: 4000 MW Power Project in Mundra, Gujarat –Cost: USD4 billion –Status: 1st. Unit Commissioned in February 2012 Problem due to increase in cost of Imported Coal.

13
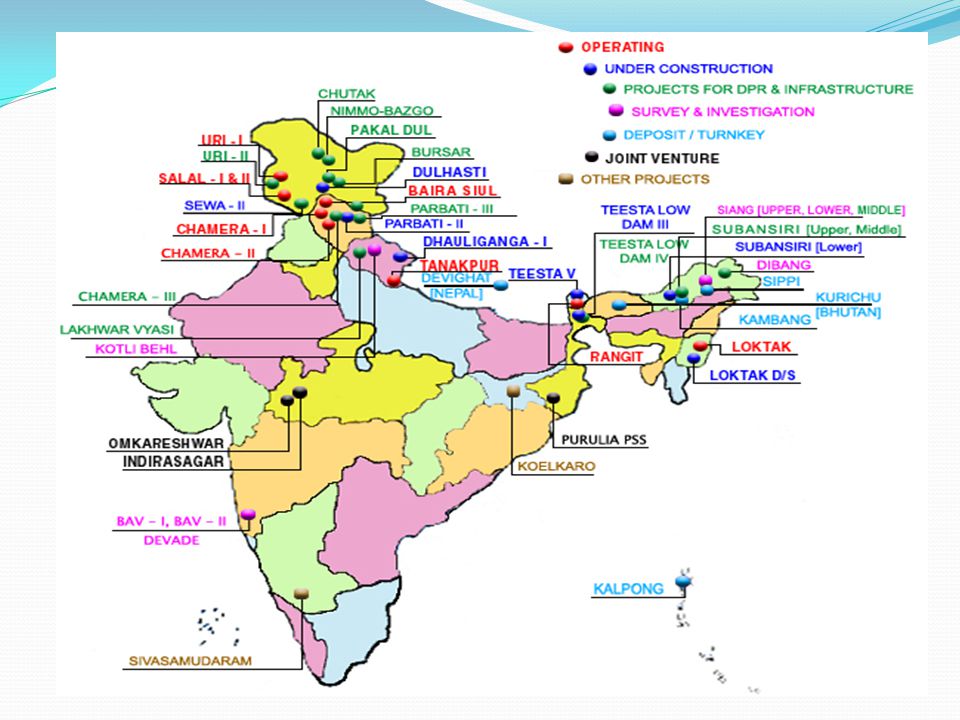
Hydro-Electricity Inferred potential > 120 GW
Installed capacity 30 GW Most big projects are in North-Eastern states of Arunachal Pradesh, Sikkim, Uttaranchal and J&K Problems of rehabilitation and resettlement with large projects Environmental issues Water sharing agreements with neighbors National Hydro Power Corporation, Government of India

15
Other OPTIONS

16
Indian power sector is passing through a very critical phase .

17
Capacity Addition Scenario

18
Impact of Enabling Environment
30 number of Case-1 and Case-2 bids have been concluded PPA’s have been executed for an aggregate capacity of 41,059 MW including Ultra Mega Power Projects Case 1- 14,819 MW Case 2- 10,240 MW UMPP – 16,000 MW However, conditions and premises under which the bidding documents were prepared and under which the bids were submitted have changed drastically over the last 5-6 years, necessitating a relook.

19
What are the Challenges
Tariff Adjustment – A Necessary Evil? What Needs to be Done Why It Needs to be Done What are the Challenges One Time Tariff Hike Tariff hikes critical to avoid contagion – risk of loan defaults, worsening of power deficit etc Higher tariffs for existing Case I/II PPAs may still be cheaper than tariffs discovered in a fresh bid process Why should Discoms pay for poor fuel risk assessment by IPPs How to identify which projects need bailout – even sound projects would want a tariff hike Opposition from losing bidders in a project Would tantamount to favoring the private sector – politically sensitive Comprehensive Tariff Policy Existing tariff policies, although sound, have not accounted for uncertainties such as short supply by Coal India or changes in international regulations An “all-weather” tariff policy critical to attract long term investor interest in power generation Source: IDFC Presentation on Power, March 2012

20
Coal Balance for the XIIth Plan
In order to meet this shortage of 238 MT for domestic coal based plants, the Working Group on Power for 12th Plan estimates an import requirement of 159 MT after adjusting for GCV. An additional 54 MT is likely to be imported for plants based on imported coal, thus bringing the total import requirement to 213 MT.

22
Summary of Mercados Report on Feasibility of Large Scale Coal Imports
Description Total Domestic Thermal Coal Requirement (MT) 526 584 634 701 839 Total Coal Supply including from Captive Blocks (MT) 387 422 457 492 579 Total Coal Shortage (MT) 139 161 176 209 260 Key Assumptions Coal requirement of existing linkage based plants (99,436 MW as of Jan CV of 3000 kcal/kg is 487 MT. Captive mine linked projects (5800 MW) is 28 MT, thus total of 515 MT. Plant by plant analysis performed to estimate future requirements. Linkage coal supply estimates by based on 90% of ACQ for plants commissioned before Mar 2009 and 80% of ACQ for plants commissioned after Mar 2009 (based on Prime Minister/President directive) However, the domestic coal shortfall of 260 MT cannot be directly met by imports due to technical constraints on blending of imported coal. By considering average blending limit of 15% for existing plants and 30% for upcoming plants, imported coal requirement works out to be 111 MT (including the demand for imported coal based projects). This indicates ~26,000 MW coal based capacity is expected to remain stranded by The XII Plan Working Group Report’ import estimation of 213 MT does not seem practically possible under current blending constraints. Nevertheless, if such a scenario arises where the country needs to import ~213 MT coal, capacity constraints in inland transport infrastructure would not permit this to happen.
 Total Coal Supply including from Captive Blocks (MT) Total Coal Shortage (MT) Key Assumptions. Coal requirement of existing linkage based plants (99,436 MW as of Jan CV of 3000 kcal/kg is 487 MT. Captive mine linked projects (5800 MW) is 28 MT, thus total of 515 MT. Plant by plant analysis performed to estimate future requirements. Linkage coal supply estimates by based on 90% of ACQ for plants commissioned before Mar 2009 and 80% of ACQ for plants commissioned after Mar 2009 (based on Prime Minister/President directive) However, the domestic coal shortfall of 260 MT cannot be directly met by imports due to technical constraints on blending of imported coal. By considering average blending limit of 15% for existing plants and 30% for upcoming plants, imported coal requirement works out to be 111 MT (including the demand for imported coal based projects). This indicates ~26,000 MW coal based capacity is expected to remain stranded by The XII Plan Working Group Report’ import estimation of 213 MT does not seem practically possible under current blending constraints. Nevertheless, if such a scenario arises where the country needs to import ~213 MT coal, capacity constraints in inland transport infrastructure would not permit this to happen.")
23
As power, coal and gas are regulated sectors the government has to make the power sector in sync with the ground realities of fuel availability and its pricing and bring about necessary measures to improve the financial condition of the distribution utilities so that they have the ability to procure power for the end consumers.

24
Coal Issues Being Faced by Power Producers in the Country

25
Today the major challenge before the power developer is to arrange adequate quantity and appropriately priced fuel for power generation

26
Shortage of Domestic Coal – Current Situation
FSAs for 305 MT have been signed for ~ 68,000 MW capacity commissioned prior to 31 March 2009 A total capacity of 25,500 MW expected to be commissioned after March 2009 and before March 2012 have LOAs executed but are pending FSAs 68,000 MW 11,500 MW 14,000 MW TOTAL 93,000 MW 411 MT Deficit of 64 MT coal due to which 22,000 MW capacity is not operating at optimal capacity Shortage of domestic coal has led to unwillingness of CIL to provide firm commitment for supply of 100% of normative requirements (as mandated under NCDP). Thus 33 thermal plants commissioned between FY09 and FY10 do not have FSA signed.
. Thus 33 thermal plants commissioned between FY09 and FY10 do not have FSA signed.")
27
Shortage of Domestic Coal – XIIth Plan
Linkage coal based plants where activities have been initiated and likely to be commissioned during 12th Plan period = 40,000 MW requiring 167 MT Plants where LOA has been issued but no construction activities initiated = 31,000 MW requiring 144 MT Requirement of linkage coal by end of 12th Plan period = 722 MT Looking at the fact that 83% of the 12th Plan capacity addition is based on coal, it is estimated that the total coal deficit will be 238 MT by the end of 2017 As per R.K. Pachauri (Director General, TERI), India will be importing 1400 MT of coal and 750 MT of oil by 2030, which will cost the nation 20% of the GDP
, India will be importing 1400 MT of coal and 750 MT of oil by 2030, which will cost the nation 20% of the GDP.")
28
Reasons for the Shortage (1/4)
Unprecedented growth in Private Sector generation capacity addition Delays in Environmental Clearances Stagnant Production by Coal India

29
Reasons for the Shortage (2/4)
Unprecedented growth in Private Sector generation capacity addition Original overall capacity addition target was 78,700 MW out of which private sector target was 15,043. Private sector target was revised to 19,800 MW as per Mid Term Appraisal (MTA) of Planning Commission Out of ~ 54,300 MW capacity commissioned during XIth Plan till , private sector contribution has been a massive 28,280 MW Increasing contribution of private sector in the total capacity addition M W Source: CEA
 of Planning Commission. Out of ~ 54,300 MW capacity commissioned during XIth Plan till , private sector contribution has been a massive 28,280 MW. Increasing contribution of private sector in the total capacity addition. M W. Source: CEA.")
30
Reasons for the Shortage (3/4)
Environmental Clearances Critical coal bearing areas stuck under MoEF notification on Jan 2010 dealing with Comprehensive Environment Pollution Index (CEPI) led to critical coal bearing areas stuck. Out of 43 areas with a CEPI score of more than 70, seven coalfields – Chandrapur, Korba, Dhanbad, Talcher, Singrauli, IB Valley and Asansol were impacted and had a moratorium on mining placed on them. MoEF classified some coal mining areas as ‘No-go’ based on their location with respect to dense forest areas. 203 coal blocks were identified as No-go areas thus having a serious impact on coal production Total coal bearing area in India (sq km) 17,300 Total no. of coal blocks in India 602 No. of blocks identified in No-Go 203 Spread over in area (sq km) 3,039 Annual Production Potential (MT) 660
 led to critical coal bearing areas stuck. Out of 43 areas with a CEPI score of more than 70, seven coalfields – Chandrapur, Korba, Dhanbad, Talcher, Singrauli, IB Valley and Asansol were impacted and had a moratorium on mining placed on them. MoEF classified some coal mining areas as ‘No-go’ based on their location with respect to dense forest areas. 203 coal blocks were identified as No-go areas thus having a serious impact on coal production. Total coal bearing area in India (sq km) 17,300. Total no. of coal blocks in India No. of blocks identified in No-Go Spread over in area (sq km) 3,039. Annual Production Potential (MT) 660.")
31
Reasons for the Shortage (4/4)
Stagnant Production by Coal India CIL production has remained static ~ 535 MT in last two years. Monopolistic market design and lack of competition has kept productivity and efficiency much below global norms. Dominance of open cast mining due to short term and cost benefits – deeper coal reserves remain inaccessible.

32
Logistical Issues Is Imported Coal a Viable Option? (1/4)
Energy Security Resource Nationalization – Indonesia, Australia, South Africa Forex Outgo – Coal Import Bill could touch Rs 150,000 Cr Price Volatility – Global Coal Markets Technical Limitations – Equipment design Restrictions on export, additional customs and duties etc Almost 1/3rd of current crude import bill Most plants can take up to 28% imported coal max Distribution utilities to get exposed to fluctuating price risks Logistical Issues Port-rail connectivity is a serious constraint in coal evacuation from ports

34
Is Imported Coal a Viable Option? (2/4)
Increasing Coal Prices due to Resource Nationalism Indonesia introduced regulations on Price Fixing of Coal and Minerals Selling Price in 2010, according to which all coal mining licence holders are obliged to sell coal at a rate higher than a determined reference price. Indonesia’s Mining Law additionally imposed a Domestic Market Obligation under which coal mining companies are required to allocate coal as per Government decree for the domestic market prior to any export deals Australia has imposed a fixed carbon tax of A$23 a tonne from July 2012 onwards. A Mineral Resources and Rent Tax (MRRT) has also been made applicable to iron ore and coal mining business whose annual profits exceed $50 million. Forex Outgo Coal import bill for FY12 (uptil Oct 2011) was ~ Rs 40,000 Crores, almost 40% more than the imports during the same period of the previous fiscal and almost 1/3rd of the current crude oil import bill. Unless domestic coal production is augmented, the coal import bill could rise to Rs 150,000 Crores
 has also been made applicable to iron ore and coal mining business whose annual profits exceed $50 million. Forex Outgo. Coal import bill for FY12 (uptil Oct 2011) was ~ Rs 40,000 Crores, almost 40% more than the imports during the same period of the previous fiscal and almost 1/3rd of the current crude oil import bill. Unless domestic coal production is augmented, the coal import bill could rise to Rs 150,000 Crores.")
35
Is Imported Coal a Viable Option? (3/4)
Price Volatility Volatility in internationally traded coal prices has increased significantly since 2008 as compared to and recent coal price index movements have been highly volatile on a month to month basis. US$/T

36
Is Imported Coal a Viable Option? (4/4)
Logistical Constraints Port-Rail Connectivity – railways account for the inland haulage of only 24% of port cargo (with large chunk linked to the major ports) indicating the weak rail connectivity to ports other than the major ports Inland Rail Infrastructure – Transportation of imported coal to the consumption centers is a major road block. There are seven major trunk routes via which coal is transported in the country. These routes cater to more than 90% of the total coal requirement and are already operating at 100% capacity utilisation. Technical Constraints in Blending While domestic coal shortfall is expected to reach 260 MT by the end of the 12th Plan, technical constraints in blending will limit the use of imported coal to a maximum of 30% in plants set up on the assurance of domestic coal. Thus blending possibility will be restricted and there will be a risk of ~ 30,000 MW capacity getting stranded.
 indicating the weak rail connectivity to ports other than the major ports. Inland Rail Infrastructure – Transportation of imported coal to the consumption centers is a major road block. There are seven major trunk routes via which coal is transported in the country. These routes cater to more than 90% of the total coal requirement and are already operating at 100% capacity utilisation. Technical Constraints in Blending. While domestic coal shortfall is expected to reach 260 MT by the end of the 12th Plan, technical constraints in blending will limit the use of imported coal to a maximum of 30% in plants set up on the assurance of domestic coal. Thus blending possibility will be restricted and there will be a risk of ~ 30,000 MW capacity getting stranded.")
37
Other Issues related to Coal Shortage
Non Adherence to New Coal Distribution Policy (NCDP) FSA documents as proposed by CIL is not in consonance with the NCDP NCDP mandated FSA for Power Valid for 20 years from Apr 09 OR life of the facility, whichever earlier Provision for review of terms of FSA every 5 years ACQ level typically 90% Penalties in case of shortfall 85-90% - 10% penalty 80-85% - 20% penalty <80% - 40% penalty CIL Proposed FSA for Power Valid for period of 5 years from date of execution Provision for review after 3 years of completion ACQ levels sought to be set at 50% <50% - 10% penalty Impact of the above documents Complete uncertainties regarding fuel supply – projects will not be bankable Projects under competitive bidding will not know on what basis to bid for fuel cost Very serious cost push for retail tariff Technical limitations to designing boilers which can run efficiently with such varied and uncertain coal parameters
 FSA documents as proposed by CIL is not in consonance with the NCDP. NCDP mandated FSA for Power. Valid for 20 years from Apr 09 OR life of the facility, whichever earlier. Provision for review of terms of FSA every 5 years. ACQ level typically 90% Penalties in case of shortfall % - 10% penalty % - 20% penalty. <80% - 40% penalty. CIL Proposed FSA for Power. Valid for period of 5 years from date of execution. Provision for review after 3 years of completion. ACQ levels sought to be set at 50% <50% - 10% penalty. Impact of the above documents. Complete uncertainties regarding fuel supply – projects will not be bankable. Projects under competitive bidding will not know on what basis to bid for fuel cost. Very serious cost push for retail tariff. Technical limitations to designing boilers which can run efficiently with such varied and uncertain coal parameters.")
38
Suggested Measures to Increase Domestic Coal for 11th Plan Projects
Divert E-auction coal to supply under FSAs/LOAs Coal India sold 45 MT under e-auction route in , just over 10% of its total production Diversion of 50% of E-auction coal could potentially add ~22 MT of coal to coal supplies under linkages (FSAs/LOAs) Reduce normative quantity under FSAs for projects already commissioned A 10% reduction in normative quantities under FSA for projects already commissioned before 31st March 2009 can add ~ 30 MT of coal for supplies under linkages Above measures will increase coal supply under linkage by ~ 52 MT thus reducing the coal import requirement for the 11th Plan projects to ~ 12 MT. This will reduce the cost impact of imports as well as relieve the pressure of blending constraints.
 Reduce normative quantity under FSAs for projects already commissioned. A 10% reduction in normative quantities under FSA for projects already commissioned before 31st March 2009 can add ~ 30 MT of coal for supplies under linkages. Above measures will increase coal supply under linkage by ~ 52 MT thus reducing the coal import requirement for the 11th Plan projects to ~ 12 MT. This will reduce the cost impact of imports as well as relieve the pressure of blending constraints.")
39
Suggested Measures to Increase Domestic Coal for 12th Plan Projects
Increasing Coal India’s production output Adopting MDO (Mine Developer and Operator) system Introducing Competition in Coal Sector Other related sectors such as power generation, oil & gas etc have benefited from an increase in competition through private sector participation. Accelerating Captive Coal Block Development Incentivize surplus coal production from captive mines through appropriate pricing clarity Expedite e-auctioning of coal blocks in a manner to ensure a level playing field while minimizing impact on tariffs Reserving coal blocks for the regulated sectors Environmental Clearances Expedite E&F clearances for coal bearing areas by cutting down procedural delays while keeping safeguards intact Allow parallel processing of Forestry and Environmental clearances for both Coal block projects as well as end use projects such as power plants. Creating Level Playing Field for Private Sector 12th Plan coal linkage policy should give weightage to best performing projects , irrespective of their belonging to Central, State or Private sector.
 system. Introducing Competition in Coal Sector. Other related sectors such as power generation, oil & gas etc have benefited from an increase in competition through private sector participation. Accelerating Captive Coal Block Development. Incentivize surplus coal production from captive mines through appropriate pricing clarity. Expedite e-auctioning of coal blocks in a manner to ensure a level playing field while minimizing impact on tariffs. Reserving coal blocks for the regulated sectors. Environmental Clearances. Expedite E&F clearances for coal bearing areas by cutting down procedural delays while keeping safeguards intact. Allow parallel processing of Forestry and Environmental clearances for both Coal block projects as well as end use projects such as power plants. Creating Level Playing Field for Private Sector. 12th Plan coal linkage policy should give weightage to best performing projects , irrespective of their belonging to Central, State or Private sector.")
40
Conclusion To conclude, generation capacity addition plans, currently on the anvil clearly point to a continued dominance of coal as a fuel source. Growing demand – supply gap in the domestic coal sector; high price scenario, volatility and logistical challenges associated with the imported coal and consequent concerns on energy security, underscore the need for accelerated development of domestic coal resources. Any delay in initiating steps for augmenting domestic coal production would jeopardize the capacity addition and adversely impact economic growth

41
Primary energy consumption per capita

42
ELECTRIC POWER REQUIREMENTS
Required for 8% economic growth by 2015: Installed Capacity 250 GW Generation billion kWh Per Capita Consumption 1000 kWh

43
India’s Future Growth India needs sustained economic growth > 8% to radically improve its Human Devp Index Growth in last few years ~ 5%-7% Growth hampered by infrastructure: electric power Peak shortfall Average shortfall High T&D Losses: Unscheduled black-outs, especially in rural areas Supply to agriculture sector not metered and almost free

44
GROWTH AREAS Present growth is skills or resource driven (exports: software, gems and jewels, garment manufacture) Future Growth will have to be on value addition & engineering Rural sector to play a major role (agricultural and dairy produce; minimizing wastage and improving efficiency) Infrastructure building (roads, buildings, railroads etc.,) Manufacturing The elasticity has to be greater than 1 for powering future growth
 Infrastructure building (roads, buildings, railroads etc.,) Manufacturing The elasticity has to be greater than 1 for powering future growth.")
45
Elasticity and Electric Power Needs
Target economic growth ~ 8% Elasticity of electricity with GDP stabilizing at ~ 1.2 Implications for future electric power requirements by 2015: Capacity addition Investments Fuel mix Pricing and Policies T&D reforms

46
The Task Ahead Need To Add : 13.5 GW per annum
135 GW in ten years 13.5 GW per annum One Power Plant (1.1 GW)/mth Maximum added till now is 4,600 MW (One in four months) ( China adds one per week !! )
/mth. Maximum added till now is 4,600 MW (One in four months) ( China adds one per week !! )")
47
FUEL SUPPLY: OPTIONS FOR FUTURE
Coal Conventional Gasification Natural Gas Hydro Nuclear PHWR + FB + AHWR PLWR Wind On-shore Off-shore Biomass Solar Photo voltaic Concentrating Solar Power Fuel Present In 2015 Coal 67,166 MW ? Gas 11,840 MW Hydro 30,135 MW Nuclear 2,720 MW Wind 2,488 MW Biomass 1,000 MW Solar - TOTAL 115,035 MW 250,000 MW

48
ALL INDIA GENERATION CAPACITY (ALL FIG. IN MW)
")
49
Indian Energy Scenarios: 2015
Same Fuel Mix as now Aggressive Nuclear Capacity Addition

50
Investment Opportunities
Coal Based 660/600 MW Sets Jharkhand Orissa Chhattisgarh Madhya Pradesh All other states on linkage Import Coal Based Power Station on the Coast Line

51
ULTRA MEGA POWER PROJECT

53
Hydro-Electricity Inferred potential > 120 GW
Installed capacity 30 GW Most big projects are in North-Eastern states of Arunachal Pradesh, Sikkim, Uttaranchal and J&K Problems of rehabilitation and resettlement with large projects Environmental issues Water sharing agreements with neighbors National Hydro Power Corporation, Government of India

54
STATUS OF HYDRO POWER DEVELOPMENT FOR STATES HAVING POTENTIAL MORE THAN 5000 MW

55
STATUS OF HYDRO POTENTIAL DEVELOPMENT IN ARUNACHAL PRADESH (ALL FIG
STATUS OF HYDRO POTENTIAL DEVELOPMENT IN ARUNACHAL PRADESH (ALL FIG. IN MW)
")
56
Biomass India predominantly agricultural country.
Annual production of agro-forest and processing residues: 350 million tons Power generation potential > 22,000 MW Advantages: Decentralized generation: close to rural load centers. Technology reasonably well developed Environmentally friendly: No net CO2 emissions Feedstock Examples Potential Installed Agro-forest residues Wood chips, mulberry, coconut shells 17,000 MW 50 MW Processing residues Rice husk, sugarcane bagasse 5,000 MW 1000 MW

57
GENERATE CHEAPER, EFFICIENT AND RELIABLE POWER THROUGH
SUSTAINABLE SOLUTION GENERATE CHEAPER, EFFICIENT AND RELIABLE POWER THROUGH CO-GENERATION

58
GLOBAL SCENARIO BIOMASS constitutes around 14% of the world energy and 38% of the energy consumed by the developing countries Biomass conversion technologies for commercial energy production have attracted attention the world over in recent times especially on account of rapid rise in fossil fuel prices About 10000mw of power generation capacity has been installed in USA and Europe Sporadic efforts in other countries including Phillippines, Thailand, Canada and China have been made. Multifuel cogeneration plants of higher capacities are established.

59
Wind Energy World Wind Installed Capacity (2005) Gross potential : 45,000 MW (assuming 1% land availability in potential areas) Technical potential : 13,000 MW (assuming 30% grid penetration in potential areas) Rapid growth in installed capacity from 1990s India ranks 5th in the world Present installed capacity ~ 3000 MW Site selection issues: More from fiscal benefits than from power Many plants not operating Low average load factor~13% Global Wind Energy Council
 Rapid growth in installed capacity from 1990s. India ranks 5th in the world. Present installed capacity ~ 3000 MW. Site selection issues: More from fiscal benefits than from power. Many plants not operating. Low average load factor~13% Global Wind Energy Council.")
60
Transmission

61
Tramission lines in Private Sector
Number of Transmission lines are being offered to Private Sector.

62
Existing Transmission and Future Expansion (Ckt.km)
lines E xis ting (C kt.km) Addition Total M arc h 765 kV 1704 5428 7132 HVDC 500 KV 5872 5206 11078 HVDC 200 KV 162 - 400 KV 75722 49278 125000 220 KV 114629 35371 150000 Total c km 198089 95283 293372
 Addition Total. M arc h. 765 kV HVDC 500 KV HVDC 200 KV KV KV Total c km")
63
National Grid by 2012

64
Distribution

65
Nation without Electricity
The country is reeling under a severe power shortage that has forced people to suffer long power cuts as fuel scarcity has hit Generation and precarious health of utilities has Ravaged the finances and payment Schedules in the sector. Deficit in North 3,000 MW Heat Wave Way Forward Policy & Regulatory Issues Fuel Shortage Subsequent graphs show power cuts even at night

66
Consumer Expectations
Reliable & Quality Power Faster Fault Removal Consumer Relationship Easy Mechanism of Attribute Change Quick Grievance Redressal Correct Billing Payments Convenience Easy New Connection Transparent Meters Reading We Interact, We Listen, We Learn, We Act….

67
Delhi Model Delhi has been divided into three distribution Companies
BSES Rajdhani BSES Yamuna NDPL Delhi has been reduce their AT&C losses Establishment of separate courts for Electricity Special Powers to Distribution officers Use of Technology for services.

68
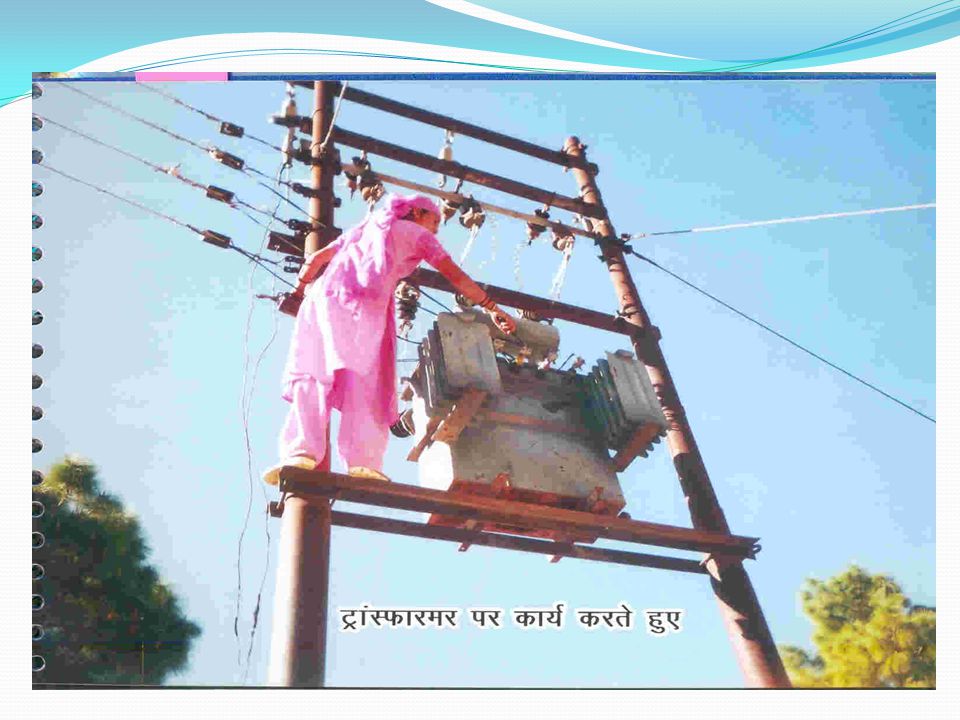
FRANCHISEE MODEL Number of cities are being offered on Input based Franchiee . Bhiwandi is good example Agra has been given to Torrent. Improvement is already noticed. Urban Cities are of interest to many players, but what about Rural Areas Uttarakhand had earlier handed over the Bill Reading , Bill Distribution , minor maintenance to Women Self Help Groups which improved the services in the rural areas.

69
AT & C Loss Reduction

70
ROSTERING

72
SHORTAGE / ROSTERING (IN MW)
SHORTAGE / ROSTERING (IN MW) Unrestricted Drawl Schedule Rostering Rostering Overdrawl 7 8 9 10 11 1 18 19 20 21 Gross Shortage Gross Shortage
 Unrestricted Drawl. Schedule. Rostering. Rostering. Overdrawl Gross Shortage. Gross Shortage.")
73
POWER CUT Date: 06-04-06 & 07-04-06 Power Cut Unrestricted Demand
Demand Met (Total Availability) Hydro Gen. Net Import from Grid Time in Hrs.
 Hydro Gen. Net Import from Grid. Time in Hrs.")
76
Franchisee - Urban Rural ?

79
Coal Mining

80
Clearances and Permissions
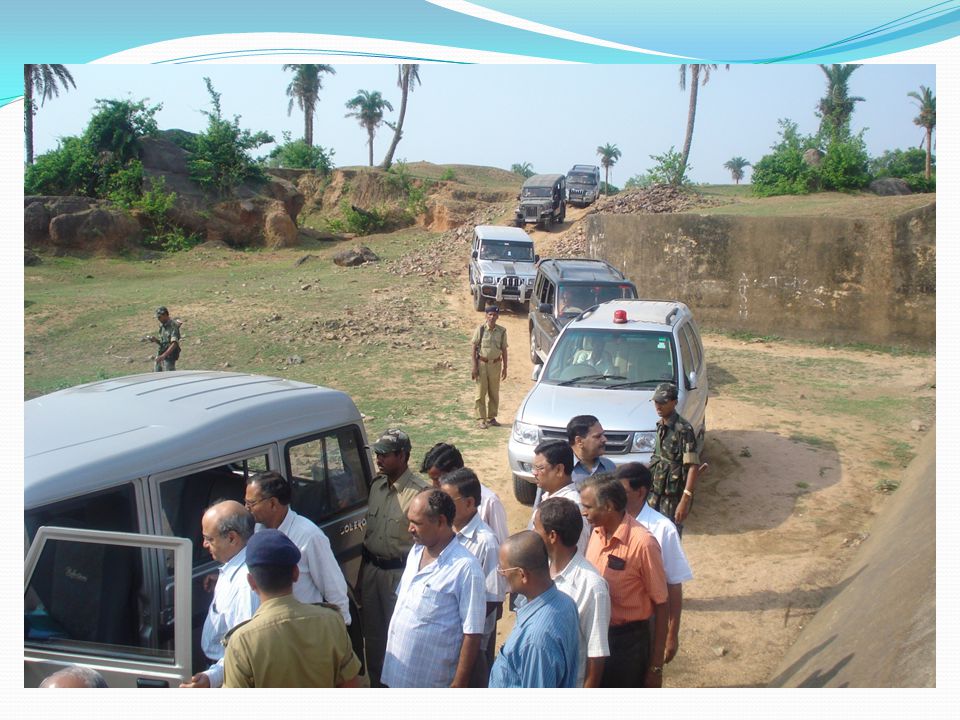
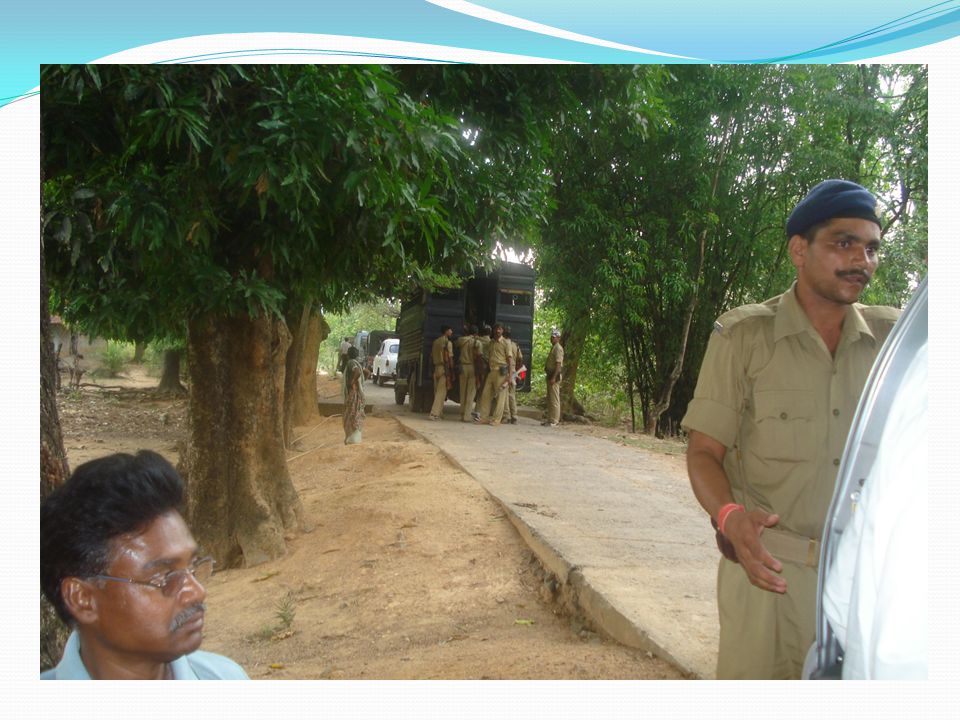
Extremely Time Consuming Forest Clearance Concept of No/No Go Forest Rights Act Security Issues Subsequent Photographs show the security issues in one of the mines. Matching of Development of Coal Mine with Power Plant.

86
IN SHORT…………… NO POWER IS COSTLIER THAN “NO POWER”

87
LET US JOIN TO KEEP THE BULB GLOWING

88
THANK YOU! This is not… THE END
It’s just a beginning of the NEW POWER ERA THANK YOU!

90
Clearances and Permissions
Extremely Time Consuming Forest Clearance Concept of No/No Go Forest Rights Act Security Issues Subsequent Photographs show the security issues in one of the mines. Matching of Development of Coal Mine with Power Plant.

Similar presentations


, Government of India November 16, 2006 Power Ministers’ Conference on.>")
 Presentation Title ( Arial, Font size 28 ) Date, Venue, etc..( Arial, Font size 18 ) Impact of Shortage of Coal.>")


