Download presentation
Presentation is loading. Please wait.

1
Dealing with Time and Temperature Dependence
Design With Viscolelastic Materials Dealing with Time and Temperature Dependence

2
Design with Viscoelastic Materials
How are Properties Defined? Introduction to Viscoelasticity Strain Rate and Temperature Effects Simple Material Models Empirical Methods

3
Learning Objectives Upon completion of this session, participants will be able to: Describe how temperature and loading rate affect mechanical properties. Define creep and stress relaxation and describe design situations for each. Apply manufacturer’s data to design for applications in both short term and long term loading. Relate data from creep curves and isochronous stress strain curves. Apply snap fit design guidelines.

4
Review Basic definitions: thermoplastic, thermoset, elastomer.
Let’s talk about the kind of mechanical behavior seen in polymers. Strength Stiffness Ductility Factors which can determine the strength of a polymer.

5
Tensile Properties for Polymers
Polymer Yield Strength is defined by the first peak on the stress strain diagram, not the 0.2% offset used for metals.

6
Strength is: A measure of stress (load per unit area with units of ksi or MPa) Yield Strength (1st peak in uniaxial tension test) Ultimate Tensile Strength (Highest stress in uniaxial tension test)
")
7
Stiffness is: Young’s Modulus (Elastic Modulus), E with units of ksi or MPa The slope of the straight line part of the stress-strain curve The ratio of stress to strain (where strain is the change in length with respect to the original length, ΔL/L0) E
 E.")
8
Ductility is: % Elongation (with units of in/in or mm/mm)
The permanent percentage change on length after fracture (from a uniaxial tension test) ΔL/L
 ΔL/L.")
9
Mechanical Properties
brittle polymer Stress-strain behavior of polymers FS of polymer ca. 10% that of metals plastic elastomer elastic modulus – less than metal Adapted from Fig. 15.1, Callister 7e. Strains – deformations > 1000% possible (for metals, maximum strain ca. 10% or less)
")
10
Question

11
Introduction to Viscoelasticity
Mechanical properties depend on Temperature Mechanical properties depend on Strain Rate Creep (progressive change in strain at constant stress) Stress Relaxation (progressive change in strain at constant strain) Hysteresis (significant difference in load and unload stress-strain curves)
 Stress Relaxation (progressive change in strain at constant strain) Hysteresis (significant difference in load and unload stress-strain curves)")
12
Effect of Temperature on Strength
As Temperature Increases Strength Decreases Stiffness Decreases Ductility Increases “Celanese Nylon 6/6 Processing and Troubleshooting Guide” by Ticona

13
Time Temp for Delrin (Strain Rate)

14
Effects of Strain Rate and Temperature
stress Increasing strain rate Increasing temp strain

15
Time Temp for Delrin (Strain Rate and Temp)

16
Time Temp Dependence Plastic deformation of polymers involves chain uncoiling and chain sliding Increasing temperature increases relative space between chains and makes uncoiling easier. Slowing the strain rate means there is more time for chain reconfiguration.

17
Questions

18
Creep Take a tension specimen made from a polymer and apply a constant stress. We observe Creep: Progressive strain (deformation) over time at constant stress (load), usually at high temperatures
 over time at constant stress (load), usually at high temperatures.")
19
Creep Test We instantly load with constant stress for a certain time, and instantly unload. Note that both linear elastic and viscous fluid behaviors are present. Note that there seems to be some residual strain at the end, i.e. the material does not completely recover. There is both elasticity and plasticity.

20
Load-Unload Cycle in Nylon
“Zytel/Minlon Design Guide” DuPont

21
Creep of PEEK “PEEK Properties Guide” Victrex

22
Write down two examples of parts that see constant tensile or bending load.

23
Stress Relaxation Note that both linear elastic and viscous fluid behaviors are present. Note that there seems to be some residual stress at the end, i.e. the material does not completely recover. There is both elasticity and plasticity. Think of a polymer specimen loaded with a constant strain. Stress Relaxation: Progressive loss of stress (load) over time under constant strain (deformation), usually at high temperatures
 over time under constant strain (deformation), usually at high temperatures.")
24
Stress Relaxation of Delrin

25
Write down two examples of parts that see constant strain.

26
Questions

27
Time Dependent Deformation
• Stress relaxation test: • Data: Large drop in Er for T > Tg. (amorphous polystyrene) Adapted from Fig. 15.7, Callister 7e. (Fig is from A.V. Tobolsky, Properties and Structures of Polymers, John Wiley and Sons, Inc., 1960.) 10 3 1 -1 -3 5 60 100 140 180 rigid solid (small relax) transition region T(°C) Tg Er (10s) in MPa viscous liquid (large relax) -- strain to eo and hold. -- observe decrease in stress with time. time strain tensile test eo s(t) • Relaxation modulus: • Sample Tg(C) values: PE (low density) PE (high density) PVC PS PC - 110 - 90 + 87 +100 +150 Selected values from Table 15.2, Callister 7e.
 Adapted from Fig. 15.7, Callister 7e. (Fig is from A.V. Tobolsky, Properties and Structures of Polymers, John Wiley and Sons, Inc., 1960.) rigid solid. (small relax) transition. region. T(°C) Tg. Er (10s) in MPa. viscous liquid. (large relax) -- strain to eo and hold. -- observe decrease in. stress with time. time. strain. tensile test. eo. s(t) • Relaxation modulus: • Sample Tg(C) values: PE (low density) PE (high density) PVC. PS. PC Selected values from Table 15.2, Callister 7e.")
28
Effect of Temperature-Glass Transition
Or why does Garden Hose behave the way it does? Vinyl Garden hose can go from flexible to rigid as the seasons change.

29
Glass Transition Temperature
Many amorphous materials show a change in behavior as the material changes from viscous to rigid. For polymers, the rigid behavior below Tg results from the inability of the chains to move easily (chains have insufficient free volume to coil and uncoil).
.")
30
Melting Temperature For polymers, Tmelt usually refers to the transition from semicrystalline to fully amorphous rather than a solid to liquid transformation. Thus, a melting temperature may not be reported for an amorphous polymer, and some polymers may be both liquid and crystalline. (Some companies report a crystalline temperature and a melting temperature.)
")
31
Melting vs. Glass Transition Temp.
What factors affect Tm and Tg? Both Tm and Tg increase with increasing chain stiffness Chain stiffness increased by Bulky sidegroups Polar groups or sidegroups Double bonds or aromatic chain groups Regularity – effects Tm only Adapted from Fig , Callister 7e.

32
Tg and Tm

33
Questions

34
Hysteresis Polymers often don’t load and unload on the same line on the stress-strain curve. The difference in areas under those curves represents energy loss (often to heat). This means that polymers can have inherent energy damping. This means plastic springs may not be as good an idea as plastic dampers.
. This means that polymers can have inherent energy damping. This means plastic springs may not be as good an idea as plastic dampers.")
35
Sinusoidal Response Tests
We have a polymer specimen experiencing a sinusoidal loading. Note that there is a phase shift, and that there is also hysteresis indicating that energy is being dissipated cyclically. This all suggests some simple material models.

36
Hysteresis in Delrin “Delrin Design Guide” DuPont

37
Time Dependent Response can be Modeled
Maxwell Model Kelvin-Voight Model 4 Element Model

38
Maxwell Model Here is an alternative to the simple spring model of linear elasticity. Add a damper. This gives what is called as the Maxwell model. In the limit, it’s a fluid! strain stress Stress relaxation is not bad Creep not too good! time time

39
Kelvin-Voigt Model Try putting the spring and damper in series This gives the Kelvin-Voigt model. In the limit, it’s a solid! strain stress Doesn’t really show stress relaxation! time time

40
4 Element Model Standard Linear Solid
Further improvement is possible. Shows both creep and stress relaxation! stress strain time

41
Stress Strain Relationships
We can get stress from strain history and strain form stress history through the following heriditary relationships. K is creep modulus, and F is the relaxation modulus.

42
Examples of These Time Dependent Moduli
Material Creep Modulus Relaxation Modulus Maxwell Kelvin Voigt Standard Linear Solid H(t) is the unit step function. d(t) is the Dirac delta function
 is the unit step function. d(t) is the Dirac delta function.")
43
More on the material models
Testing needs to be done to fit the parameters of the model to the behavior of an actual material. Note the fact that the history of the material must be recorded to be able to complete the calculations. Some additional complexity. The parameters in the creep modulus and relaxation modulus are Temperature Dependent Strain Rate Dependent

44
Summary Polymers exhibit: Great sensitivity to temperature.
Great sensitivity to strain rate. Very complex behavior Model parameters are difficult to determine – Therefore we will use an empirical approach.

45
Without Effective Math Models we will rely on Manufacturers Data to make Design Decisions
What are the limitations of Material Data Sheets? What do the polymer companies recommend? How do companies report time and temperature dependent properties? Designing using Creep information.

46
Empirical approach Use published information on behavior
Suppliers data sheets Suppliers creep curves

47
What can we learn from Supplier Data Sheets
Polymer parts in service will generally have lower material property values Strength, Stiffness, and Impact Energy than the ones listed in the Supplier Data Sheet.

48
What are the problems for Strength and Stiffness values?
Tested at a single temperature (usually room temp) Tested at a single strain rate. Polymer flow is in the direction of loading (advantage of molecular alignment) Effects of colorants and other additives
 Tested at a single strain rate. Polymer flow is in the direction of loading (advantage of molecular alignment) Effects of colorants and other additives.")
49
Impact data may thickness sensitive.
Polycarbonate Resin – Product Brochure, Sabic

50
Impact Data may Depend on Notch Radius
Delrin Design Guide, DuPont

51
Polymer Flow Affects Properties

52
What does the Designer Do?
From Lavengood and Silver in “Interpreting supplier Data Sheets”, ASM Engineered Material Handbook, Polymers: Tensile and Flexural moduli “may be used directly in design calculations for items that do not carry sustained loads and are not exposed to elevated temperatures or adverse environmental factors.” In other words, we can use the supplier data for a clean, dry, indoor application of primarily decorative function.

53
Company Recommendations
General Design Principles for DuPont Engineering Polymers

54
Company Recommendations – Preliminary Design
What safety factors do these numbers represent? Designing with Plastics, The Fundamentals - Ticona

55
What do Plastics Companies Recommend?
Checklists Use of Creep Curves Confirm by Testing

56
Checklist from Bayer

57
From the DuPont Checklist

58
DuPont Checklist-Mechanical

59
DuPont Checklist-Environment

60
Other DuPont Checklists
Writing Meaningful Specifications A specification is intended to satisfy functional, aesthetic and economic requirements by controlling variations in the final product. The part must meet the complete set of requirements as prescribed in the specifications. The designers’ specifications should include: • Material brand name and grade, and generic name (e.g., Zytel® 101, 66 nylon) • Surface finish • Parting line location desired • Flash limitations • Permissible gating and weld line areas (away from critical stress points) • Locations where voids are intolerable • Allowable warpage • Tolerances • Color • Decorating considerations • Performance considerations General Design Principles for DuPont Engineering Polymers
 • Surface finish. • Parting line location desired. • Flash limitations. • Permissible gating and weld line areas (away from. critical stress points) • Locations where voids are intolerable. • Allowable warpage. • Tolerances. • Color. • Decorating considerations. • Performance considerations. General Design Principles for DuPont Engineering Polymers.")
61
DuPont Example General Design Principles for DuPont Engineering Polymers

62
Long Term Properties for Example
General Design Principles for DuPont Engineering Polymers

63
General Design Principles for DuPont Engineering Polymers

64
General Design Principles for DuPont Engineering Polymers

65
General Design Principles for DuPont Engineering Polymers

66
How Do Companies Report Time and Temperature Dependent Properties?
Creep Curves (Strain vs. Time) Isochronous Stress Strain Curves Creep Modulus (Modulus vs. Time) Stress Relaxation Curves (Stress vs. Time) All curves must contain information on: Stress, Strain, Time, Temperature
 Isochronous Stress Strain Curves. Creep Modulus (Modulus vs. Time) Stress Relaxation Curves (Stress vs. Time) All curves must contain information on: Stress, Strain, Time, Temperature.")
67
Data is usually taken in a creep test and replotted for the other graphs.
Designing with Plastics, The Fundamentals - Ticona

68
Creep Curve Creep curves show the data as it was most likely measured, as strain vs. time for constant stress. “PEEK Properties Guide” Victrex

69
Isochronous Stress-Strain Curves
Creep data is plotted as constant time (isochronous) stress vs strain curves at a given temperature
 stress vs strain curves at a given temperature.")
70
Creep Modulus vs. Time Creep Stress is divided by strain at a given time to determine a “Creep” modulus.

71
Exercise Confirm that the Creep Modulus Curve is a replotting of the Isochronous Stress-strain Curve. Use the data shown on the Isochronous curve for Apec 1745 polycarbonate to create the 15 Mpa line on the Creep Modulus plot for Apec 1745.

72
Stress Relaxation Curve
Stress Relaxation should be tested under constant strain, but most reported results and replotted creep curves.

73
Designing with Celcon - Ticona
Where do these ratios come from? Talk to the supplier.

74
Designing with Celcon - Ticona

75
A BASF Approach to Design
A method described in BASF’s document, “Review of mathematical design methods for thermoplastic machine parts”, uses multiplied “efficiency factors” to account for the effects of long-term loading, temperature, or strain rate. These factors multiply together in a manner you may have seen before in fatigue design.

76
A BASF Approach to Design
The design stress is the published strength, K, divided by the safety factor and the product of all the “efficiency factors”.

77
Suggested Safety factors

78
Efficiency factors As can be seen below, the efficiency factors can add 50 to 300% each to the safety factor,

79
Cumulative Effect of Factors
If we start with a factor of safety of 3 on bending and buckling and have efficiency factors of 1.5 for sustained loading, 1.5 for dynamic loads, and 1.25 for temperature, we would have an effective Safety Factor of about 8. This is consistent with the preliminary design guidelines we saw earlier.

80
Snap Fits Types of Snap Fits Snap Fit Issues Snap Fit Calculators

81
Types of Snap fit -Annular Snap Fit

82
Types of Snap Fit - Cantilever Snap Fit

83
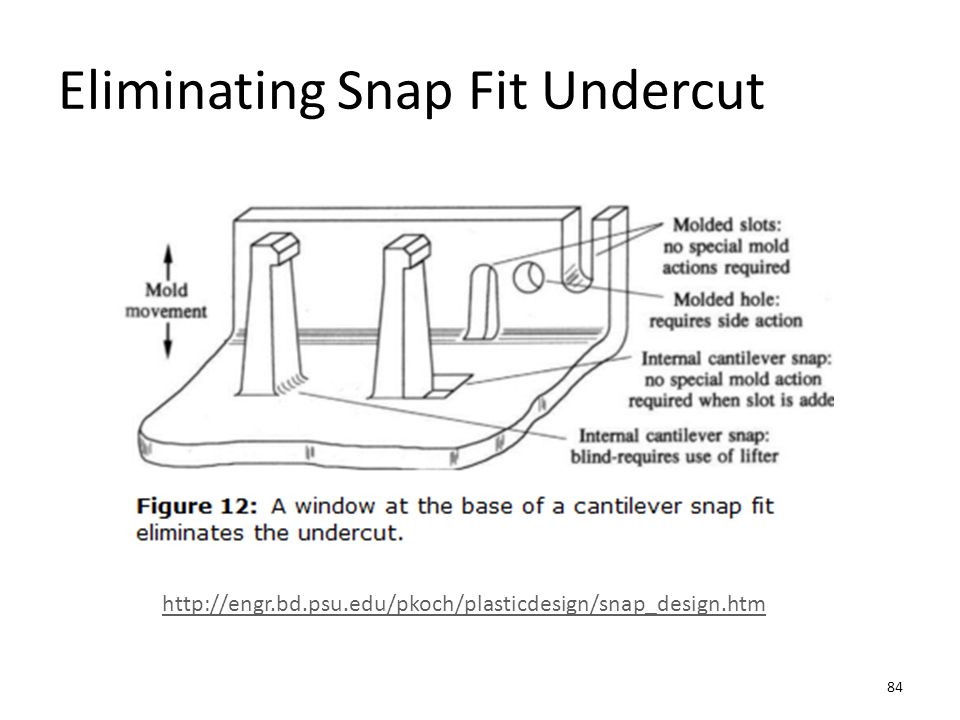
Snap Fit Issues Integral Fastener Can be designed for disassembly
Snap fits represent an undercut that complicates molding Snap fits that remain under load will stress relax

84
Eliminating Snap Fit Undercut
85
Dealing with Snap Fit Undercut

86
Snap Fit Calculators Manufacturers have design guidelines
Type “Snap Fit Calculator” in to Google will get plenty of hits Most are a modification of cantilever beam analysis

88
BASF Definition of Terms
Snap-Fit Design Manual, BASF Plastics

89
Classical Beam Theory Snap-Fit Design Manual, BASF Plastics

90
“Improved” Method Snap-Fit Design Manual, BASF Plastics

91
BASF’s “Improved Canitlever Snap-Fit Design”.
The Q factor accounts for the flexibility of the part. Note that Example 1 has the least flexibility, so the Q factor is close to a value of one. From: Snap-Fit Design Manual, BASF Plastics

92
Snap Fit - BASF Snap-Fit Design Manual, BASF Plastics

93
Snap-Fit Design Manual, BASF Plastics

94
Additional Sources Snap fit calculator from Engineer’s Edge
snap_fit_tapered.htm Snap fit Design excerpt from Paul E. Tres’ book Annular Snap Fit article in Machine Design

95
Press Fit Issues Initial stress could cause boss to crack
Boss may have weakening weld line Continuous deflection and resultant stress could cause Cracking Stress Relaxation and reduced pull-out force

96
Boss with weld line support
General Design Principles for DuPont Engineering Polymers

97
Loss of force in press fit
When subjected to constant strain, the resulting stress in the plastics diminishes over time. Imagine a metal insert pressed into a boss. As time goes on, the plastic boss material grips the insert with less and less force. Eventually the insert may become too loose, resulting in a failed joint.

98
Questions

Similar presentations


 Spring 2008 Dr. Konstantinos A. Sierros.>")


