Download presentation
Presentation is loading. Please wait.

1
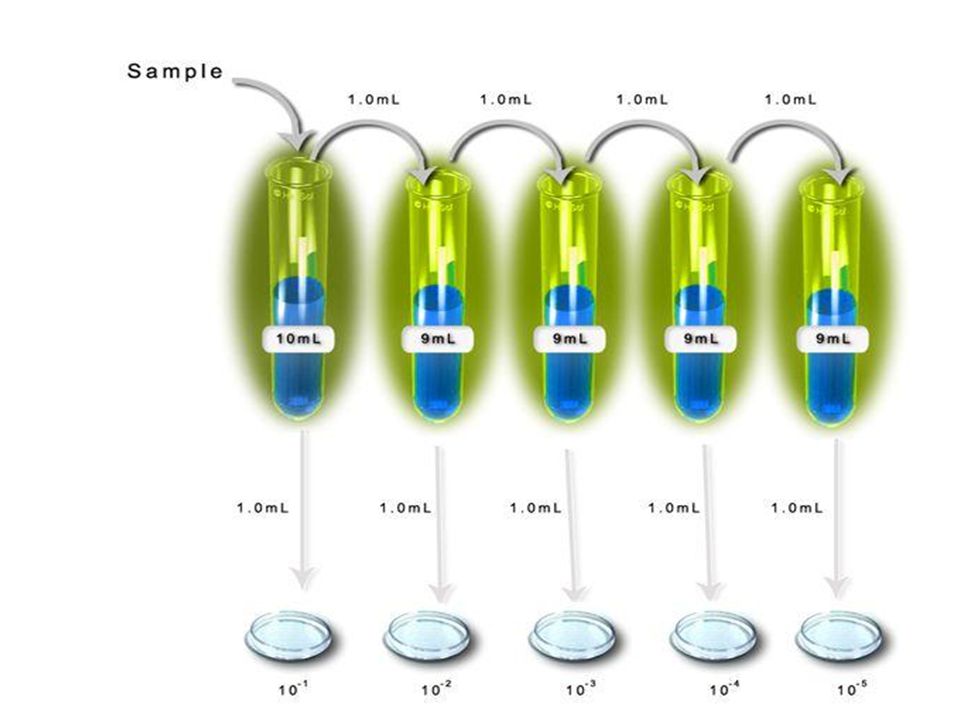
Investigation 1 What is the relationship between the concentration of a solution and the amount of transmitted light through the solution?

2
What is absorbance? Transmittance?
Groups of 3-4 students. Set absorbance at 630 nm The molarity of the solution is 6.4X10⁻⁶M or 6.4μM You were given the solution containing blue#1 dissolved in water with known concentration. Safety: all solutions can be safely flushed down the drain with copious amounts of water.

3
We will explore how light, transmitted by a solution is related to the concentration of the solution. Send one person per team to get the dilution stock ratio you are required to test.

5
Use the same cuvette (test tube) for the reference/baseline (aka auto zero) measurement and the sample measurement. This eliminates error due to difference in cuvettes. Record the % transmittance of known concentration in the data chart.

6
Sample data Solution Dilution ration Molar conc Measured Transmittance
Measured Transmittance as decimal 1 10/0 2.31 49% .49 2 8/2 1.85 58% .58 3 6/4 1.39 65% .65 4 4/6 0.924 77% .77 5 3/7 0.693 81% .81 6 2/8 0.462 87% .87 7 1/9 0.231 95% .95 8 0/10 100% 1.00

7
Step 5 and Step 6: Graph Make sure you graph the transmittance as a decimal and concentration in μM. We are trying to find a straight line that goes through zero with a positive slope. Your group will have two different suggestions that I would like you to try to graph. You will report back tomorrow your findings.

8
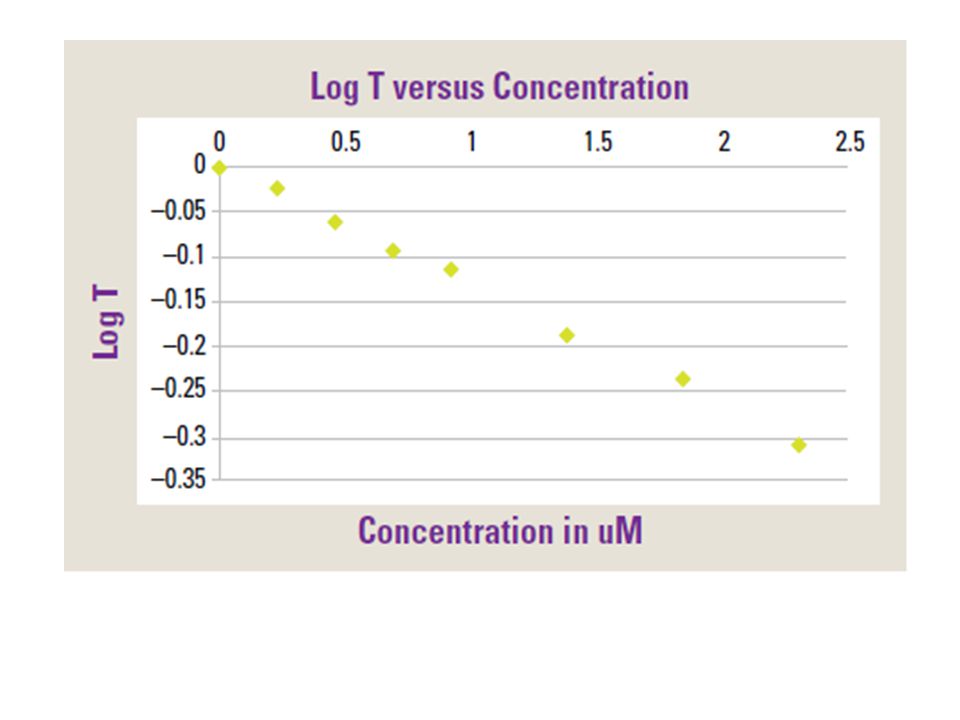
From your data graph –log T vs. [ ]
From sample data graph - Log T vs [ ] And Log T vs [ ]
![From your data graph –log T vs. [ ]](http://slideplayer.com/slide/3588590/12/images/8/From+your+data+graph+%E2%80%93log+T+vs.+%5B+%5D.jpg "From sample data graph. - Log T vs [ ] And. Log T vs [ ]")
11
And the winner is –log T vs [ ]
Called calibration line You can use this calibration line to obtain concentration of the same absorbing species in a solution of unknown concentration. HOW????
![And the winner is –log T vs [ ]](http://slideplayer.com/slide/3588590/12/images/11/And+the+winner+is+%E2%80%93log+T+vs+%5B+%5D.jpg "Called calibration line. You can use this calibration line to obtain concentration of the same absorbing species in a solution of unknown concentration. HOW")
12
The equation of the line displays the relationship between concentration and –logT.
The slope is determined and known. If you hold the instrument the same way and wavelength and cuvette the same, you can measure transmittance, manipulate data as needed and along with the slope have enough info to determine the concentration of absorbing species.

13
What is absorbance??? Transmittance???
-log T= slope [dye] which is related to absorbance which is another mode of data collection on the spectrophotometer. Absorbance is defined as Abs=- log (T) T is transmittance ( not % T decimal number)
 T is transmittance ( not % T decimal number)")
14
How does it work? The instrument passes a beam of light into a solution containing the sample and then detects how much of the light comes out of the other side of the solution. By comparing the amount of light transmitted by the pure solvent to the amount transmitted when the sample is dissolved in it we can calculate absorbance.

15
Key concept for this Abs=- log (T) relationship?
When absorbance is 1.0 only 10% if the light beam is reaching the detector. When abs is 2 only 1% of the light beam is reaching the detector. When abs is 3 only 0.1% of the light is reaching the detector. As a result accuracy and sensitivity of the low cost instrument starts to suffer at absorbance value higher than 1.5. Don’t accept measurement higher than 1.5. Dilute the sample and retest.

Similar presentations


![Scanning spectrophotometry and spectrophotometric determination of concentration BCH 333 [practical]](/19/5905269/big_thumb.jpg "Scanning spectrophotometry and spectrophotometric determination of concentration BCH 333 [practical]>")


