Download presentation
Presentation is loading. Please wait.

0
BIRTH DEFECTS : The problem beyond THE BIG THREE
Jo Edy Siswanto, dr, SpA(K) Birth Defect Team (BIDIC) Neonatology Working Group Harapan Kita Women and Children Hospital Adam and Eve (Romulus Vuia 1922)
 Birth Defect Team (BIDIC) Neonatology Working Group. Harapan Kita Women and Children Hospital. Adam and Eve (Romulus Vuia 1922)")
1
Trends of U5MR, IMR and NMR, 1991-2015 Proportion of newborn deaths contributing to child mortality
Targets in 2015: NMR : 14/ 1000 LB IMR : 23/ 1000 LB U5MR: 32/ 1000 LB 30% 43% 48% This graph shows the trends of under-5, infant and neonatal mortality rates from 1987 to During the last 10 years, the decline has been slowed down, while NMR was stagnant. As a result, the proportion of neonatal mortality to under-5 mortality is increasing from 30% in 1991 to 48% in 2012. Source: IDHS

2
Country Profile Total pop* 237.6 m Women 15-49 years* 131 m U5* 22.7 m
TFR** Total live births m MMR *** NMR** Neonatal deaths* Stillbirths (2009) Preterm babies (2010) Hospitals 2162 health centers 9557 integrated health posts Midwives Community midwives – deployed at village level) 34 provinces 98 municipalities 409 districts 6994 sub districts villages Source: *Population census 2010; **IDHS 2012; *** IDHS 2012
 Preterm babies (2010) Hospitals health centers integrated health posts Midwives Community midwives – deployed at village level) 34 provinces. 98 municipalities. 409 districts sub districts villages. Source: *Population census 2010; **IDHS 2012; *** IDHS")
3
Why do neonates die? 29/44

4
Causes of Neonatal Deaths Globally
Cause Percentage Preterm birth complications Complications during birth (mainly intrapartum hypoxia) Sepsis/meningitis/tetanus Pneumonia Congenital abnormalities Diarrhea Other conditions 73/100 UNICEF. Committing to Child Survival: a Promise Renewed. New York, NY: United Nations Children’s Fund; 2012
 23. Sepsis/meningitis/tetanus 15. Pneumonia 11. Congenital abnormalities 9. Diarrhea 2. Other conditions 6. 73/100. UNICEF. Committing to Child Survival: a Promise Renewed. New York, NY: United Nations Children’s Fund;")
5
SEAR: Major causes of mortality: Preterm, Pneumonia and Diarrhoea…
71/100 WHO. Global Health Observatory/ accessed Sep 2012)
")
6
of Congenital Anomalies
The proportion of neonatal mortality to under-5 mortality is increasing from 30% in 1991 to 48% in 2012. Is there any / how much contribution of Congenital Anomalies to infant mortality ???

7
Neonatal Mortality for 193 Countries 1990-2009 2
Neonatal Mortality for 193 Countries million (193 negara, 2010) Congenital anomalies contribute around 10% of neonatal mortality Oestergaard MZ. Neonatal Mortality Levels for 193 Countries in 2009 with Trends since 1990: A Systematic Analysis of Progress, Projections, and Priorities, 2011 Source: Adapted from WHO. Born too soon. The global action report on preterm birth. Geneva, World Health Organization, 2012
 Congenital anomalies contribute around 10% of neonatal mortality. Oestergaard MZ. Neonatal Mortality Levels for 193 Countries in 2009 with Trends since 1990: A Systematic Analysis of Progress, Projections, and Priorities, 2011 Source: Adapted from WHO. Born too soon. The global action report on preterm birth. Geneva, World Health Organization,")
8
Congenital conditions: Affect ~ 20 % of newborns
Worldwide Incidence Birth Defects & chromosomal anomalies 5 % ---- Heart defects 1 % ---- Neural tube defects 0.1 – 0.4 % ---- Down syndrome 0.16 % Single gene disorders ---- Metabolic diseases 0.13 % (1) ---- Hemoglobin disorders < / > % Preterm birth 9.6 % (2) Small for gestational age 3 – 10 % Developmental disabilities ? ---- Cerebral palsy 0.2 % (3) ---- Hearing loss 0.1 – 0.2 % (4) estimate of some selected conditions, average figures for the world population. Sanderson S, Green A, Preece MA, Burton H. The incidence of inherited metabolic disorders in the West Midlands, UK. Arch Dis Child Nov;91(11): Epub 2006 May 11. Free Full Text. Beck S, Wojdyla D, Say L, Betran AP, Merialdi M, Requejo JH, Rubens C, Menon R, Van Look PF. The worldwide incidence of preterm birth: a systematic review of maternal mortality and morbidity. Bull World Health Organ Jan;88(1):31-8. Epub 2009 Sep 25. Free Full Text. Himmelmann K, Hagberg G, Uvebrant P. The changing panorama of cerebral palsy in Sweden. X. Prevalence and origin in the birth-year period Acta Paediatr Sep;99(9): Births in India (2010) Sanderson et al. 2006, West Midlands, UK. Beck et al. 2010 Himmelmann et al. 2010, Sweden Nelson’s Textbook of Pediatrics NOTE : frequency of single gene conditions can vary considerably by population or area
 ---- Hemoglobin disorders. < / > 0.23 % Preterm birth. 9.6 % (2) Small for gestational age. 3 – 10 % Developmental disabilities Cerebral palsy. 0.2 % (3) ---- Hearing loss. 0.1 – 0.2 % (4) estimate of some selected conditions, average figures for the world population. Sanderson S, Green A, Preece MA, Burton H. The incidence of inherited metabolic disorders in the West Midlands, UK. Arch Dis Child Nov;91(11): Epub 2006 May 11. Free Full Text. Beck S, Wojdyla D, Say L, Betran AP, Merialdi M, Requejo JH, Rubens C, Menon R, Van Look PF. The worldwide incidence of preterm birth: a systematic review of maternal mortality and morbidity. Bull World Health Organ Jan;88(1):31-8. Epub 2009 Sep 25. Free Full Text. Himmelmann K, Hagberg G, Uvebrant P. The changing panorama of cerebral palsy in Sweden. X. Prevalence and origin in the birth-year period Acta Paediatr Sep;99(9): Births in India (2010) Sanderson et al. 2006, West Midlands, UK. Beck et al Himmelmann et al. 2010, Sweden. Nelson’s Textbook of Pediatrics. NOTE : frequency of single gene conditions can vary considerably by population or area.")
9
Birth Defects account for 3% to 20% U5MR
Birth Defects, Preterm births and Birth Asphyxia together account for 35% to 55% of under-5 mortality and share many risk factors Source: World Health Statistics (Acknowledge ICBDSR)
")
10
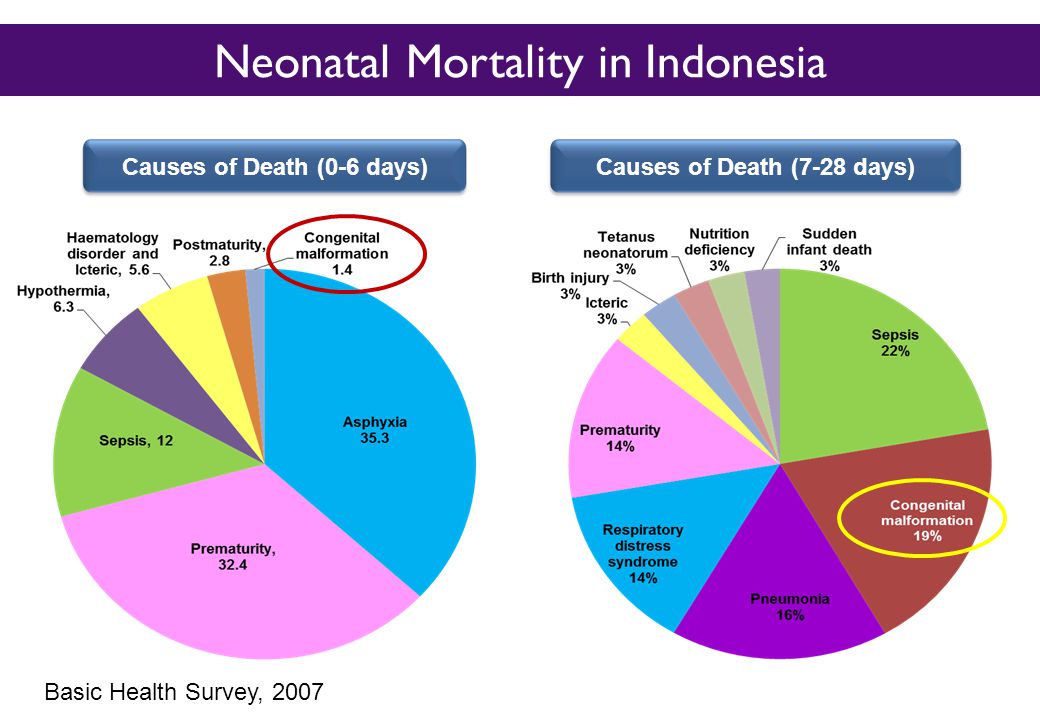
Neonatal Mortality in Indonesia
Causes of Death (0-6 days) Causes of Death (7-28 days) Basic Health Survey, 2007
 Causes of Death (7-28 days) Basic Health Survey,")
12
Neonatal Causes of Death in Indonesia
Birth defects contributed 13% of neonatal death and third largest neonatal death

13
In India, about 75% of neonatal deaths occur during the first week, nearly 13%
by the second week and the remaining deaths after two weeks. Of all newborn deaths, 37% occur on the first day and 60% occur during the first three days of life. There has been practically no change in the first week mortality data in India, a trend that is seen all over the world, despite increased institutional deliveries. In India, about 75% of neonatal deaths occur during the first week, nearly 13% by the second week

14
ONS = The Office for National Statistics

15
World Health Statistics 2010 data
Overall Under 5-year Mortality (line) and % of Deaths due to BDs (bars) by WHO Region and Country Income The impact of CMs increases as overall mortality decreases Legend Countries income: 1= High, 2=Upper-Middle, 3=Lower-Middle , 4=Low WHO Regions: AFR=Africa, AM= Americas, EM=Eastern Mediterranean, EU=Europe, SE=South East Asia; WP=Western Pacific World Health Statistics 2010 data
 and % of Deaths due to BDs (bars) by WHO Region and Country Income. The impact of CMs increases as overall mortality decreases. Legend. Countries income: 1= High, 2=Upper-Middle, 3=Lower-Middle , 4=Low. WHO Regions: AFR=Africa, AM= Americas, EM=Eastern Mediterranean, EU=Europe, SE=South East Asia; WP=Western Pacific. World Health Statistics 2010 data. lang=en.")
16
Leading Causes of Infant Death Infant deaths per 100,000 live births
(Within 1 Year): 2001 Infant deaths per 100,000 live births Black, Not Hispanic White, Not Hispanic Cause of death All races Total LBW VLBW 146.3 1271.5 2635.3 76.4 1130.5 6261.0 27.1 78.4 102.5 21.0 303.2 1655.5 Hispanic* 162.0 721.7 1291.4 113.5 230.3 262.3 85.3 630.1 2608.5 134.1 1071.8 2723.9 45.6 122.5 124.5 29.3 443.3 2438.8 Total LBW VLBW Total LBW VLBW Birth defects 137.6 1011.8 2247.8 Preterm & LBW 109.5 1361.8 7105.0 293.5 2159.3 8961.4 77.5 1081.6 6157.1 SIDS 55.5 139.4 159.4 Maternal complications 37.3 459.1 2353.6 Source: NVSS, NCHS, CDC. * Persons of Hispanic origin may be of any race.
: Infant deaths per 100,000 live births. Black, Not. Hispanic. White, Not. Hispanic. Cause of death. All races. Total. LBW. VLBW Hispanic* Total. LBW. VLBW. Total. LBW. VLBW. Birth defects Preterm & LBW SIDS Maternal. complications Source: NVSS, NCHS, CDC. * Persons of Hispanic origin may be of any race.")
17
The Greek God Hephaestus
It is interesting to note that the Greek god Hephaestus was disabled. According to myth, the god’s feet were damaged when he was thrown from Mount Olympus, the home of the Gods. Hephaestus appears as a lonely individual in Greek stories, with his beautiful wife Aphrodite and the other gods often mocking him. In the Odyssey, Hephaestus grieves, “No one is responsible for the fact that I am defective except my own parents, and I wish they had never given birth to me.”21 The Greek God Hephaestus is the middle figure in this scene, painted on a Greek amphora. His malformed feet are clearly visible

18
Defining Birth Defects
An abnormality of structure, function or metabolism (body chemistry) present at birth that results in physical or mental disabilities or death. A diverse group of disorders of prenatal origin, which can be caused by single gene defects, chromosomal disorders, multifactorial inheritance, environmental teratogens or micronutrient deficiencies Often also referred to as congenital anomalies. Congenital disorder or congenital malformations.
 present at birth that results in physical or mental disabilities or death. A diverse group of disorders of prenatal origin, which can be caused by single gene defects, chromosomal disorders, multifactorial inheritance, environmental teratogens or micronutrient deficiencies. Often also referred to as congenital anomalies. Congenital disorder or congenital malformations.")
19
KEY FACT Congenital anomalies may result in long-term disability, which may have significant impacts on individuals, families, health-care systems and societies. Although congenital anomalies may be genetic, infectious or environmental in origin, most often it is difficult to identify the exact causes. Many congenital anomalies can be prevented. For example, vaccination, adequate intake of folic acid and iodine, and adequate antenatal care are keys for prevention.

20
Prevalence of Birth Defects (MoD estimates)
Estimated number (per 1,000 – per year) of infants with birth defects (BD, Chrom, Single Gene, Genetic-Haemolysis/Jaundice) Congenital heart defects: 1,000,000 Neural tube defects: ,000 Down syndrome: ,000 This could be simple. According to this MOD estimate, somehwere around 40 per 1000, or 4% of births (between 3 and 5%) have a major structural births defects, increasing to 60 to 70 (or 6-7% if one includes Source: March of Dimes Global Report on Birth Defects, 2006
 of infants with birth defects (BD, Chrom, Single Gene, Genetic-Haemolysis/Jaundice) Congenital heart defects: 1,000,000. Neural tube defects: 350,000. Down syndrome: 220,000. This could be simple. According to this MOD estimate, somehwere around 40 per 1000, or 4% of births (between 3 and 5%) have a major structural births defects, increasing to 60 to 70 (or 6-7% if one includes. Source: March of Dimes Global Report on Birth Defects,")
21
Health impact of birth defects WHO Report 2006
Mortality: Serious birth defects can be lethal during newborn period and infancy, at least 3.3 million children under five years of age die from birth defects each year (global) Disability: an estimated 3.2 million of those who survive may have lifelong mental, physical, auditory or visual disability.
 Disability: an estimated 3.2 million of those who survive may have lifelong mental, physical, auditory or visual disability.")
22
Social and economic impact of birth defects:
poor quality of life , lifelong impairment and diminished productivity, social stigma and discrimination, Economic burden such as costly medical or surgical treatment (drugs, diagnosis and treatment), transport to and from medical facilities, long-term care of the families, communities and health systems.
, transport to and from medical facilities, long-term care of the families, communities and health systems.")
23
Several thousand different birth defects have been identified.
FACTS Tomatir, 2000 – 2004 : 2.9/1000 Han XY 1998 – 2002: prevalence 3,1%. 2003 – 2007: prevalence 8,7%, Dolk, (EUROCAT)2003 – 2007 ,prevalence : 2,39%. About 120,000 babies (1 in 33) in the United States are born each year with birth defects. Several thousand different birth defects have been identified. Birth defects are the leading cause of death in the first year of life. Tmbh pny dr.irfan
2003 – 2007 ,prevalence : 2,39%. About 120,000 babies (1 in 33) in the United States are born each year with birth defects. Several thousand different birth defects have been identified. Birth defects are the leading cause of death in the first year of life. Tmbh pny dr.irfan.")
24
In the United States... Every 8 seconds a baby is born; 10,799 babies are born daily Every 3 minutes a baby is born with a birth defect 17 babies die due to a birth defect each day More than 1 in 5 infant deaths are due to birth defects Birth defects are the leading cause of infant mortality with % of perinatal deaths due to lethal birth defects 10% of deaths in infants weighing gm 50% of deaths in infants > 1500 gm * CDC annual estimate of 150,000 babies born with birth defects Source: National Center for Health Statistics, 1998 final natality and 1998 period linked birth/infant death data. Prepared by March of Dimes Perinatal Data Center, July 2000

25
Indonesia Total babies born with birth defects annually(March of Dimes Birth Defect Foundation, 2006) Prevalensi cacat bawaan: 59,3/1000 kelahiran hidup (March of Dimes Birth Defect Foundation, 2006) 2,55% dari seluruh bayi yang lahir di RSAB Harapan Kita tahun mengalami cacat bawaan (Indrasanto E, Effendi S, 2008 )
 2,55% dari seluruh bayi yang lahir di RSAB Harapan Kita tahun mengalami cacat bawaan (Indrasanto E, Effendi S, 2008 )")
26
Burden of Birth Defects
1 in 33 infants has a birth defect (~3%) 4.8 million infants globally 1 in 260 infants dies because of a birth defect 0.6 million infants globally 1 in every 100 expected births in some countries is terminated because of a birth defect Elective Termination of Pregnancy for Fetal Anomaly (ETOPFA) not often counted in burden estimates
 4.8 million infants globally. 1 in 260 infants dies because of a birth defect. 0.6 million infants globally. 1 in every 100 expected births in some countries is terminated because of a birth defect. Elective Termination of Pregnancy for Fetal Anomaly (ETOPFA) not often counted in burden estimates.")
27
Birth Defects: Underestimated
Spontaneous Abortions ~ 15% of all clinically recognized pregnancies are spontaneously aborted ~60-70% of these are associated with BDs Stillbirths From various sources we can estimate that 10-15% of stillbirths are “due to” or are “associated with” BDs ETOPFA Impact is typically missed in official statistics and can lower the apparent mortality due to BDs (among live births) In developed countries, many ETOPFA (and in some cases most) are severe BDs Prenatal mortality due to ETOPFA, if unaccounted for, can bias estimates of the impact of BDs and of prevention interventions
 In developed countries, many ETOPFA (and in some cases most) are severe BDs. Prenatal mortality due to ETOPFA, if unaccounted for, can bias estimates of the impact of BDs and of prevention interventions.")
28
March of Dimes Global Report on Birth Defects (2006): A Paucity of Data
“There is a paucity of data on the birth prevalence of birth defects in middle- and low-income countries” Why? Constrained diagnostic capability Poor health-related statistics Lack of birth defect surveillance and registries Reliance on hospital-based rather than population-based studies Systematic underestimation of the toll of birth defects March of Dimes Global Report on Birth Defects, 2006

29
Where can the patient/family get help?
Identification magnitude of the BD problem What are the problems? When did they happen? How did they arise? Why did they occur? What is the diagnosis? Who else is at risk? Where can the patient/family get help?

30
Can anything be done to limit the frequency and impact of birth defects?
In some cases especially those that involve inherited conditions - the answer is no. However, in other cases, favorable prenatal environment and early treatment can prevent or reduce the phenotypic effects of birth defects, including a variety of defects that have a genetic basis. Although many birth defects cannot be prevented, the probability of some such conditions can be reduced through awareness of the effects of various prenatal factors, including nutrients, teratogens, and mutagens. early detection and/or treatment of congenital defects can sometimes reduce the long-term impact of these conditions, perhaps even alleviating them completely.

31
Birth Defects COUNT birth defects surveillance
HOW TO SOLVE THE PROBLEM ?? Birth Defects COUNT birth defects surveillance Continuous and systematic Monitoring Collection Analysis Interpretation Dissemination of BD data Allows for Planning Implementation and evaluation of prevention strategies Integrates data in the decision making process for birth defects prevention

32
HOW TO SOLVE THE PROBLEM
CONCEPTION Primary prevention Ennviromental prophylaxis genetic counseling NORMAL ABNORMAL GENOTYPE GENOTYPE Gene Theraphy Secondary prevention (prenatal screening selective termination ) HEALTH DISEASE Symptomatic theraphy
 HEALTH DISEASE. Symptomatic theraphy.")
33
HOW TO SOLVE THE PROBLEM ?? WHO response
In 2010, the World Health Assembly issued a report on birth defects. The report describes the basic components for creating a national programme for the prevention and care of birth defects before and after birth. It also recommends priorities for the international community to assist in establishing and strengthening these national programmes.

34
HOW TO SOLVE THE PROBLEM
In 2010 the World Health Assembly adopted a resolution calling all Member States to promote primary prevention and the health of children with congenital anomalies by: developing and strengthening registration and surveillance systems; developing expertise and building capacity; strengthening research and studies on etiology, diagnosis and prevention; promoting international cooperation.

35
The Global Strategy for Women’s and Children’s Health, launched in 2010 by the UN in collaboration with leaders from governments and other organizations like WHO and UNICEF, has been crucial in implementing high-impact and cost-effective interventions to improve neonatal and child health. WHO is also working with the US Centers for Disease Control and Prevention’s (CDC) National Center on Birth Defects and Developmental Disabilities and other partners to establish a global policy for folate fortification at the country-level and to provide needed technical expertise for the surveillance of neural tube defects, for monitoring folic acid fortification efforts and for improving laboratory capacity for folate-preventable birth defects.
 National Center on Birth Defects and Developmental Disabilities and other partners to establish a global policy for folate fortification at the country-level and to provide needed technical expertise for the surveillance of neural tube defects, for monitoring folic acid fortification efforts and for improving laboratory capacity for folate-preventable birth defects.")
36
The International Clearinghouse for Birth Defects Surveillance and Research is a voluntary non-profit international organization with an official relationship with WHO. This organization brings together birth defect surveillance and research programmes from around the world in order to investigate and prevent birth defects and to lessen the impact of their consequences. The WHO departments of Reproductive Health and Research and Nutrition for Health and Development in collaboration with International Clearinghouse for Birth Defects Surveillance and Research and CDC’s National Center on Birth Defects and Developmental Disabilities convene annual training programmes on the surveillance and prevention of congenital anomalies and preterm births. The WHO Department of HIV and AIDS collaborates with these partners to strengthen the surveillance of birth defects for women receiving antiretroviral drugs during pregnancy as integral part of the monitoring and evaluation of national HIV programmes.

37
The GAVI Alliance, of which WHO is a partner, is assisting low- and middle-income countries in improving control and elimination of rubella and congenital rubella syndrome through immunization. WHO develops normative tools, including guidelines and a global plan of action, to strengthen medical care and rehabilitation services to support the implementation of the Convention on the Rights of Persons with Disabilities. Similarly WHO supports countries to integrate medical care and rehabilitation services into overall primary health care, supports the development of community-based rehabilitation programmes and facilitates the strengthening of specialized rehabilitation centres and their links with community-based rehabilitation

38
Regional Strategic Framework on Birth Defects Prevention and Control (SEARO)
•• to establish or strengthen national policies and programmes for birth defects prevention and control; •• to develop and strengthen national birth defects surveillance, monitoring and evaluation mechanisms; •• to integrate birth defects prevention and control strategies into public health, maternal and child health, nutrition and other relevant mechanisms; •• to expand and strengthen national capacity for implementation of birth defects prevention and control programmes; and •• to develop and expand national, regional and international multisectoral partnerships and networks to support birth defects prevention and control programmes. In addition, the Framework suggests steps for national implementation and monitoring indicators for the strategic directions.

39
Newborn Health and Birth Defects
Bangladesh India Indonesia Nepal Sri Lanka Thailand Integrated Database: Newborn Health and Birth Defects WHOCCs-AIIMS Collation, analysis and reporting of data 19-21 Aug 2014 Regional Network Meeting, New Delhi

40
Prioritization of Birth Defects
Have significant public health impact Relatively easy to identify at birth or soon after birth Can be prevented by primary prevention Early diagnosis and therapy will have a major impact on quality of life of sufferers.

41
Birth Defects Priorities in Indonesia
Priority for prevention Priority in developed surveillance 1 NTD Spina bifida Anencephaly Meningo/Encephalocele 2 Oro-facial clefts Cleft palate Cleft lip Cleft lip and palate 3 Thallasaemia Genital Hypospadia Epispadia 4 CRS Congenital Cataract 5 Congenital Syphilis Atresia ani 6 Club foot Musculo sceletal Talipes equinovarus Omphalocele Gastroschizis Extremitas reduction 7 Congenital Hypothyroid Conjuncted twin

42
Living with a Birth Defect
Babies who have birth defects often need special care and interventions to survive and to thrive developmentally. Early intervention is vital to improving outcomes for these babies. The goal of BD care is NOT survival alone, but survival with an acceptable quality of life

43
Take home massage BIRTH DEFECTS : The magnitude problem beyond THE BIG THREE Birth defects are the leading cause of infant mortality with % of perinatal deaths due to lethal birth defects (developed countries) emerging problem in developing contries State birth defects tracking programs provide one way to identify and refer children as early as possible for services they need. High light : to expand and strengthen national capacity for implementation of birth defects prevention and control programmes
 emerging problem in developing contries. State birth defects tracking programs provide one way to identify and refer children as early as possible for services they need. High light : to expand and strengthen national capacity for implementation of birth defects prevention and control programmes.")
44
THANK YOU

Similar presentations


>")


: What Will it Take to Eliminate MTCT? Jessica Rodrigues Presentation for UNICEF Written.>")


