Download presentation
Presentation is loading. Please wait.

1
Puzzles in international macroeconomics

2
Six major puzzles in international macroeconomics: search for a common cause
Obsteld M. and K. Rogoff, The Six Major Puzzles in International Macroeconomics: Is There a Common Cause?, 2000, NBER Working paper 7777. Home bias in trade Saving-investment puzzle Equity home bias Consumption correlation puzzle Purchasing Power Parity Exchange rate disconnect

3
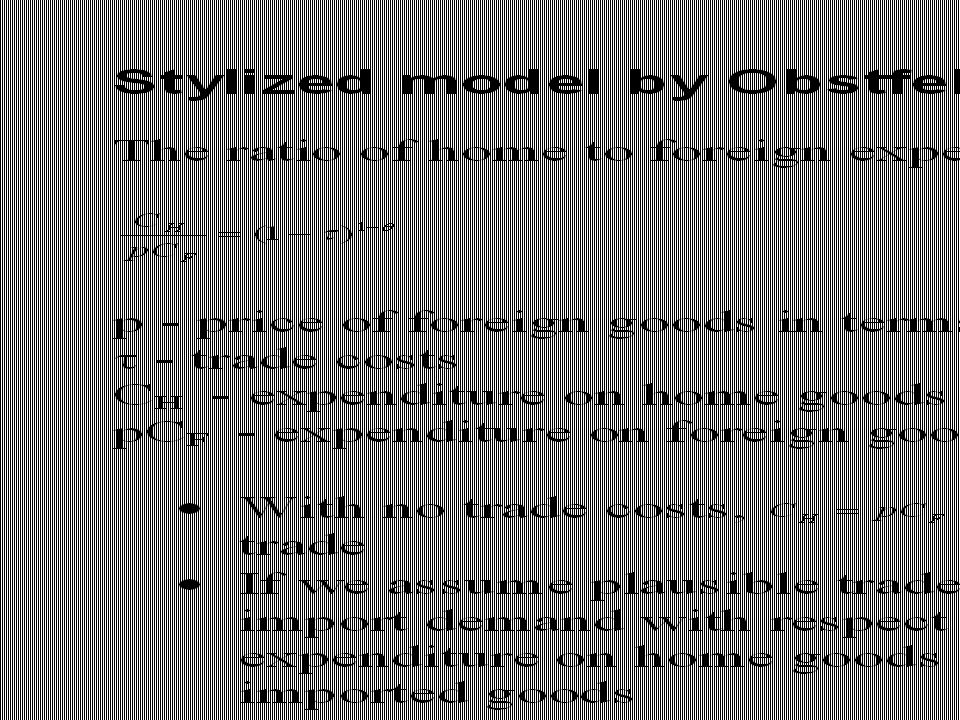
By explicitly introducing trade costs, one can go far toward explaining a great number of the main empirical puzzles. Trade costs may include transportation costs, tariffs, non-tariff barriers

4
Home bias in trade International markets are more segmented then is commonly supposed There is a substantial border effect that reduce cross-country trade How big is the border effect? Can the market segmentation be explained by trade costs of the reasonable size?

5
How big is the border effect?
McCallum 1996, National Borders Matter: Canada-US regional trade patterns, American Economic Review 85, pp

7
Trade across individual Canadian provinces was 22 times higher then between individual Canadian provinces and US states!

8
Is anything wrong with McCallum’s estimation of the border effect
Asymmetric effect on countries of different size Misspecification of the gravity equation Anderson and Wincoop (2003), Gravities with Gravitas: A solution to the Border puzzle, American Economic Review 93, pp National borders reduce trade between the US and Canada by about 44%, while reducing trade among other industrialized countries by about 30%. McCallum's spectacular headline number is the result of a combination of omitted variables bias and the small size of the Canadian economy. Within-Canada trade rises by a factor 6 due to the border. In contrast, within-US trade rises 25%.
, Gravities with Gravitas: A solution to the Border puzzle, American Economic Review 93, pp National borders reduce trade between the US and Canada by about 44%, while reducing trade among other industrialized countries by about 30%. McCallum s spectacular headline number is the result of a combination of omitted variables bias and the small size of the Canadian economy. Within-Canada trade rises by a factor 6 due to the border. In contrast, within-US trade rises 25%.")
9
Asymmetric effect on countries of different size: numerical example
With no trade barriers, Canada exports 90% of GDP to the US and sells 10% internally Suppose the border effect reduces cross-border trade by 50% Then, Canada imports 45% of GDP to US and trade 55% internally So, internal trade went up by 5.5 times, cross border trade went down by 50%, and so internal trade has increased by 11 times more then cross-border trade For US, it used to import 10% of GDP and now imports 5%. Cross-state trade has increased by 2.1 times more then cross-border trade

10
Home bias in trade Obstfeld, Rogoff 2000:
Average size trade costs combined with high elasticities of substitution of home for foreign goods can account for large part of home bias In addition, exchange rate uncertainty and difference in tastes across countries also leads to higher home good consumption

12
Empirical estimates of θ
Trefler and Lai (1999) θ=5.2 panel of 28 industries in 36 countries for the period Cheung, Finn, and Fujji (1999): θ=3.5-4 monopolistic competition model two-digit industry level data for OECD countries Hummels (1999a): θ=5.6
 θ=5.2. panel of 28 industries in 36 countries for the period Cheung, Finn, and Fujji (1999): θ= monopolistic competition model. two-digit industry level data for OECD countries. Hummels (1999a): θ=5.6.")
13
Empirical estimates of trade costs

16
Saving-investment puzzle
Feldstein, Martin, and Charles Horioka (1980) “Domestic Savings and International Capital Flows,” Economic Journal 90 (358) June, Correlation between savings and investments in OECD countries is much greater then predicted by economic models
 Domestic Savings and International Capital Flows, Economic Journal 90 (358) June, Correlation between savings and investments in OECD countries is much greater then predicted by economic models.")
18
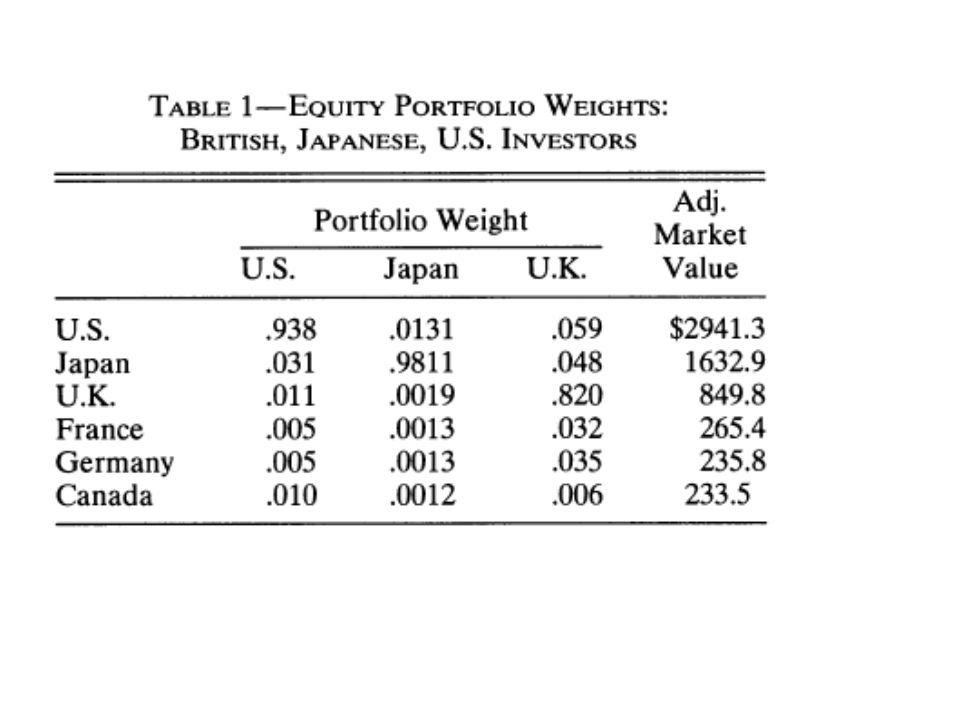
Equity home bias Equity home bias (Kenneth R. French; James M. Poterba, (1991), Investor Diversification and International Equity Markets The American Economic Review, Vol. 81, No. 2.) Economic agents prefer to keep their wealth in home assets. They diversify their portfolio less then predicted by models of risk-sharing and are overly optimistic about returns on home assets At the end of the 80th, Americans held 94 percent of their wealth in the US stock market, whereas Japanese held 98 percent of their equity wealth at home
, Investor Diversification and International Equity Markets The American Economic Review, Vol. 81, No. 2.) Economic agents prefer to keep their wealth in home assets. They diversify their portfolio less then predicted by models of risk-sharing and are overly optimistic about returns on home assets. At the end of the 80th, Americans held 94 percent of their wealth in the US stock market, whereas Japanese held 98 percent of their equity wealth at home.")
20
Consumption correlation puzzle
Consumption correlation puzzle (Backus, Kehoe, and Kydland 1992, International Real Business Cycles, Journal of Political Economy 100, pp ) International output growth rates are more highly correlated then consumption growth rates
 International output growth rates are more highly correlated then consumption growth rates.")
21
Purchasing Power Parity
Purchasing Power Parity (Rogoff, Kenneth (1996), “The Purchasing Power Parity Puzzle,” Journal of Economic Literature, Vol.34, No. 2., pp ) Does not hold in a short run, there are some evidence that it holds over the long horizon
, The Purchasing Power Parity Puzzle, Journal of Economic Literature, Vol.34, No. 2., pp ) Does not hold in a short run, there are some evidence that it holds over the long horizon.")
22
Exchange rate disconnect
Exchange rate disconnect (Baxter, M and A. Stockman, 1989, Business Cycles and Exchange Rate regime: some international evidence, Journal on Monetary Economics, 23, pp ) Weak connection between exchange rates and virtually any macroeconomic aggregates
 Weak connection between exchange rates and virtually any macroeconomic aggregates.")
Similar presentations


 Chairman,>")


; Kaminsky,>")


 IBUS 302: International Finance Topic 16–Portfolio Analysis Lawrence Schrenk, Instructor.>")


 LOP Conditions for LOP to hold 2. Purchasing Power Parity (PPP)>")


 A change in the money supply results in.>")
 The roadmap 2. Risk Sharing and the Benefits of Portfolio.>")


