Download presentation
Presentation is loading. Please wait.

1
Ch. 2 Clicker Review 7th grade Mr. Murray

2
1. spring scale 2. a meniscus 3. a triple beam balance
Which of the following would you use to measure the mass of a flip flop? 1. spring scale 2. a meniscus 3. a triple beam balance 4. graduated cylinder

3
The most important lab safety rule is
always wear safety goggles. always follow your teacher’s instructions and lab or textbook directions exactly. always wear an lab apron. design and conduct your own experiments without asking your teacher.

4
Which of these is incorrect? To measure __________ use _______.
Mass, a graduated cylinder Length, a metric ruler Time, seconds Volume, L x H x W or water displacement

5
Which of these is incorrect?
Mass = grams Weight = newtons Length = meters Volume = g/cm3

6
Which of these is incorrect?
5 kg = 5000 g 2 L = 2000 mL 3 m = 30 cm 10 decigrams = 1 g

7
Which of these is correct?
Boiling point is 100 degrees Celsius. Freezing point is 0 degrees Fahrenheit. Boiling point is 273 degrees Kelvin. Freezing point is 0 degrees Kelvin.

8
Accurate but not precise Precise but not accurate
If the data collected when measuring your dog’s tail was 27 cm, 36 cm, 25 cm, and 39 cm and the actual value was 30 cm, you could conclude that your data was. . . Accurate and precise Accurate but not precise Precise but not accurate Neither accurate nor precise.

9
anomalous data. a significant figure. an estimate. a percent error.
If the data collected for the temperature outside for this week was 82o, 78o, 15o, 75o, and 83o, we would say that the 15o is anomalous data. a significant figure. an estimate. a percent error.

10
For which of the following would the millimeter be the most appropriate unit of measure?
The length of a belt. The height of a bee. The distance from Chesterland to Mayfield. The density of a pin.

11
What does it most likely mean if a graph shows no identifiable trends?
There are more than two variables. There is a strong relationship between the variables. The graph has no use or value. There is no relationship between the variables.

12
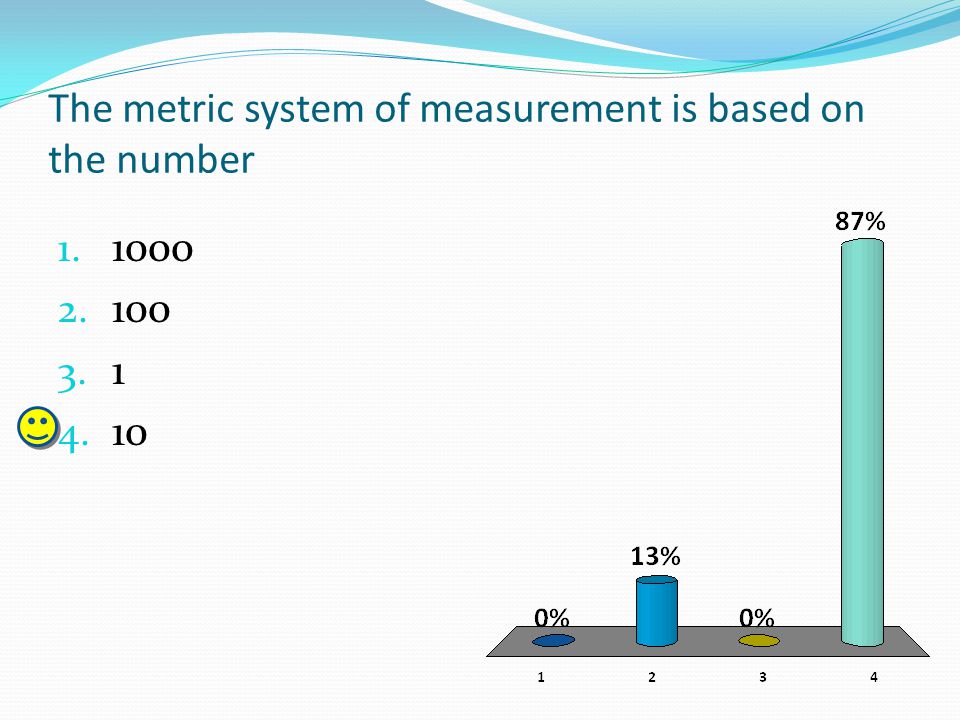
The metric system of measurement is based on the number
1000 100 1 10
13
If scientists cannot obtain exact numbers, they should rely on
precision significant figures estimation anomalous data

14
To determine how close to the true value an experimental value is, you would use
percent error precision significant figures accuracy

15
A line graph in which the data points fall along a straight line is called a
linear graph. anomalous graph. nonlinear graph. a faulty graph.

16
What is the first thing you should do if an accident occurs in your classroom?
Start first aid treatment. Find the emergency equipment. Call 911. Notify your teacher.

17
A group of parts that work together is called a:
process system feedback model

18
The average number in a set of data is . . .
Mean Median Mode Range

19
The difference between the greatest and least number in a data set is called the . . .
Percent error Median Mode Range

20
The number that repeats the most in a set of data is called the . . .
Mean Median Mode Range

21
The middle number in a set of data when arranged from greatest to least.
Mean Median Mode Significant figure

22
To calculate the density of an object, you would
Multiply L x W x H Divide volume by mass. Multiply weight x volume. Divide mass by volume.

23
Which of these prefixes is correct?
Deka = 100 Hecto = 10 Milli = 1/100 Kilo = 1000

24
In SI, the kilogram is the basic unit of
Mass Volume Weight Density

25
Mass and weight are different on the Moon because
mass measures the force of gravity on an object. weight measures the amount of matter an object contains. weight measures the force of gravity on an object. mass measures the space an object takes up.

26
The amount of space an object takes up is its
density volume weight mass

27
The official SI unit of temperature is
Fahrenheit Kelvin Celsius The boiling point of water.

28
The closeness of a measurement to its true value is its
precision percent error accuracy significant figure

29
A line graph shows what variables were controlled in an experiment
how the dependent variable changes in response to the independent variable. the input, process and output of a system changes in the independent variable

30
A screw has a volume of 3 ml and a mass of 15 grams
A screw has a volume of 3 ml and a mass of 15 grams. What is its density? 5 g/cm3 45 g/ml .2 g/cm3 .2 g/ml

31
Objects that have a density ___ 1.0 g/cm3 will ____.
Less than, sink Greater than, float Equal to, sink Less than, float

32
The significant figures in a measurement include
the digits that have been measured exactly, plus one digit whose value has been estimated. only the digits that have been measured exactly. only the digit whose value has been estimated. only zeroes that are after the decimal point.

33
If a shoe box measures 6.2cm high, 7.8 cm wide, & 21 cm long . . .
What is its volume?

34
If the data set is: 2, 7, 19, 13, 5 What is the mean?

35
If the data set is: 2, 7, 19, 13, 5, 1 What is the median?

36
If the data set is 22, 33, 44, 55, 22, 33, 55, 66, 33. What is the mode?

37
If the data set is If the data set is: 2, 7, 19, 13, 5, 1
What is the range?

38
If the density of water is 1. 0 g/cm3, and you found it to be 1
If the density of water is 1.0 g/cm3, and you found it to be 1.2 g/cm3. What is your percent error? Hint: experimental –actual x 100% actual

39
Why are line graphs said to be powerful tools?
They show how different sets of data are related. They are easier to make than bar graphs. They can show both numerical and categorical data. They give more information than bar graphs.

40
After you have completed a lab investigation you should do all of the following except
turn off, unplug, and return any equipment to its proper place. pour all liquid wastes down the sink drain. wash your hands thoroughly. clean up your work area.

41
What units would you use to measure the volume of a pop-tart box?
Kg/m3 g/cm3 ml cm3

42
Scientists have developed models for the structure of molecules because
molecules move to fast. molecules are hazardous. molecules are too small. molecules are too far away.

43
For which of the following would the kilometer be the most appropriate unit of measure?
The distance from Solon to Chesterland. The length of a car. The length of a nail. The weight of a jet plane.

44
If you spill a chemical on your skin, after notifying your teacher, you should
cover the spill with a dressing. flush the skin with large amounts of water. go to the emergency room. apply an ice pack.

45
feedback process output input
In a home central heating system, when the room temperature measured by the thermostat reaches a set value, the thermostat switches off the heater. This action by the thermostat is an example of feedback process output input

46
simple models graphs diagrams computer programs
Scientists use which of the following to examine models of complex systems? simple models graphs diagrams computer programs

Similar presentations


