Download presentation
Presentation is loading. Please wait.

1
The Elephant in the Dark:
Resolving evolutionary patterns across timescales

2
One by one, we go in the dark and come out
… One by one, we go in the dark and come out Saying how we experience the animal One of us happens to touch the trunk. “A water-pipe kind of creature.” Another, the ear. “A very strong, always moving Back and forth, fan-animal.” Another, the leg. “I find it still, Like a column on a temple.” Another touches the curved back. “ A leathery throne” Another, the cleverest, feels the tusk. “A rounded sword made of porcelain.” He’s proud of his description. Each of us touches one place And understands the whole in that way. The palm and fingers feeling in the dark are How the senses explore the reality of the elephant If each of us held a candle there, And if we went in together, We could see it. -The Elephant in the Dark Rumi (Translated by Coleman Barks)
")
3
Another, touches extant populations,…
“A very strong, always moving back and forth [process]”

4
Another, the fossil record, …
“I find it still, like a column on a temple [with occasional punctuations]”

5
Another, the phylogeny…
…Brownian Motion might be a good approximation.

6
How can the evolutionary pattern be all these things?
Contemporary field studies Rapid evolution High genetic variation Strong selection Fossil record Stasis over millions of years Geographic variation Extinction and species turnover Comparative methods Variance increases through time High morphological diversity Brownian motion fits reasonably

7
How can we see the pattern across scales of time?
All studies of phenotypic evolution measure comparable quantities Allochronic Synchronic Time interval Pop A mean(z) Pop B mean(z) Pop A mean(z) Pop B mean(z) Time interval Pop X We measure two quantitaties: (1) “time for evolution” (2) Δ mean
 Pop B. mean(z) Pop A. mean(z) Pop B. mean(z) Time interval. Pop X. We measure two quantitaties: (1) time for evolution (2) Δ mean.")
8
Divergence isn’t dependent on time?
Estes and Arnold 2007 Historic Field Studies Fossil Record Divergence isn’t dependent on time?

9
Why is there no time-span effect?
How can this be consistent with strong phylogenetic signal for body size traits? Thomas F Hansen University of Oslo

10
Body size is known to have a strong phylogenetic signal
Smith et al Phylogenetic heritability of body size between sister species of mammals (think of the plot like a sib-sib regression)
")
11
Divergence isn’t dependent on time?
Estes and Arnold 2007 Historic Field Studies Fossil Record Divergence isn’t dependent on time?

12
Estes & Arnold (2007) Neutral drift in trait or adaptive optimum
Stabilizing selection Displaced optimum Moving optimum White noise motion of the optimum Peak shift

13
Estes and Arnold 2007 Well, the biggest compilation of data to date says no. Estes and Arnold compiled Field, Historic and Fossil data and plotted time measured in generations against divergence. They find no support for Brownian motion, largely because of this surprising result: The amount of divergence expected over 10 generations is essentially the same as that expected over 10 million. That is, there is no relationship between the evolutionary time separating populations, and the expected divergence.

14
So how are we going to visualize this
So how are we going to visualize this. We can easily just plot “time for evolution” on the x-axis, and on the y-axis the metric we are going to measure the change in mean by is the mean of the log-scaled measurements, so that divergence is a measure of the proportional change in a linear trait measurement. What do we expect evolution to look like? Time (Raw timescale)
")
15
Example: Brownian Motion process
If evolution looks like brownian motion, then we expect lineages to look something like this, where if there is no time between populations, we expect no divergence, and the longer the period of “evolutionary time” between populations, the larger the divergence. Time (Raw timescale)
")
16
Example: Brownian Motion process
Being a nicely behaved statistical model, we can put confidence limits on that. But notice that we are not looking “across” time here, as microevolutionary divergence occupies a vanishingly small sliver of this graph. So we need to go to logged-scaled time. Time (Raw timescale)
")
17
Example: Brownian Motion process
And this is the shape of Brownian motion on the log scale. So is that what the elephant looks like? Time (Log timescale)
")
18
Comparative data Historic Field Studies Fossil Record

19
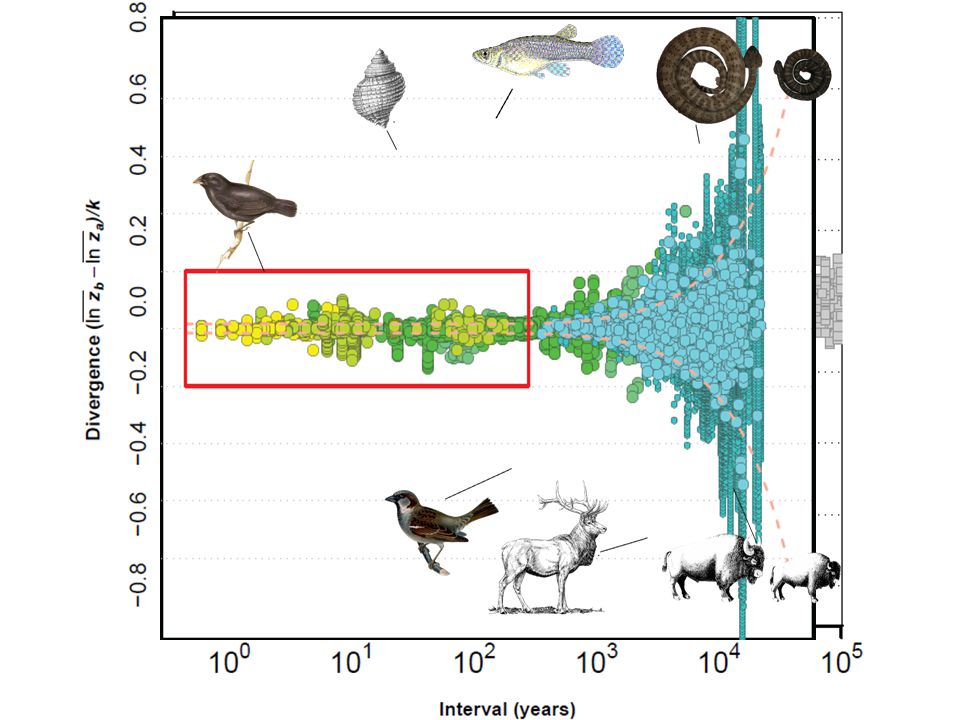
Let’s combine with comparative data:
Log-scaled linear body size traits e.g. ln(height) or ln( mass1/3) Taxa- Many, but mostly vertebrates Field and historic data (e.g. Hendry et al. 2008) Fossil record (e.g. Gingerich 2001) Comparative data: Time-calibrated phylogenies & body size databases Mammals, Birds & Squamates So let’s try again. This time we’re only going to look at a single class of traits, linear body size measurements. We’re going to look at all taxa together, but we’re also going to subdivide these out to look at individual groups. As in Estes and Arnold, we combine field and historic data, along with data from the fossil record. However, we expand this dataset considerably by including data from comparative methods. That is by measuring divergence between extant populations and calculating “evolutionary time” by summing the branch lengths separating species using time-calibrated phylogenies. What does this look like.
 or ln( mass1/3) Taxa- Many, but mostly vertebrates. Field and historic data. (e.g. Hendry et al. 2008) Fossil record. (e.g. Gingerich 2001) Comparative data: Time-calibrated phylogenies & body size databases. Mammals, Birds & Squamates. So let’s try again. This time we’re only going to look at a single class of traits, linear body size measurements. We’re going to look at all taxa together, but we’re also going to subdivide these out to look at individual groups. As in Estes and Arnold, we combine field and historic data, along with data from the fossil record. However, we expand this dataset considerably by including data from comparative methods. That is by measuring divergence between extant populations and calculating evolutionary time by summing the branch lengths separating species using time-calibrated phylogenies. What does this look like.")
20
Microevolutionary data
yellow is allochronic and green is synchronic.

21
Fossil data We’ve expanded the use of the time-series from Estes and Arnold by including longer term trends, and not just autonomous divergence.

22
Comparative data Mammals
And now we’re adding the comparative data for mammals.

23
Comparative data Birds Fade the mammals, add birds.

24
Comparative data Squamates and squamates.

25
Mammalian, Avian and Squamate body size
Comparative data Mammalian, Avian and Squamate body size And all together now.

26
To give a sense of what log-scaled divergence means
To give a sense of what log-scaled divergence means. This time-series tracks the evolution of Hyracotherium, the dawn horse, to modern horses. This is a 5-7 fold increase in linear body size dimensions.

27
“The Evolutionary Blunderbuss” ™ Stevan J Arnold
Comparative data Mammalian, Avian and Squamate body size And all together now.

28
If we look at within groups, not only is the pattern consistent, but the timing as well.

32
Study bias?

34
“The Stasis Distribution” and
Models must explain: “The Stasis Distribution” and Longer term trends of accumulating variance

35
Two-layer process

36
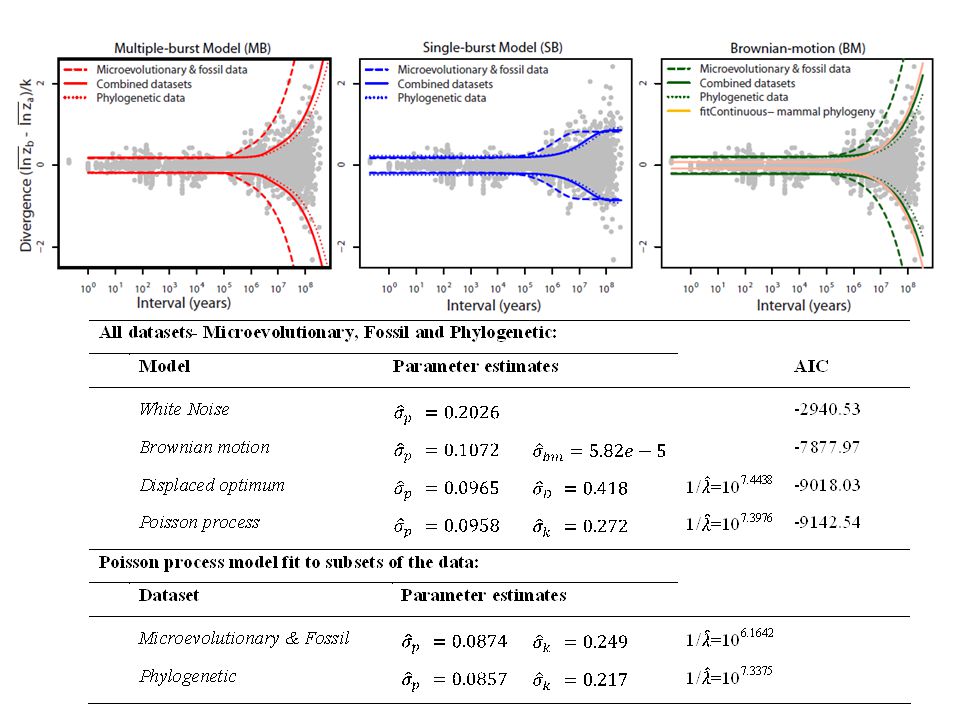
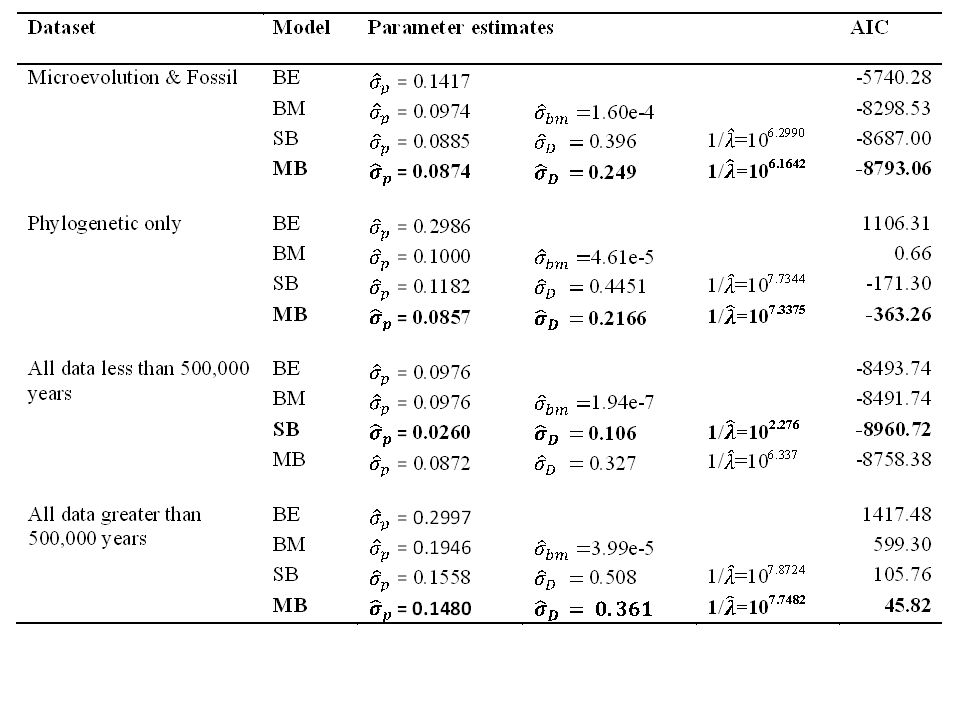
Stochastic models Bounded Evolution (BE) Brownian Motion (BM) Single-burst (SB) – Exponential time to displacement Multiple-burst (MB) – Poisson Point Process
 – Poisson Point Process.")
38
Multiple-Burst Model Punctuational change Stasis distribution:
± 10% linear size change (1 SD) (ME + phenotypic plasticity + evolutionary change + genetic drift) Burst distribution: ± 30% linear size change (1 SD) Average time to displacement = 25 my
 (ME + phenotypic plasticity + evolutionary change + genetic drift) Burst distribution: ± 30% linear size change (1 SD) Average time to displacement = 25 my.")
39
Multiple-Burst Model: bootstrapped over studies

41
Why millions of years? What process accounts for this pattern?

42
What pattern makes evolution look like Brownian motion over macroevolutionary time?
Genetic drift (Lande 1976)? No, parameters do not work Drift of a local adaptive peak? No, or we could never measure selection A statistical pattern in need of an interpretation
 No, parameters do not work. Drift of a local adaptive peak No, or we could never measure selection. A statistical pattern in need of an interpretation.")
43
What then, is randomly walking?
“Niches” Not a real answer We need more focus on interpretation and causation!

44
Is there anything significant about 1-5 milllion years?
Species life-spans for mammals are ~1-5 million years (Alroy et al. 2000; Liow et al. 2008) Marine inverts my (Foote, 2007) Taxon cycles are suggested to occur on the order of my (Ricklefs & Bermingham 2002)
 Marine inverts my (Foote, 2007) Taxon cycles are suggested to occur on the order of my. (Ricklefs & Bermingham 2002)")
45
Liow et al. 2008

46
Liow et al. 2008

47
Foote 2007

49
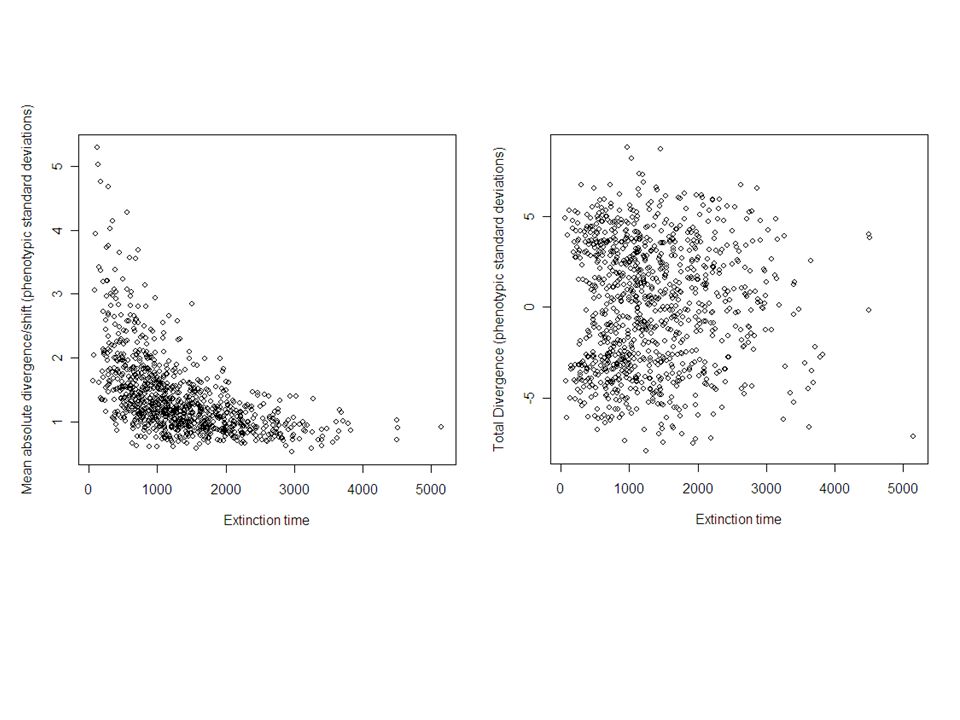
What role could demography & extinction play?
Similar to models proposed by Eldredge et al. (2005) As fitness-related mean trait value deviates from θ, mean population fitness declines according to a Gaussian function.
 As fitness-related mean trait value deviates from θ, mean population fitness declines according to a Gaussian function.")
50
Population growth (Burger & Lynch 1995)
Let the population grow at a multiplicative growth rate, Rt, such that: and when , otherwise where B is the maximum population growth rate and K is the carrying capacity.

51
Constant population size: Divergence increases with time
Addition of demography: Divergence decreases with time G/(ω2 +1)=0.01 σ2ө = 2.25 λ = 1/250, Linear increase in average divergence expected G/(ω2 +1)=0.01 σ2ө = 2.25 B=1.025 λ = 1/250 N0 = 10000
=0.01 σ2ө = 2.25 λ = 1/250, Linear increase in average divergence expected. G/(ω2 +1)=0.01 σ2ө = 2.25 B= λ = 1/250 N0 =")
55
1/2000 1/250 1/1000

59
From adaptive landscapes & G-matrices to phylogenetic stochastic models
Need to account for the scaling from populations species e.g. Futuyma’s ephemeral divergence model Demography, and the dynamics of species ranges over time (including speciation) can be factored in to explain shifts in species means The ultimate “cause” of evolutionary change is change in adaptive landscapes
 can be factored in to explain shifts in species means. The ultimate cause of evolutionary change is change in adaptive landscapes.")
60
Key parameters Birth rate must be low such that populations grow slowly, even when optimal Selection and inheritance parameters must not be so strong as to prevent any divergence at all, or the model fails to explain rapid divergence over short time scales.

Similar presentations


 selection New niches Mutation New species.>")


